Abstract
This article describes the SRI24 atlas, a new standard reference system of normal human brain anatomy, that was created using template‐free population registration of high‐resolution magnetic resonance images acquired at 3T in a group of 24 normal control subjects. The atlas comprises anatomical channels (T1, T2, and proton density weighted), diffusion‐related channels (fractional anisotropy, mean diffusivity, longitudinal diffusivity, mean diffusion‐weighted image), tissue channels (CSF probability, gray matter probability, white matter probability, tissue labels), and two cortical parcellation maps. The SRI24 atlas enables multichannel atlas‐to‐subject image registration. It is uniquely versatile in that it is equally suited for the two fundamentally different atlas applications: label propagation and spatial normalization. Label propagation, herein demonstrated using diffusion tensor image fiber tracking, is enabled by the increased sharpness of the SRI24 atlas compared with other available atlases. Spatial normalization, herein demonstrated using data from a young–old group comparison study, is enabled by its unbiased average population shape property. For both propagation and normalization, we also report the results of quantitative comparisons with seven other published atlases: Colin27, MNI152, ICBM452 (warp5 and air12), and LPBA40 (SPM5, FLIRT, AIR). Our results suggest that the SRI24 atlas, although based on 3T MR data, allows equally accurate spatial normalization of data acquired at 1.5T as the comparison atlases, all of which are based on 1.5T data. Furthermore, the SRI24 atlas is as suitable for label propagation as the comparison atlases and detailed enough to allow delineation of anatomical structures for this purpose directly in the atlas. Hum Brain Mapp, 2010. © 2009 Wiley‐Liss, Inc.
Keywords: brain atlas, multispectral magnetic resonance imaging, diffusion tensor imaging, unbiased population registration, spatial normalization, label propagation
INTRODUCTION
An anatomical atlas, like a geographical atlas, provides a standardized coordinate system in which structures and their spatial relationships with each other are represented. Digital atlases, in particular, commonly take the form of three‐dimensional (3D) images that depict anatomy by means of one or more morphological imaging modalities, for example, X‐ray computed tomography, or magnetic resonance imaging (MRI). These are often accompanied by maps of semantic labels, so‐called segmentations, which delineate various structures of interest. As Mazziotta et al. [ 1995] point out, however, anatomy is different in every individual, and thus, unlike geography, does not have an underlying unambiguous and invariant physical reality.
Many atlases of different anatomies have, therefore, been created. Some atlases are based simply on a single individual, such as the well‐known Talairach atlas [Talairach and Tournoux, 1988] of the human brain, the whole‐body Visible Human dataset [Spitzer et al., 1996], or the atlas of the rat brain by Bai et al. [ 2006]. Other atlases attempt to capture subject‐independent properties by virtue of being constructed from populations of individuals. Population atlases have been created of the human brain [Kazemi et al., 2007; Mazziotta et al., 2001a, b; Woods et al., 1999], and other species, including the rat [Toga et al., 1995]; the honey bee, Apis Melifera [Brandt et al., 2005; Rohlfing et al., 2001]; the desert locust, Schistocerca gregaria [Kurylas et al., 2008]; and the fruitfly, Drosophila [Jenett et al., 2006; Rein et al., 2002]. More detailed atlases that focus on particular organs or anatomical regions are also common, such as the recently presented comprehensive map of the Drosophila olfactory system at the single‐neuron level [Jefferis et al., 2007].
Atlases of the human brain based on MRI provide standard anatomical coordinate systems for joint data analysis. They are also used to define anatomical structures and to propagate them to individual images (atlas‐based segmentation), where they can then serve in such diverse applications as stereotactic localization [Kikinis et al., 1996] or as standardized seed and target regions in population studies of fiber tracking [Mori and van Zijl, 2002; Mori et al., 2008] in diffusion tensor images (DTI) [Basser and Pierpaoli, 1996].
We present in this work a new brain atlas that is based on high‐resolution MRI acquired at 3T from 24 subjects. The “SRI24 atlas” improves on currently available atlases in several ways: it includes multiple coregistered acquired data channels (structural MRI, DTI) and derived measures (FA, MD, tissue classes, anatomical region definitions). Registrations between the atlas and subject images can, therefore, be computed using potentially more robust and accurate multichannel registration techniques [Boes and Meyer, 1999]. Brain anatomy in the SRI24 atlas is represented in an unbiased population‐average coordinate system, which minimizes the deformation between the atlas and individual brains, thus improving the robustness and accuracy of registration. Finally, the SRI24 atlas is crisp enough for region definition, and thus for label propagation (atlas‐based segmentation) [Miller et al., 1993]. The two latter properties eliminate the need to use different atlases for spatial normalization and label propagation and enable consistent studies that require both, such as quantitative fiber tracking‐based comparisons across the normal adult age range [Sullivan et al., in press] and between diagnostic groups [Pfefferbaum et al., 2009b].
Different atlases are typically used for spatial normalization and label propagation. Atlases for spatial normalization usually represent subject‐independent anatomical relationships derived from a population of individuals, but contain some residual uncertainty of spatial localization due to imperfect alignment (i.e., registration) across individuals. Atlases for label propagation, on the other hand, are commonly based on images obtained from a single individual [Hammers et al., 2002; Holmes et al., 1998; Tzourio‐Mazoyer et al., 2002], so that anatomical landmarks are well‐defined, albeit in a coordinate system that is not necessarily a good representative of the population of interest. When used for label propagation, population atlases typically rely on probabilistic label maps [Mazziotta et al., 1995, 2001a, b; Shattuck et al., 2008], which represent the probabilities of finding a given structure at a given pixel, thus allowing for the inherent uncertainty of the average coordinate system. As we show herein, however, spatial uncertainty of blurry atlases causes coregistration problems that substantially degrade label propagation accuracy.
The remainder of this article is organized as follows. The “Atlas Construction” section describes in detail the rationale and methods behind the construction of the SRI24 atlas and provides an overview of all information channels used in the actual atlas construction. “Atlas Applications” presents examples of applications in spatial normalization and label propagation that used the SRI24 atlas. Further improving on an earlier conference presentation of the SRI24 atlas [Rohlfing et al., 2008], we describe two recently added cortical parcellation maps. The first map, which we refer to as the SRI24/TZO map, is based on the template by Tzourio‐Mazoyer et al. [ 2002], to which we added spatially encoded manual delineations of additional anatomical structures. The second parcellation map, referred to as the SRI24/LPBA40 map, is based on the LONI Probabilistic Brain Atlas of 40 subjects [Shattuck et al., 2008]. Both label maps are distributed with the atlas. Finally, in “Distribution”, we detail the availability of the atlas to the scientific community, including a summary of distributed image file formats and region label encodings in the parcellation masks.
ATLAS CONSTRUCTION
Rationale
To maximize the usefulness of the SRI24 atlas, we imposed several requirements that guided the design of the image acquisition protocols and image processing pipeline. In particular, the atlas is based on image data acquired using state‐of‐the art imaging equipment and techniques, represents normal human brain anatomy across a large age range, and provides the most commonly used channels of MR image information (see “Imaging and Subjects”).
To facilitate robust and accurate spatial normalization, the atlas is defined in a population‐average coordinate system that minimizes deformations between the atlas and individual subject images. At the same time, the atlas is sufficiently crisp to display clear boundaries of distinct anatomical structures and enable the outlining of meaningful labeled regions. We simultaneously achieved these last two goals by applying an unbiased, fully nonrigid groupwise intersubject registration algorithm in the construction of the atlas (see “Template‐Free Unbiased Intersubject Image Registration”).
Imaging and Subjects
Volunteers were 12 young (25.5 ± 4.34, range = 19–33 years, 6 male and 6 female) and 12 elderly (77.7 ± 4.9, range = 67–84 years, 6 male and 6 female), right‐handed, nonsmoking healthy men and women, recruited from the local community for studies of normal aging [Zahr et al., 2008, 2009]. All participants underwent a thorough psychiatric interview by a trained research psychologist using the Structured Clinical Interview for the Diagnostic and Statistical Manual (DSM) IV to exclude subjects with psychiatric diagnoses or medical conditions that can affect brain functioning (e.g., diabetes, head injury, epilepsy, substance abuse) or preclude safe MR examination (e.g., pacemakers). A detailed alcohol history was also taken from each participant to exclude subjects with a history of alcohol abuse or alcohol dependence.
The young and the elderly groups did not differ significantly in education or estimated general intelligence, although the elderly had a higher socioeconomic status than the young [Hollingshead, 1975]. The elderly scored lower (137.3 ± 4.7) than the young (141.4 ± 2.6) on the Dementia Rating Scale, but the cutoff for dementia is ≤124 out of 144 [Mattis, 1988], and all subjects scored well within the normal range of previously published values for healthy elderly individuals living in the community [e.g., 137.5 ± 5.2; Vitaliano et al., 1984]. The body mass index (BMI) was significantly greater for the elderly (26.6 ± 4.6 kg/m2) than the young (23.1 ± 13.0 kg/m2), with the elderly slightly overweight on average (BMI between 25.0 and 29.9 kg/m2), but close to the mean BMI calculated from the 5,200 subjects participating in the cardiovascular health study (26.3 ± 3.9 kg/m2) [Janssen et al., 2005]. The elderly also had significantly higher systolic blood pressure (135.9 ± 221.8 mm Hg) than the young group (114.0 ± 16.2 mm Hg), but all were in the prehypertensive range (i.e., between 120 and 139 mm Hg).
Imaging was performed on a 3.0T GE scanner with an 8‐channel head coil. Some sequences used the temporal acceleration of GE's Array Spatial Sensitivity Encoding Technique. In ∼40 min per subject, four imaging sequences were collected:
-
1
For T1‐weighted structural images: 3D axial IR‐prep SPoiled Gradient Recalled (SPGR), TR = 6.5 ms, TE = 1.54 ms, FOV = 240 × 240 mm, 256 × 256 pixels, number of slices = 124, slice thickness = 1.25 mm, interslice gap = 0 mm.
-
2
For proton density‐weighted (hereafter, early‐echo) and T2‐weighted (hereafter, late‐echo) images: 2D axial dual‐echo fast spin echo (FSE), TR = 10,000 ms, TE = 14/98 ms, FOV = 240 × 240 mm, 256 × 256 pixels, number of slices = 62, slice thickness = 2.5 mm, interslice gap = 0 mm.
-
3
For diffusion tensor computation: 2D echo‐planar diffusion‐weighted images (DWI), TR = 7,500 ms, TE = 97.6 ms, number of slices = 62, slice thickness = 2.5 mm, interslice gap = 0 mm, b = 0 (5 NEX), plus 15 noncollinear diffusion directions b = 860 s/mm2 (2 NEX), plus 15 opposite polarity noncollinear diffusion directions b = 860 s/mm2 (2 NEX) FOV = 240 mm, x‐dim = 96, y‐dim = 96, reconstructed to 128 × 128 pixels.
-
4
For field map computation to spatially unwarp DWI: 2D axial dual‐echo gradient echo (GRE), TR = 460 ms, TE = 3/5 ms, number of slices = 62, slice thickness = 2.5 mm, interslice gap = 0 mm.
In the DWI, eddy‐current distortions were minimized on a slice‐by‐slice basis by within‐slice registration that takes advantage of the symmetry of the opposing polarity acquisition. The individual repeat acquisitions for each diffusion direction were averaged, eliminating the need to account for the cross terms between imaging and diffusion gradients [Neeman et al., 1991], producing 15 images per location for tensor computation. A field map was constructed from the complex difference image between two echoes (3 and 5 ms) of the GRE after unwrapping with PRELUDE. B0 inhomogeneity distortion was corrected with FSL's Utility for Geometrically Unwarping EPIs (FUGUE).
For the youngest (19 years) and the oldest (84 years) subject, slices from the acquired data are shown in Figure 1, as well as corresponding slices from the DTI‐derived fractional anisotropy (FA) and mean diffusivity (MD) maps and three‐compartment tissue segmentations.
Figure 1.
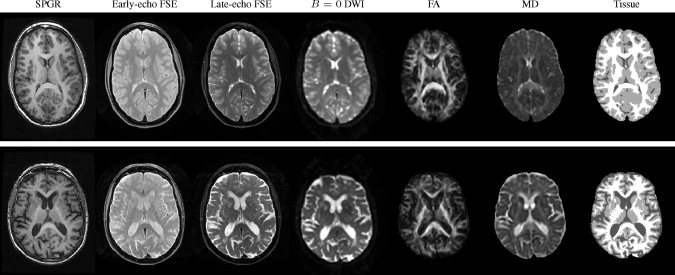
Images of the youngest (19 years; top row) and oldest (84 years; bottom row) of the 24 subjects. Images are shown here after within‐subject alignment and, for SPGR, early‐ and late‐echo images, with MR bias field correction.
Image Preprocessing
For each subject, the following preprocessing steps were performed to correct imaging artifacts and align all image channels:
-
1
A coarse head‐versus‐background mask was extracted by thresholding the late‐echo FSE image.
-
2
For FSE intensity inhomogeneity correction, a second‐order polynomial multiplicative bias field was computed from the early‐echo FSE image using the previously generated late‐echo head mask using a model‐free entropy‐minimization algorithm [Likar et al., 2001]. This bias field was then also applied to the late‐echo image, because the bias correction algorithm worked more reliably on the early than on the late‐echo images. Applying the same multiplicative bias field to both echos also guaranteed invariance of T2 times (and the associated rates, R2), which can be derived at each pixel from the log‐ratio of early and late‐echo image intensities [Pfefferbaum et al., in press].
-
3
A brain mask was extracted from bias‐corrected late‐echo image using the FSL Brain Extraction Tool, BET [Smith, 2002].
-
4
A separate second‐order multiplicative bias field for intensity inhomogeneity correction [Likar et al., 2001] was computed from, and applied to, the SPGR image. As the head mask for this bias field correction we used a temporary brain mask propagated from the FSE image via registration of the uncorrected early‐echo FSE to uncorrected SPGR image.
-
5
The bias‐corrected early‐echo FSE image was registered to the bias‐corrected SPGR image.
-
6
The FSE brain mask was transferred once more to the SPGR image by label propagation, this time using the bias‐corrected registration transformation, to obtain the final SPGR brain mask. This mask was applied to the bias‐corrected SPGR image to obtain the skull‐stripped SPGR image.
Within‐Subject Registration
Using the skull‐stripped images and intensity bias‐corrected images as described above, the different MRI channels acquired for each subject were brought into alignment as follows:
-
1
Stripped and bias‐corrected late‐echo FSE images were registered to the stripped and bias‐corrected SPGR images.
-
2
To align DTI and anatomical images and to correct for residual geometrical distortion, each b = 0 echo‐planar image (EPI) was registered nonrigidly (Rueckert et al. [ 1999]; see also Studholme et al. [ 2000]) to the corresponding bias‐corrected (but unstripped) late‐echo FSE image.
Template‐Free Unbiased Intersubject Image Registration
The anatomical coordinate space of the SRI24 atlas was constructed via a groupwise registration procedure. No one subject was selected as the template for the registration, which is why we refer to the entire procedure as “unbiased” in the sense that putting the input subjects in any particular order did not bias the result of the registration.
All 24 brain‐stripped and bias‐corrected SPGR images were first simultaneously registered with linear transformations using a template‐free registration algorithm. The reference coordinate space was not related to any of the subject image spaces but was represented instead by an empty grid of pixel locations that had the same size and resolution as the acquired SPGR images.
Coordinates in reference space were mapped onto each subject's SPGR image by a separate affine coordinate transformation with the following nine degrees of freedom: three translations, δx, δy, δz, three rotation angles, α, β, γ, and three log‐scale factors, lx = log cx, ly = log cy, lz = log cz. The use of log‐scale factors ensured that the identity transformation was described by the zero parameter vector and permitted enforcement of zero sums for each of the transformation parameters over all subjects.
The image similarity measure for the template‐free affine registration was a multi‐image generalization of mutual information [MI; Zhang and Rangarajan, 2005]. To avoid the common issues with sparse histograms, our algorithm takes advantage of the fact that under certain assumptions, the marginal and joint entropies of the registered image channels are proportional to the determinants of appropriately computed covariance matrices [Russakoff et al., 2004].
Completion of the affine registration stage was followed by an unbiased nonrigid registration algorithm, which is similar to the one described by Balci et al. [ 2007] and uses the stack entropy registration criterion introduced in the “congealing” algorithm by Learned‐Miller [ 2006]. In short, stack entropy is implemented by reformatting all images into template space and computing the entropy of intensity distributions over all images at each template pixel. The entropies are then added over all template pixels to obtain the final groupwise registration criterion.
The nonrigid transformation model of the algorithm is based on the B‐spline free‐form deformation by Rueckert et al. [ 1999], but implemented to encode the initial affine transformations in the initial control point positions as detailed in Rohlfing et al. [ 2003]. To this transformation model, we apply a zero‐mean deformation strategy [Studholme and Cardenas, 2004]. Unlike Studholme and Cardenas [ 2004], however, who achieved approximate zero‐mean deformation fields using a constraint term in the optimization function, our algorithm enforces exact zero‐mean deformations during the optimization using gradient projection in a multiresolution gradient descent algorithm [Rohlfing and Maurer, 2003].
The theoretical rationale behind the zero‐mean constraint is to construct an atlas coordinate space that requires the least amount of deformation, on average, when mapping to the individual subjects, thus creating a minimum deformation template [Kochunov et al., 2001]. On a more practical level, the zero‐mean constraint is also useful as it prevents the optimization algorithm from shrinking all input images into a single pixel, which would be the global optimum of the similarity measure but unusable as a registration result.
Numerous algorithms for template‐free population registration and atlas construction have been proposed. Guimond et al. [ 2000] were among the first to propose the concept of an average‐intensity image in an average coordinate space, but their method was not template free and thus not unbiased. Lorenzen et al. [ 2004], Joshi et al. [ 2004], and Twining et al. [ 2005] all used groupwise registrations based on diffeomorphic flows, which ensure one‐to‐one correspondences between all individual images and the resulting atlas. Bhatia et al. [ 2007; 2004] used algorithms based, like ours, on the B‐spline deformation model, but with different groupwise registration metrics. As far as we know, however, none of these algorithms have ever been used to create an atlas that was made publicly available.
In general, any effective groupwise registration method technique could have been used to construct the SRI24 atlas, including iterative methods used by us in earlier work [Brandt et al., 2005; Kurylas et al., 2008; Rohlfing et al., 2001]. We decided to use the algorithm described in “Template‐Free Unbiased Intersubject Image Registration”, because it is template free (thus unbiased) and noniterative (other than employing an iterative optimization for registration), and we have found it to be both robust and accurate (based on visual inspection of the registration results). We also found it sufficient to use only the SPGR channel from each subject for anatomical coregistration, rather than use several of the available image channels from each subjects (Lorenzen et al. [ 2006]; Hecke et al. [ 2008]).
Two different image similarity measures were used for the affine and nonrigid registration because we empirically found MI to be more robust, while stack entropy appeared to be more accurate. In more detail, we observed registration failure for some images in the affine registration using stack entropy but not MI. Also, we observed a sharper average image after nonrigid registration using stack entropy than using MI. Thus, MI was used for the affine stage and stack entropy was used for the nonrigid stage.
The effectiveness of nonrigid registration is illustrated by the comparison of slices from all subjects before and after nonrigid registration in Figure 2. Consequently, the average of the 24 individual SPGR images is substantially sharpened after nonrigid compared with affine registration in (Figure 3).
Figure 2.
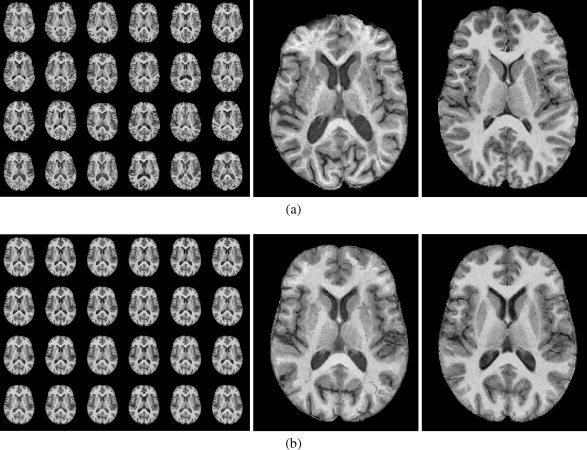
Axial slices from all subjects (a) after groupwise affine registration, and (b) after groupwise nonrigid registration. Enlargements of the respective slices from the oldest (left) and youngest subject (right) in the population are also shown. The images in each panel are sorted by increasing subject age, in rows from top left to bottom right.
Figure 3.
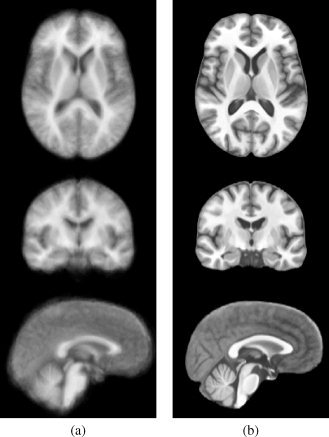
Average SPGR image after (a) groupwise affine and (b) groupwise nonrigid registration. The nonrigid registration clearly improves the level of anatomical detail visible in the atlas.
Atlas Generation
Using concatenations of the appropriate transformations (illustrated in Fig. 4), within each subject and then from each subject into group average space, all channels of information were reformatted directly into the final atlas space. Each image was, therefore, interpolated only once to avoid accumulation of interpolation artifacts. Axial slices through all atlas channels are shown in Figure 5.
Figure 4.
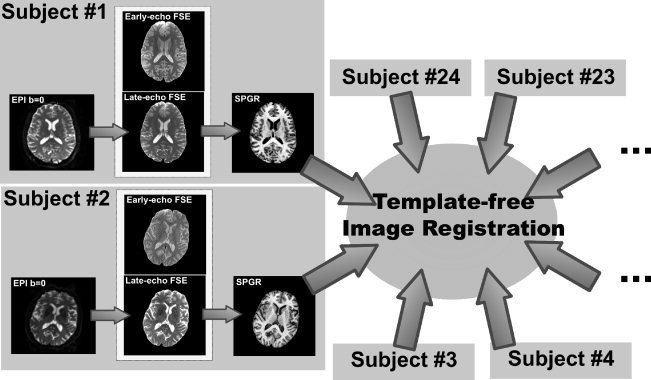
Illustration of the registration links between the images that the SRI24 atlas is constructed from. For each subject, the b = 0 EPI is registered to the late‐echo FSE image, which in turn is registered to the SPGR image. The early‐ and late‐echo FSE images from each subject were acquired in a single, dual‐echo acquisition and are, therefore, in perfect registration. The SPGR images from all 24 subjects are coregistered using a simultaneous, template‐free registration algorithm.
Figure 5.
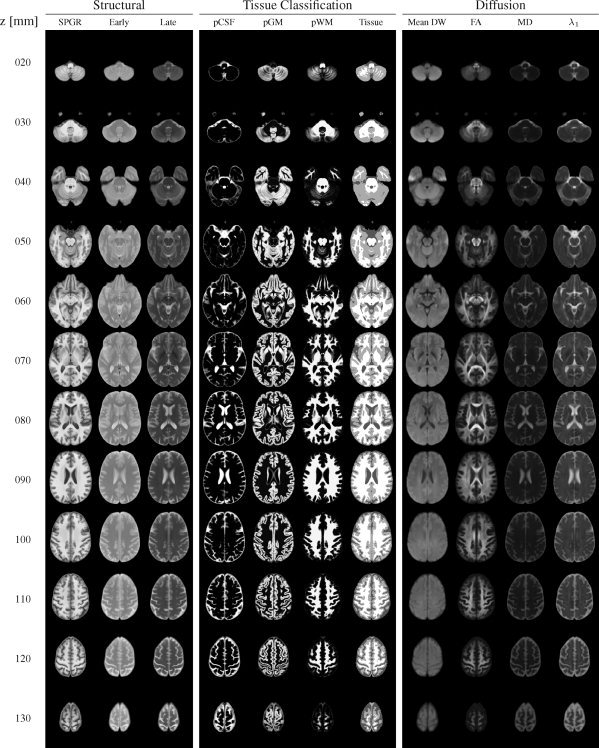
Axial slices through the channels of the SRI24 atlas in 10 mm increments, from z = 20 mm (inferior) to z = 130 mm (superior). The structural image channels are grouped on the left, the tissue segmentation channels are grouped in the center, and the diffusion‐related channels are grouped on the right. Columns from left to right: SPGR, early‐echo FSE, late‐echo FSE, CSF probability map, GM probability map, WM probability map, tissue label map, mean DWI, FA map, MD map, λ1 map.
Structural channels
All coregistered macro‐structural image channels (SPGR, early‐ and late‐echo FSE) were reformatted into the atlas space using a cubic interpolation kernel. The image intensities of the reformatted images were normalized to equal means and standard deviations, and the reformatted and normalized images were then averaged.
Tissue probability maps and label map
Tissue probability maps for cerebrospinal fluid (CSF), gray matter (GM), and white matter (WM) were independently obtained for each subject using FSL's “FAST” tool [Zhang et al., 2001] on the stripped and bias‐corrected SPGR images in each subject's individual coordinate space. The segmentation probability maps were then reformatted into atlas space and numerically averaged. From the averaged probability maps, an indexed tissue label map (CSF = 1, GM = 2, WM = 3) was also generated by determining at each pixel the tissue with the highest probability value.
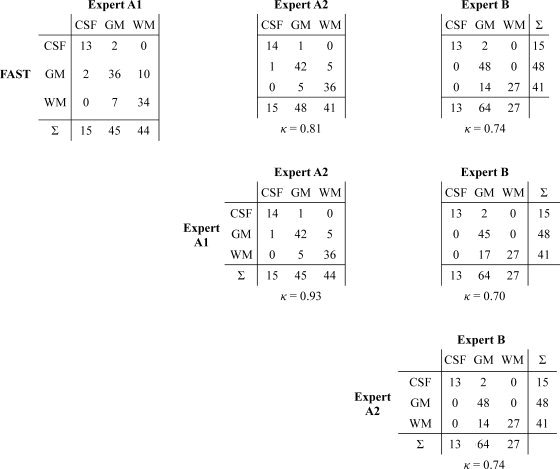
To verify the accuracy of FAST tissue segmentations of the input images, we performed a stereology‐type validation study [Grabowski et al., 2000]. For both the youngest and the oldest subject in the study, 52 points inside the brain were randomly selected. Two of the authors (TR: “Expert A”, and NMZ: “Expert B”) then independently classified the tissue type at each of these locations in the SPGR image as either CSF, GM, or WM. One author (TR) repeated the classification one day later. The manual classifications were then compared with each other and with those provided by FAST. The resulting pairwise co‐occurrence tables are provided in Table I.
Table I.
Comparison of tissue classification using FAST and manual expert classification for 52 samples in the youngest and 52 in the oldest subject
|
Co‐occurrence tables show the summary comparisons of FAST vs. each of the three manual segmentations (top row), first vs. second classification by Expert A, and first classification by Expert A vs. classification by Expert B. From each table, Cohen's κ coefficient of inter‐rater agreement was computed (see text for details).
From these tables, we computed Cohen's κ coefficient, a statistical measure of inter‐rater agreement for categorical data [Cohen, 1960] defined as
| (1) |
where P actual is the observed probability of two raters agreeing with one another, and P random is the probability of agreement purely by chance.
Although not universally accepted, Landis and Koch [ 1977] rate κ values above 0.61 as “substantial agreement” and above 0.81 as “almost perfect agreement.” Regardless of whether one agrees with this rating system, we note that the agreement of FAST with the three expert segmentations (between 0.67 and 0.81) is very close to the inter‐rater agreement between each of the two classifications by Expert A and the single classification by Expert B of κ = 0.70 and κ = 0.74, respectively. This suggests, in our opinion, at the very least an acceptable level of segmentation performance by FAST.
Diffusion channels
Diffusion tensor fields were reconstructed in native image coordinates of each of the original 24 subjects. The DTI‐derived image channels of scalar diffusion measures (FA, MD, and longitudinal diffusivity, λ1) were generated from the tensor fields in subject space and were then reformatted into the atlas space using a cubic interpolation kernel. The reformatted images from all subjects were averaged, and the value ranges were truncated to [0, 1] for FA and [0, ∞) for MD and λ1 so as to eliminate illegal values introduced by the cubic interpolation.
Cortical parcellation maps
Two cortical parcellation label maps were constructed for the SRI24 atlas. The first, which we refer to as the SRI24/TZO map, is based on the map described by Tzourio‐Mazoyer et al. [ 2002]. This map is defined in the coordinates of the Colin27 brain image [Holmes et al., 1998], a high‐quality single‐subject SPGR image resulting from coregistration and averaging of 27 scans of the same person.
As coregistration of SRI24 and Colin27 was not sufficiently robust for direct transfer of the label map, we used an approach suggested by Heckemann et al. [ 2006] as “indirect fusion.” In short, the Colin27 atlas had previously been registered to each of 300 archival 1.5T SPGR images from studies performed by our group [Pfefferbaum et al., 2006b, 2007]. Each of these 300 images was then also registered to the SRI24 atlas. By reformatting the cortical label map from Colin27 through each of the 300 indirect two‐transformation sequences onto SRI24, we obtained 300 different cortical maps for the SRI24 atlas. These were then combined by label fusion [Rohlfing et al., 2001].
To the thus transferred cortical parcellation map, one of the authors (AP) manually added segmentations of the corpus callosum, the lateral ventricles, [Pfefferbaum et al., 2006a] and the pons. To enable studies of spatial distributions of effects, the corpus callosum was coded with an anterior–posterior subdivision according to Pandya and Seltzer [ 1986], the ventricle mask was coded with a posterior–anterior gradient of increasing label indices (constant label in each coronal slice), and the pons mask with a left–right gradient (constant label in each sagittal slice). The final label map, which we refer to as SRI24/TZO parcellation, is shown in axial slices in Figure 6 and rendered in 3D in Figure 7 after projection onto a cortical surface model of the SRI24 brain that was extracted from the gray matter tissue probability map.
Figure 6.
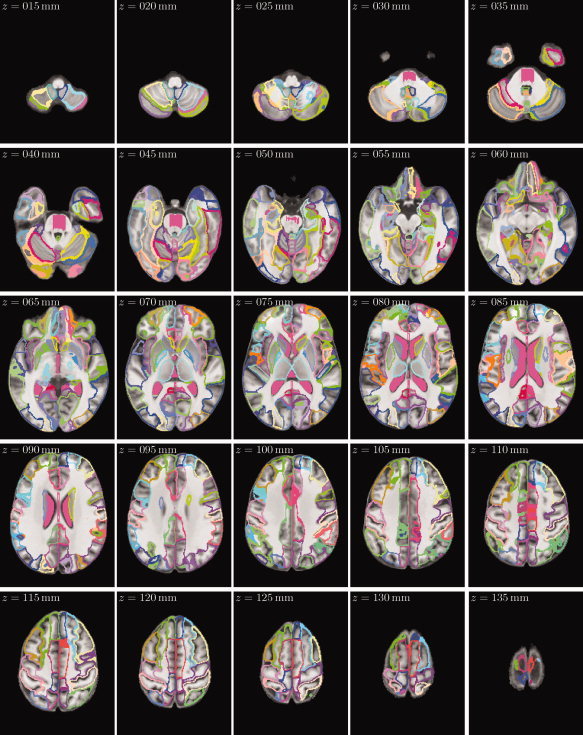
Axial slices of the SRI24/TZO cortical parcellation map, overlaid onto the SPGR structural atlas channel, in 5‐mm increments from z = 15 mm (inferior) to z = 135 mm (superior).
Figure 7.
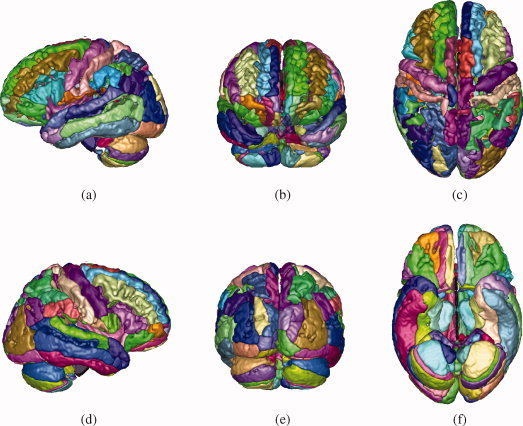
Three‐dimensional renderings of the SRI24/TZO parcellation map, projected onto a cortical surface model. (a) View from left. (b) View from anterior. (c) View from superior. (d) View from right. (e) View from posterior. (f) View from inferior.
The second cortical parcellation for the SRI24 atlas was generated from the manual segmentations used by Shattuck et al. [ 2008] to construct the LPBA40 atlas. We obtained the original MR images and manual segmentations from the LPBA40 website and registered each of the 40 individual SPGR images to the SRI24 atlas via nonrigid registration [Rohlfing and Maurer, 2003; Rueckert et al., 1999]. The individual segmentations were then propagated into SRI24 coordinate space, where they were combined via label fusion [Rohlfing and Maurer, 2005]. The final label map, which we refer to as SRI24/LPBA40 parcellation, is thus essentially a 40‐atlas segmentation of the SRI24 brain and is shown in axial slices in Figure 8 and rendered in 3D in Figure 9 after projection onto the aforementioned cortical surface model.
Figure 8.
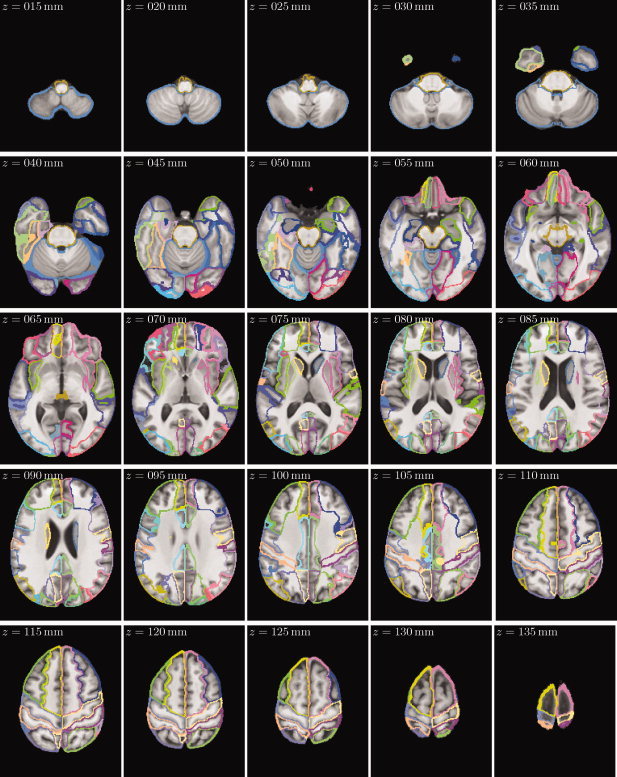
Axial slices of the SRI24/LPBA40 cortical parcellation map, overlaid onto the SPGR structural atlas channel, in 5‐mm increments from z = 15 mm (inferior) to z = 135 mm (superior).
Figure 9.
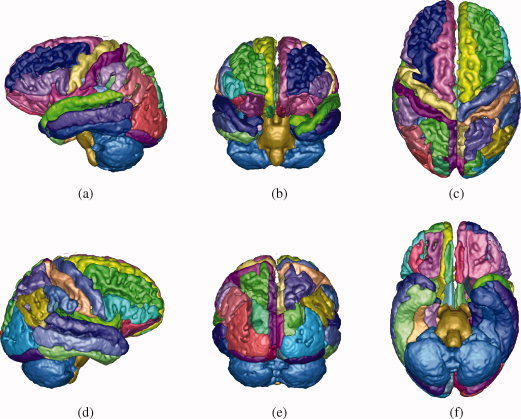
Three‐dimensional renderings of the SRI24/LPBA40 parcellation map, projected onto a cortical surface model. (a) View from left. (b) View from anterior. (c) View from superior. (d) View from right. (e) View from posterior. (f) View from inferior.
Brain masks
The brain masks previously generated in subject space (see “Image Preprocessing” section) were reformatted into atlas space and averaged using a shape‐based averaging algorithm [Rohlfing and Maurer, 2007]. The averaged brain mask was then used to remove all data outside the brain in all aforementioned average images (structural, tissue, DTI, and parcellation), which ultimately resulted from imperfect alignment (within one or two pixels) of the 24 subject SPGR images.
ATLAS APPLICATIONS
To assess quantitatively the suitability of the SRI24 atlas for label propagation and spatial normalization, we compared it with several other established atlases, shown in Figure 10: the MNI152 atlas [Mazziotta et al., 2001a], the ICBM‐452T1 (air12 and warp5) atlases1, the LONI Probabilistic Brain Atlas, LPBA40 [Shattuck et al., 2008] (SPM5, FLIRT, and AIR), and the Colin27 brain [Holmes et al., 1998].
Figure 10.
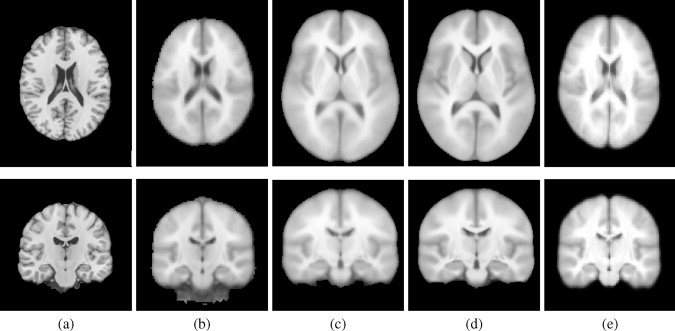
Examples of other publicly available MRI‐based brain atlases. Only T1‐weighted images are available for all atlases in this figure. (a) Colin27 brain atlas generated by averaging 27 independently acquired SPGR images of the same subject. (b) MNI152 atlas (at 2‐mm resolution, as distributed with FSL). (c) ICBM452/air12 atlas. (d) ICBM452/warp5 atlas. (e) LPBA40/SPM5 atlas. Note the still substantial fuzziness of all atlases other than Colin27, especially when compared with the SRI24.
Spatial Normalization
Comparison with other atlases
Spatial normalization of all subjects in a study to the same coordinate space is a common step in many group comparison studies [e.g., Ashburner and Friston, 2000; Cardenas et al., 2002; Good et al., 2001]. Each of the atlases was used as the target for spatially normalizing skull‐stripped SPGR images of the 40 individual subjects used in the creation of the LPBA40 atlases. We previously used images from the IBSR database2 for this evaluation [Rohlfing et al., 2008] but had to rely on automatic skull stripping, which did not work equally well on all images in the database. The LPBA40 subject images are provided with manual skull strippings, and 40 images give a larger test set than the 14 successfully skull‐stripped images we previously used from the IBSR database.
The segmentations provided from 57 anatomical structures for each of the LPBA40 individual subject images were then propagated onto each of the atlases. Because there are no corresponding label maps for the atlases other than the LPBA40 variants, and because, unlike label propagation, spatial normalization brings all subject images into a single coordinate system, we used groupwise overlap scores as the evaluation metric rather than the agreement between atlas and coregistered subject label maps.
The groupwise scores were computed as follows. For a given atlas, let Li,l,n = 1 if l is the label at the n‐th pixel in the i‐th reformatted label map, and Li,l,n = 0 otherwise. Then the groupwise overlap can be computed as a special case of an overlap formula derived by Crum et al. [ 2005] as
 |
(2) |
where K is the number of atlases (here: K = 40).
Higher overlap scores indicate better consistency between the anatomies mapped onto the atlas, suggesting that an atlas with higher overlap scores is better suited for spatial normalization than one with lower scores. We report herein two different types of overlap, determined by the choice of weights αl,i,j. The first is volume‐weighted overlap, for αl,i,j = 1 for all l, i, j, in which larger structures have a proportionally larger influence. The second is equally‐weighted overlap, for
 for all l, i, j, in which all structures have the same influence, regardless of their volumes.
The scores for all structures mapped onto each atlas are shown in Table II, both for nonrigid (B‐spline registration) and affine (9 degrees of freedom) normalization. For nonrigid normalization, the SRI24 atlas outperformed all other atlases in terms of the volume‐weighted overlap, and all but the LPBA40/SPM5 and ICBM452/warp5 atlases in terms of equally‐weighted overlap. For affine normalization, the SRI24 atlas performed best out of all atlases by volume‐weighted overlap and fourth‐best by equally weighted overlap. Note that there is a potential bias in this analysis in favor of the LPBA40 atlases, because they were created from the test images, which could potentially make coregistration easier (e.g., due to more similar image contrast) and thus more accurate.
Table II.
Groupwise overlap scores for the 40 LPBA40 individual subject images, spatially normalized to each of eight atlases (sorted, from left to right, by increasing number of subjects used to create the atlas)
| Atlas | SRI24 | Colin27 | LPBA40 | MNI152 | ICBM452 | |||
|---|---|---|---|---|---|---|---|---|
| SPM5 | FLIRT | AIR | warp5 | air12 | ||||
| Nonrigid Normalization | ||||||||
| Volume Weighted | 0.907 | 0.843 | 0.852 | 0.847 | 0.793 | 0.844 | 0.800 | 0.800 |
| Equally Weighted | 0.491 | 0.435 | 0.501 | 0.487 | 0.485 | 0.474 | 0.493 | 0.482 |
| Affine Normalization | ||||||||
| Volume Weighted | 0.872 | 0.821 | 0.808 | 0.807 | 0.739 | 0.809 | 0.743 | 0.747 |
| Equally Weighted | 0.412 | 0.414 | 0.413 | 0.411 | 0.420 | 0.412 | 0.420 | 0.419 |
Best overlap score in each row is printed in bold face. The two top rows show the results for nonrigid normalization, the two bottom rows show the results for affine normalization.
The individual overlaps for the separate structures after nonrigid normalization were computed by restricting the nested sum in Eq. (2) to a single label l. We then used these per‐label overlaps scores for statistical testing. A within‐factor analysis of variance comparing all eight atlases yielded a significant effect (F(7,455) = 51.470, P = 0.0001). Follow‐up paired comparisons indicated that the SRI24 results were significantly different from (and better than) six of the other seven atlases (all but LPBA40/SPM5) on Fisher PLSD tests. The SRI24 results furthermore differed significantly from four of the seven other atlases by paired t‐tests (Table III). For comparison, Table III also shows the affine normalization results, where SRI24 performed significantly better than Colin27, LPBA40/SPM5, LPBA40/FLIRT, and MNI152. Differences with the remaining atlases were not significant.
Table III.
Per‐label overlap scores and P values computed by two‐sided, paired t‐tests
| Atlas | SRI24 | Colin27 | LPBA40 | MNI152 | ICBM452 | |||
|---|---|---|---|---|---|---|---|---|
| SPM5 | FLIRT | AIR | warp5 | air12 | ||||
| Nonrigid Normalization | ||||||||
| Mean | 0.497 | 0.443 | 0.504 | 0.489 | 0.487 | 0.476 | 0.496 | 0.484 |
| Std.dev. | 0.112 | 0.114 | 0.099 | 0.097 | 0.095 | 0.099 | 0.097 | 0.095 |
| T‐test P vs. SRI24 | <0.0001 | 0.072 | 0.071 | 0.039 | <0.0001 | 0.753 | 0.012 | |
| Affine Normalization | ||||||||
| Mean | 0.423 | 0.419 | 0.418 | 0.416 | 0.425 | 0.417 | 0.425 | 0.424 |
| Std.dev. | 0.106 | 0.104 | 0.106 | 0.106 | 0.100 | 0.105 | 0.101 | 0.101 |
| T‐test P vs. SRI24 | <0.0001 | <0.0001 | <0.0001 | 0.307 | <0.0001 | 0.192 | 0.684 | |
Best result (highest mean) in each row is marked in bold face.
Application example: Aging effects on FA
For a demonstration of the utility of the atlas for spatial normalization, data acquired at 3T from 10 young and 10 elderly subjects not used in the atlas construction (from Sullivan et al. [ 2006]) were registered to the atlas and group averages of FA constructed (see Fig. 11). The resulting group‐average FA maps demonstrate the well‐known effect of decreased FA with increasing age (e.g., Pfefferbaum and Sullivan [ 2003]; Madden et al. [ 2004]; Salat et al. [ 2005]; Sullivan et al. [ 2006]). Analyses similar to this are frequently done in voxel‐based morphometry (VBM) studies for comparisons between different groups of subjects. Of particular interest here is how consistently the FA maps from all subjects in either group were coregistered with the SRI24 atlas, although registration was based on the SPGR image channels of subjects and atlas. Although we cannot provide a quantitative measure of the unavoidable registration errors, this illustrates that even the accumulated errors of within‐subject (DTI to SPGR) and subject‐to‐atlas registration do not pose problems in this application.
Figure 11.
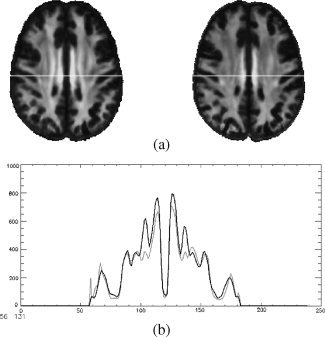
Illustration of the SRI24 atlas for spatial normalization. (a) Average FA maps for 10 young (left) and 10 elderly (right) subjects after registration and reformatting into the atlas space. (b) Line profile reveals lower FA in the elderly subjects (gray line) than the young subjects (black line). White line in (a) marks the level at which FA is quantified.
Label Propagation
Label propagation, or atlas‐based segmentation, is a commonly used technique to segment images by registering them to an already segmented atlas image and then propagating the labels from the atlas to the new image according to the spatial transformation between them [Miller et al., 1993]. We have previously shown [Rohlfing and Maurer, 2005; Rohlfing et al., 2004a, b] that segmentation results can be greatly improved by using multiple independent atlases. However, this is not always a practical approach as it requires time‐consuming manual labeling of all structures of interest in more than a single atlas image. As demonstrated [Rohlfing et al., 2004a], an “average shape atlas,” like the SRI24, does not perform as well as multiple independent atlases, but it still typically outperforms an atlas based on a single individual. According to work by Wang et al. [ 2005], label propagation from a carefully constructed average shape atlas can perform close to independent propagation from multiple individual atlases but requires substantially less effort to construct.
Comparison with other atlases
For a quantitative comparison of label propagation accuracy using different atlases, labelings of the same anatomical structures are needed for each of the atlases and for a population of test subjects. As for spatial normalization, we use the subjects included in the LPBA40 atlases [Shattuck et al., 2008] as test subjects, because they represent one of the largest available populations of manually segmented MR images. A corresponding segmentation of the SRI24 atlas (the aforementioned SRI24/LPBA40 label map) was generated by label fusion of the spatially normalized individual images used for evaluation in the previous section. Using the same procedure, we also generated corresponding segmentations for the remaining comparison atlases including the three variants of the LPBA40 atlas.
Although this procedure of atlas labeling degrades the atlas label map due to registration errors, the ultimate label map is the result of a 40‐atlas classifier fusion and is thus likely quite well‐matched with the anatomy. This is especially the case because label voting is substantially more robust to outliers than the numerical overlap values reported in the previous section. Furthermore, this method is the only way to generate label maps for the MNI152 and ICBM452 atlases, for which we have no access to the original individual images.
To test label propagation using the LPBA40 atlases, we did not use segmentations provided with these, but instead used the same normalization and label fusion procedure as was applied to the remaining atlases. This was done to treat all atlases equally and reduce (albeit of course not eliminate) potential bias in the analysis. We note that the provided LPBA40 label maps are also affected by registration errors, namely those that occurred during the construction of these atlases, although one could argue that these errors might have different effects due to the different registration problems, individual to individual rather than individual to atlas.
For the actual evaluation of label propagation, each of the eight atlases was independently registered, using nonrigid registration, to each of the individual LPBA40 subjects. The direction of the coordinate mapping was reversed from the ones used for spatial normalization, so that the nonrigid alignments were indeed independently computed. The labels were then propagated from each of the atlases to the coordinate space of each individual subject, where their overlap with the original manual segmentations was computed. The resulting overlaps in terms of fraction of correctly classified pixels are listed in Table IV.
Table IV.
Comparison of label propagation from eight atlases vs. manual ground truth segmentations of the LPBA40 individual subject images
| Atlas | SRI24 | Colin27 | LPBA40 | MNI152 | ICBM452 | |||
|---|---|---|---|---|---|---|---|---|
| SPM5 | FLIRT | AIR | warp5 | air12 | ||||
| Mean | 0.9669 | 0.9530 | 0.9680 | 0.9637 | 0.9706 | 0.9654 | 0.9701 | 0.9694 |
| Std.dev. | 0.0032 | 0.0048 | 0.0034 | 0.0039 | 0.0029 | 0.0035 | 0.0030 | 0.0031 |
| T‐test P vs. SRI24 | <0.0001 | <0.0001 | <0.0001 | <0.0001 | <0.0001 | <0.0001 | <0.0001 | |
Best result is marked in bold face.
By this evaluation, the SRI24 atlas performed significantly better (based on two‐sided, paired t‐tests) than the Colin27, LPBA40/FLIRT, and MNI152 atlases. SRI24 performed worse than the LPBA40/SPM5, LPBA40/AIR, ICBM452/warp5, and ICBM452/air12 atlases.
Application example: ROI definition for DTI fiber tracking
The usefulness of our atlas for region definition, and thus atlas‐based labeling, has been demonstrated in Zahr et al. [ 2009] and is illustrated here in Figure 12. A parcellation of the corpus callosum in the atlas was propagated onto a coregistered subject image and provided target regions for DTI fiber tracking.
Figure 12.
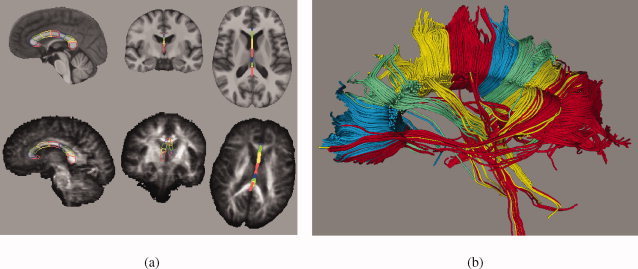
Example of region definition for fiber tracking using the SRI24 atlas and label propagation. (a) Parcellation of the corpus callosum into nine segments defined in the SRI24 atlas (top row) and propagated onto a subject's FA map (bottom row). (b) 3D rendering of fiber tracts determined in subject's diffusion tensor image and colored according to the parcellation of the corpus callosum.
DISTRIBUTION
The SRI24 atlas is made available at http://www.nitrc.org/projects/sri24/under a Creative Commons license. The atlas is provided at 1‐mm isotropic resolution with image size 240 × 240 × 155 pixels. The atlas channels are stored in different pixel data representations, depending on the type of data:
-
1
Structural images (SPGR, early‐ and late‐echo FSE) and the mean DWI are stored as signed 16bit integer data.
-
2
FA is stored are 16bit signed integer data, with a scale factor of 1,000 applied to the original FA values.
-
3
MD and λ1 maps are stored as single‐precision (32bit) floating point data.
-
4
Tissue probability maps are single‐precision (32bit) floating point images with all pixel values in the range [0, 1].
-
5
The tissue class label map is stored as unsigned 8bit data and the following label assignments: 0 = background, 1 = CSF, 2 = GM, 3 = WM.
-
6The extended SRI24/TZO cortical parcellation map, based on the Tzourio‐Mazoyer et al. [ 2002] parcellation is stored as signed 16bit integer data. The following continuous blocks of labels are assigned:
-
aThe cortical regions were encoded in the range from 1 through 116 (image background: 0), following their order in the original template by Tzourio‐Mazoyer et al. [ 2002].
-
bThe anterior–posterior lateral ventricle subdivision is represented by the labels 201 (posterior) through 415 (anterior), with odd labels used for the right hemisphere and even labels for the left hemisphere.
-
cThe anterior–posterior corpus callosum subdivision is represented by the labels 581 (genu) through 589 (splenium).
-
dThe left–right subdivided pons mask is represented with labels 591 (right hemisphere) through 607 (left hemisphere).
-
a
-
7
The SRI24/LPBA40 parcellation map [Shattuck et al., 2008] is stored as single‐byte unsigned data with region labels identical to the ones provided by LONI.3
Three image file formats are available, Near Raw Raster Data (NRRD),4 NIFTI,5 and Analyze 7.5.6 The NRRD images are stored in axial orientation with a self‐contained definition of the image coordinate systems.7 The NIFTI images are stored in axial orientation with appropriately set orientation information. The Analyze hdr/img pairs are stored in axial R‐L/P‐A/I‐S pixel order, that is, the fastest varying pixel index corresponds to the anatomical right–left direction, the second‐fastest index corresponds to the posterior–anterior direction, and the third‐fastest corresponds to the inferior–superior direction.
In addition to the SRI24 atlas itself, all custom tools used for its construction (e.g., pairwise and groupwise image registration, bias field correction) are available as part of the Computational Morphometry Toolkit (http://www.nitrc.org/projects/cmtk/).
DISCUSSION
The SRI24 brain atlas is distinguished from other atlases as it satisfies all of the following criteria:
-
1
It is derived from a sample of subjects across the adult age range (19–84 years), albeit not uniformly sampled. This makes the SRI24 atlas useful as a spatial normalization template by reducing the average deformation required to map subjects onto it. By comparison, the Colin27 brain (Fig. 10a) is based on a single subject and is thus less likely to represent a “typical” anatomy. The MNI152, ICBM452, and LPBA atlases are based on samples of younger adults (less than 40‐years‐old) and may thus be less suitable as templates for studies of the elderly.
-
2
Nonlinear intersubject registration was used for atlas construction, unlike the MNI250 [Evans et al., 1992], MNI305 [Evans and Collins, 1993], MNI152 [Mazziotta et al., 2001a], ICBM‐452T1/air12, and two of the three LPBA40 atlases [Shattuck et al., 2008]. Nonrigid alignment provides substantially improved sharpness (compare Fig. 5 with Fig. 10b–e). This makes our atlas useful for definition of regions that can be transferred onto other images by label propagation. Two maps of such regions for cortical parcellation are provided with the SRI24 atlas.
-
3
We used unbiased nonrigid population registration, unlike any other published atlas, to capture normal anatomy and take advantage of population information during the registration stage, rather than perform pairwise registrations and combine them into a population alignment. We thus avoid the potentially difficult registration problem between two outlier subjects with very dissimilar anatomies.
-
4
The SRI24 atlas is multispectral and uniquely includes several acquired macrostructural channels, MRI‐derived tissue classifications, and DTI‐derived FA, MD, and λ1 parameter maps. Coregistration of the SRI24 atlas and subject images can thus be achieved using multichannel registration algorithms. By comparison, the Colin27, ICBM452, and LPBA40 atlases contain only a single MR channel (T1‐weighted), and the MNI152 atlas contains T1‐weighed, T2‐weighted, and proton density channels.
The usefulness of the SRI24 atlas has been demonstrated in this article for both spatial normalization and label propagation using quantitative comparisons with four commonly used MR brain atlases: MNI152, ICBM452 (air5 and warp5), LPBA40 (AIR, FLIRT, SPM5), and Colin27. For both evaluations, the SRI24 atlases performed well relative to the other atlases. Although our results are neither conclusive nor general enough to say that any one atlas is always better than another, we note that SRI24 performed at or near the top of the comparison group for spatial normalization and well in the middle for label propagation. Excellent registration performance was achieved despite the different field strengths: all other atlases as well as all test data were based on MR data acquired at 1.5T field strength, whereas the SRI24 atlas alone was based on data acquired at 3T.
Our label propagation comparison is obviously biased in several ways. First, we used essentially the same registration algorithm for atlas‐to‐subject registration as was used for creating the label maps in atlas spaces. However, each task involved coordinate transformations in opposite directions (mapping subject to atlas space vs. mapping atlas to subject space). As the registration algorithm we used is strictly pairwise, nonsymmetric, independently computed coordinates transformations were used in atlas map generation and label propagation. The second source of bias comes from the fact that the LPBA40 atlases were created from the same images used for evaluation. However, this bias should work in favor of the LPBA40 atlases, and not the SRI24 atlas.
There is also an implicit bias because atlas construction for the comparison depends on spatial normalization, which, as we have also demonstrated herein, is different for each atlas. Unfortunately, there is no other way to create label maps for fuzzy population atlases for which the original individual image data are not available, because their level of anatomical detail is not sufficient to identify anatomical features with certainty (see Figs. 10 and 13).
Figure 13.

Volume renderings of four atlases illustrate the level of sharpness with which the cortical surface is defined in each. (a) SRI24. (b) Colin27. (c) ICBM452/air12. (d) ICBM452/warp5.
That is not to say that label propagation is impossible with fuzzy atlases, for example, using probabilistic label maps [Mazziotta et al., 2001a; Shattuck et al., 2008]. Segmentation using these maps combined with tissue classification in subject space has been demonstrated, for example, by Collins et al. [ 1999], but their results also illustrate a major problem with the approach: shifted region boundaries in the segmentation due to lack of anatomical detail in the fuzzy atlas. This problem cannot be mitigated by improved registration algorithms.
Another practical drawback with probabilistic atlases is the need to label a large number of brains rather than a single one. Even if the necessary resources were available, for actual application to label propagation, it would be more advisable to use the individual segmented images for a multi‐atlas segmentation, rather than combine them first into a single atlas. This is supported by increasing body of studies [e.g., Chou et al., 2008; Gousias et al., 2008; Heckemann et al., 2006; Klein and Hirsch, 2005; Klein et al., 2008; Rohlfing and Maurer, 2005; Rohlfing et al., 2004a, b; Svarer et al., 2005]. It also comports with recent theoretical and experimental evidence [Blezek and Miller 2007], showing that a single atlas is not always sufficient to represent a population of subjects. Nonetheless, using a single atlas is still the most computationally efficient procedure and ensures at least consistency of atlases over all subjects.
No atlas is perfect, and the SRI24 atlas is no exception. One possible limitation is that the 24 subjects used to create this atlas were in two separate age groups (young and older), so that the intermediate age range is not represented. This leads to the larger issue of whether studies on separate subject groups should use different atlases altogether. This concept relates to so‐called custom templates used in optimized VBM studies [Good et al., 2001], whereby the atlas used for a study is created from the control subjects of the study itself. The obvious problem with this approach is that each study is performed in its own anatomical coordinate system, which makes it very difficult to reuse regions defined in one atlas, or to compare results between different studies. Furthermore, quality control would have to be repeated for every custom template thus generated.
Another possible criticism of the SRI24 atlas is that the two parcellation label maps, SRI24/TZO and SRI24/LPBA40, were essentially generated automatically via image registrations. The SRI24/TZO map was manually corrected, but interactive segmentation tools are typically optimized for creation of label maps rather than editing. We can, therefore, be certain that the two label maps are not perfect; however, manual segmentation, considered the “gold standard,” is also imperfect, even when done by multiple independent experts. Typical issues are inconsistencies between adjacent slices (because segmentation is usually performed with the data presented in only one slice orientation) and inconsistencies between subjects (because every individual image is segmented by itself).
Conversely, one advantage of the SRI24 atlas over probabilistic atlases is that mismatches of labels and anatomy can be detected, and thus corrected, in the atlas itself. Fuzzy atlases, such as the MNI152, ICBM452, and LPBA40 atlases, avoid this issue because the anatomy is not clearly defined in the first place, so asking whether a label map is aligned with the atlas anatomy is somewhat meaningless. That does not at all imply, however, that there is good alignment. Probabilistic label maps only defer the problem, because once propagated to a new subject image they need to be sharpened (subject anatomy is deterministic after all), at which point the uncertainty of the probabilistic map translates into label‐anatomy mismatch.
What could be perceived as a further issue with the SRI24 is that its correspondence relationships with other atlases have not yet been established. We note, however, that the correspondence between a fuzzy population average atlas (e.g., MNI152, ICBM452, LPBA40) and a single‐subject atlas (e.g., Talairach) is always questionable, again because of the lack of clearly defined anatomy in the fuzzy atlases. Every anatomical landmark in Talairach space, for example, corresponds to a point cloud in the space of a fuzzy atlas. In the SRI24 atlas, however, many landmarks correspond to approximately a single point, so that SRI24 can be matched with Talairach space in a meaningful way.
CONCLUSIONS
We have introduced the SRI24 brain atlas, a multichannel representation of normal brain anatomy with label annotations. The usefulness of the SRI24 atlas has been demonstrated in the application of the atlas for spatial normalization in a group comparison study and for region definition in a fiber tracking study. The SRI24 atlas performed well in two quantitative comparisons with seven other publicly available atlases. It is made available to the scientific community at http://www.nitrc.org/projects/sri24/as a resource and reference system for future imaging‐based studies of the human brain.
REFERENCES
- Ashburner J, Friston KJ ( 2000): Voxel‐based morphometry—The methods. Neuroimage 11: 805–821. [DOI] [PubMed] [Google Scholar]
- Bai X, Yu L, Liu Q, Zhang J, Li A, Han D, Luo Q, Gong H ( 2006): A high‐resolution anatomical rat atlas. J Anat 209: 707–708. [DOI] [PMC free article] [PubMed] [Google Scholar]
- Balci SK, Golland P, Shenton M, Wells WM ( 2007): Free‐form B‐spline deformation model for groupwise registration. In: MICCAI 2007 Workshop Statistical Registration: Pair‐wise and Group‐wise Alignment and Atlas Formation. pp 23–30.
- Basser PJ, Pierpaoli C ( 1996): Microstructural and physiological features of tissues elucidated by quantitative‐diffusion‐tensor MRI. J Magn Reson B 111: 209–219. [DOI] [PubMed] [Google Scholar]
- Bhatia K, Hajnal J, Puri B, Edwards A, Rueckert D ( 2004): Consistent groupwise nonrigid registration for atlas construction In: IEEE International Symposium on Biomedical Imaging: Nano to Macro, Piscataway, NJ: IEEE Press, Vol. 1 pp 908–911. [Google Scholar]
- Bhatia KK, Aljabar P, Boardman JP, Srinivasan L, Murgasova M, Counsell SJ, Rutherford MA, Hajnal JV, Edwards AD, Rueckert D ( 2007): Groupwise combined segmentation and registration for atlas construction. In: Ayache N, Ourselin S, Maeder A, editors. Medical Image Computing and Computer‐Assisted Intervention—MICCAI 2007. 10th International Conference, Brisbane, Australia, October 29–November 2, 2007, Proceedings, Part I. Vol. 4791 of Lecture Notes in Computer Science. Berlin/Heidelberg: Springer‐Verlag. pp 532–540. [DOI] [PubMed]
- Blezek DJ, Miller JV ( 2007): Atlas stratification. Med Image Anal 11: 443–457. [DOI] [PMC free article] [PubMed] [Google Scholar]
- Boes JL, Meyer CR ( 1999): Multi‐variate mutual information for registration. In: Chris T, Colchester A, editors. Proceedings of the Second International Conference on Medical Image Computing and Computer‐Assisted Intervention. Vol. 1679 of Lecture Notes in Computer Science. London, UK: Springer‐Verlag. pp 606–612.
- Brandt R, Rohlfing T, Rybak J, Krofczik S, Maye A, Westerhoff M, Hege H‐C, Menzel R ( 2005): Three‐dimensional average‐shape atlas of the honeybee brain and its applications. J Comp Neurol 492: 1–19. [DOI] [PubMed] [Google Scholar]
- Cardenas VA, Studholme C, Weiner WM, Meyerhoff DJ ( 2002): Detecting brain structure changes due to chronic alcohol consumption and HIV infection using tensor morphometry. Alcoholism: Clinical and Experimental Research 26 (5(S)), 26A, 2002 Scientific Meeting of the Research Society on Alcoholism and the 11th Congress of the International Society for Biomedical Research on Alcoholism, June 28–July 3, 2002, San Francisco, CA. [PubMed] [Google Scholar]
- Chou Y‐Y, Lepore N, de Zubicaray GI, Carmichael OT, Becker JT, Toga AW, Thompson PM ( 2008): Automated ventricular mapping with multi‐atlas fluid image alignment reveals genetic effects in Alzheimer's disease. Neuroimage 40: 615–630. [DOI] [PMC free article] [PubMed] [Google Scholar]
- Cohen J ( 1960): A coefficient of agreement for nominal scales. Educ Psychol Meas 20: 37–46. [Google Scholar]
- Collins DL, Zijdenbos AP, Baare WF, Evans AC ( 1999): ANIMAL+INSECT: Improved cortical structure segmentation. In: Information Processing in Medical Imaging, 16th International Conference, IPMI 99 Visegrad, Hungary, June 28–July 2, 1999, Proceedings, Vol. 1613 of Lecture Notes in Computer Science. Berlin/Heidelberg: Springer‐Verlag. pp 210–223.
- Crum WR, Camara O, Rueckert D, Bhatia KK, Jenkinson M, Hill DL ( 2005): Generalised overlap measures for assessment of pairwise and groupwise image registration and segmentation. In: Duncan JS, Gerig G, editors. Medical Image Computing and Computer‐Assisted Intervention—MICCAI 2005: 8th International Conference, Palm Springs, CA, USA, October 26–29, 2005, Proceedings, Part I. Vol. 3749 of Lecture Notes in Computer Science. Berlin/Heidelberg: Springer‐Verlag. pp 99–106. [DOI] [PubMed]
- Evans AC, Collins DL ( 1993): A 305‐member MRI‐based stereotactic atlas for CBF activation studies. In: Proceedings of the 40th Annual Meeting of the Society for Nuclear Medicine.
- Evans AC, Collins DL, Milner B ( 1992): An MRI‐based stereotactic atlas from 250 young normal subjects. Abstr Soc Neurosci 18: 408 (abstract No. 179.4). [Google Scholar]
- Good CD, Johnsrude IS, Ashburner J, Henson RNA, Friston KJ, Frackowiak RSJ ( 2001): A voxel‐based morphometric study of ageing in 465 normal adult human brains. Neuroimage 14: 21–36. [DOI] [PubMed] [Google Scholar]
- Gousias IS, Rueckert D, Heckemann RA, Dyet LE, Boardman JP, Edwards AD, Hammers A ( 2008): Automatic segmentation of brain MRIs of 2‐year‐olds into 83 regions of interest. Neuroimage 40: 672–684. [DOI] [PubMed] [Google Scholar]
- Grabowski TJ, Frank RJ, Szumski NR, Brown CK, Damasio H ( 2000): Validation of partial tissue segmentation of single‐channel magnetic resonance images of the brain. Neuroimage 12: 640–656. [DOI] [PubMed] [Google Scholar]
- Guimond A, Meunier J, Thirion J‐P ( 2000): Average brain models: A convergence study. Comput Vis Image Underst 77: 192–210. [Google Scholar]
- Hammers A, Koepp MJ, Free SL, Brett M, Richardson MP, Labbe C, Cunningham VJ, Brooks DJ, Duncan J ( 2002): Implementation and application of a brain template for multiple volumes of interest. Hum Brain Mapp 15: 165–174. [DOI] [PMC free article] [PubMed] [Google Scholar]
- Hecke WV, Sijbers J, D'Agostino E, Maes F, De Backer S, Vandervliet E, Parizel PM, Leemans A ( 2008): On the construction of an inter‐subject diffusion tensor magnetic resonance atlas of the healthy human brain. Neuroimage 43: 69–80. [DOI] [PubMed] [Google Scholar]
- Heckemann RA, Hajnal JV, Aljabar P, Rueckert D, Hammers A ( 2006): Automatic anatomical brain MRI segmentation combining label propagation and decision fusion. Neuroimage 33: 115–126. [DOI] [PubMed] [Google Scholar]
- Hollingshead A ( 1975): Four Factor Index of Social Status. New Haven (Connecticut): Department of Sociology, Yale University. [Google Scholar]
- Holmes CJ, Hoge R, Collins L, Woods R, Toga AW, Evans AC ( 1998): Enhancement of MR images using registration for signal averaging. J Comput Assist Tomogr 22: 324–333. [DOI] [PubMed] [Google Scholar]
- Janssen I, Katzmarzyk PT, Ross R ( 2005): Body mass index is inversely related to mortality in older people after adjustment for waist circumference. J Am Geriatr Soc 53: 2112–2118. [DOI] [PubMed] [Google Scholar]
- Jefferis GS, Potter CJ, Chan AM, Marin EC, Rohlfing T, Maurer CR Jr, Luo L ( 2007): Comprehensive maps of Drosophila higher olfactory centers: Spatially segregated fruit and pheromone representation. Cell 128: 1187–1203. [DOI] [PMC free article] [PubMed] [Google Scholar]
- Jenett A, Schindelin JE, Heisenberg M ( 2006): The Virtual Insect Brain protocol: Creating and comparing standardized neuroanatomy. BMC Bioinformatics 7: 544. [DOI] [PMC free article] [PubMed] [Google Scholar]
- Joshi S, Davis B, Jomier M, Gerig G ( 2004): Unbiased diffeomorphic atlas construction for computational anatomy. Neuroimage 23( Suppl 1): S151–S160. [DOI] [PubMed] [Google Scholar]
- Kazemi K, Moghaddam HA, Grebe R, Gondry‐Jouet C, Wallois F ( 2007): A neonatal atlas template for spatial normalization of whole‐brain magnetic resonance images of newborns: Preliminary results. Neuroimage 37: 463–473. [DOI] [PubMed] [Google Scholar]
- Kikinis R, Shenton ME, Iosifescu DV, McCarley RW, Saiviroonporn P, Hokama HH, Robatino A, Metcalf D, Wible CG, Portas CM, Donnino RM, Jolesz FA ( 1996): A digital brain atlas for surgical planning, model‐driven segmentation, and teaching. IEEE Trans Vis Comput Graph 2: 232–241. [Google Scholar]
- Klein A, Hirsch J ( 2005): Mindboggle: a scatterbrained approach to automate brain labeling. Neuroimage 24: 261–280. [DOI] [PubMed] [Google Scholar]
- Klein S, van der Heide UA, Lips IM, van Vulpen M, Staring M, Pluim JPW ( 2008): Automatic segmentation of the prostate in 3D MR images by atlas matching using localized mutual information. Med Phys 35: 1407–1417. [DOI] [PubMed] [Google Scholar]
- Kochunov P, Lancaster JL, Thompson P, Woods R, Mazziotta J, Hardies J, Fox P ( 2001): Regional spatial normalization: Toward an optimal target. J Comput Assist Tomogr 25: 805–816. [DOI] [PubMed] [Google Scholar]
- Kurylas AE, Rohlfing T, Krofczik S, Jenett A, Homberg U ( 2008): Standardized atlas of the brain of the desert locust, schistocerca gregaria . Cell Tissue Res 333: 125–145. [DOI] [PubMed] [Google Scholar]
- Landis JR, Koch GG ( 1977): The measurement of observer agreement for categorical data. Biometrics 33: 159–174. [PubMed] [Google Scholar]
- Learned‐Miller EG ( 2006): Data driven image models through continuous joint alignment. IEEE Trans Pattern Anal Mach Intell 28: 236–250. [DOI] [PubMed] [Google Scholar]
- Likar B, Viergever MA, Pernus F ( 2001): Retrospective correction of MR intensity inhomogeneity by information minimization. IEEE Trans Med Imaging 20: 1398–1410. [DOI] [PubMed] [Google Scholar]
- Lorenzen P, Davis B, Gerig G, Bullitt E, Joshi S ( 2004): Multi‐class posterior atlas formation via unbiased Kullback‐Leibler template estimation. In: Barillot C, Haynor DP, Hellier P, editors. Medical Image Computing and Computer‐Assisted Intervention—MICCAI 2004. 7th International Conference, St. Malo, France, September 26–28, 2004, Proceedings, Part I. Vol. 3216 of Lecture Notes in Computer Science. Heidelberg: Springer‐Verlag. pp 78–86.
- Lorenzen P, Prastawa M, Davis B, Gerig G, Bullitt E, Joshi S ( 2006): Multi‐modal image set registration and atlas formation. Med Image Anal 10: 440–451. [DOI] [PMC free article] [PubMed] [Google Scholar]
- Madden DJ, Whiting WL, Huettel SA, White LE, MacFall JR, Provenzale JM ( 2004): Diffusion tensor imaging of adult age differences in cerebral white matter: Relation to response time. Neuroimage 21: 1174–1181. [DOI] [PubMed] [Google Scholar]
- Mattis S ( 1988): Dementia Rating Scale Professional Manual. Odessa, FL: Psychological Assessment Resources. [Google Scholar]
- Mazziotta J, Toga A, Evans A, Fox P, Lancaster J, Zilles K, Woods R, Paus T, Simpson G, Pike B, Holmes C, Collins L, Thompson P, MacDonald D, Iacoboni M, Schormann T, Amunts K, Palomero‐Gallagher N, Geyer S, Parsons L, Narr K, Kabani N, Le Goualher G, Boomsma D, Cannon T, Kawashima R, Bernard M ( 2001a) A probabilistic atlas and reference system for the human brain: International Consortium for Brain Mapping (ICBM). Philos Trans R Soc Lond B Biol Sci 356: 1293–1322. [DOI] [PMC free article] [PubMed] [Google Scholar]
- Mazziotta J, Toga A, Evans A, Fox P, Lancaster J, Zilles K, Woods R, Paus T, Simpson G, Pike B, Holmes C, Collins L, Thompson P, MacDonald D, Iacoboni M, Schormann T, Amunts K, Palomero‐Gallagher N, Geyer S, Parsons L, Narr K, Kabani N, Le Goualher G, Feidler J, Smith K, Boomsma D, Hulshoff Pol H, Cannon T, Kawashima R, Mazoyer B ( 2001b): A four‐dimensional probabilistic atlas of the human brain. J Am Med Inform Assoc 8: 401–430. [DOI] [PMC free article] [PubMed] [Google Scholar]
- Mazziotta JC, Toga AW, Evans A, Fox P, Lancaster J ( 1995): A probabilistic atlas of the human brain: Theory and rationale for its development. Neuroimage 2: 89–101. [DOI] [PubMed] [Google Scholar]
- Miller MI, Christensen GE, Amit Y, Grenander U ( 1993): Mathematical textbook of deformable neuroanatomies. Proc Natl Acad Sci USA 90: 11944–11948. [DOI] [PMC free article] [PubMed] [Google Scholar]
- Mori S, van Zijl PCM ( 2002): Fiber tracking: principles and strategies—A technical review. NMR Biomed 15: 468–480. [DOI] [PubMed] [Google Scholar]
- Mori S, Oishi K, Jiang H, Jiang L, Li X, Akhter K, Hua K, Faria AV, Mahmood A, Woods R, Toga AW, Pike GB, Neto PR, Evans A, Zhang J, Huang H, Miller MI, van Zijl P, Mazziotta J ( 2008): Stereotaxic white matter atlas based on diffusion tensor imaging in an ICBM template. Neuroimage 40: 570–582. [DOI] [PMC free article] [PubMed] [Google Scholar]
- Neeman M, Freyer JP, Sillerud LO ( 1991): A simple method for obtaining cross‐term‐free images for diffusion anisotropy studies in NMR microimaging. Magn Reson Med 21: 138–143. [DOI] [PubMed] [Google Scholar]
- Pandya D, Seltzer B ( 1986): The topography of commissural fibers In: Lepore F, Ptito M, Jasper H, editors. Two Hemispheres‐One Brain: Functions of the Corpus Callosum. New York: Alan R. Liss, Inc; pp 47–74. [Google Scholar]
- Pfefferbaum A, Sullivan EV ( 2003): Increased brain white matter diffusivity in normal adult aging: Relationship to anisotropy and partial voluming. Magn Reson Med 49: 953–961. [DOI] [PubMed] [Google Scholar]
- Pfefferbaum A, Rohlfing T, Deshmukh A, Sullivan EV ( 2006a): Ventricular enlargement in HIV infection: The role of alcoholism comorbidity. Alcohol Clin Exp Res 30 ( Suppl S): 192A. [Google Scholar]
- Pfefferbaum A, Rosenbloom MJ, Rohlfing T, Adalsteinsson E, Kemper CA, Deresinski S, Sullivan EV ( 2006b) Contribution of alcoholism to brain dysmorphology in HIV infection: Effects on the ventricles and corpus callosum. Neuroimage 33: 239–251. [DOI] [PubMed] [Google Scholar]
- Pfefferbaum A, Rosenbloom MJ, Adalsteinsson E, Sullivan EV ( 2007): Diffusion tensor imaging with quantitative fibre tracking in HIV infection and alcoholism comorbidity: Synergistic white matter damage. Brain 130: 48–64. [DOI] [PubMed] [Google Scholar]
- Pfefferbaum A, Adalsteinsson E, Rohlfing T, Sullivan EV: Diffusion tensor imaging of deep gray matter brain structures: Effects of age and iron concentration. Neurobiol Aging (in press). [DOI] [PMC free article] [PubMed] [Google Scholar]
- Pfefferbaum A, Rosenbloom M, Rohlfing T, Sullivan EV ( 2009b) Degradation of selective lateral and interhemispheric brain white matter systems in alcoholism detected with quantitative fiber tracking. Biol Psychiatry 65: 680–690. [DOI] [PMC free article] [PubMed] [Google Scholar]
- Rein K, Zöckler M, Mader MT, Grübel C, Heisenberg M ( 2002): The Drosophila standard brain. Curr Biol 12: 227–231. [DOI] [PubMed] [Google Scholar]
- Rohlfing T, Maurer CR Jr ( 2003): Nonrigid image registration in shared‐memory multiprocessor environments with application to brains, breasts, and bees. IEEE Trans Inf Technol Biomed 7: 16–25. [DOI] [PubMed] [Google Scholar]
- Rohlfing T, Maurer CR Jr ( 2005): Multi‐classifier framework for atlas‐based image segmentation. Pattern Recognit Lett 26: 2070–2079. [Google Scholar]
- Rohlfing T, Maurer CR Jr ( 2007): Shape‐based averaging. IEEE Trans Image Process 16: 153–161. [DOI] [PubMed] [Google Scholar]
- Rohlfing T, Brandt R, Maurer CR Jr, Menzel R ( 2001): Bee brains, B‐splines and computational democracy: Generating an average shape atlas In: Staib L, editor. IEEE Workshop on Mathematical Methods in Biomedical Image Analysis. Los Alamitos, CA, Kauai, HI: IEEE Computer Society; pp 187–194. [Google Scholar]
- Rohlfing T, Maurer CR Jr, Bluemke DA, Jacobs MA ( 2003): Volume‐preserving nonrigid registration of MR breast images using free‐form deformation with an incompressibility constraint. IEEE Trans Med Imaging 22: 730–741. [DOI] [PubMed] [Google Scholar]
- Rohlfing T, Brandt R, Menzel R, Maurer CR Jr ( 2004a): Evaluation of atlas selection strategies for atlas‐based image segmentation with application to confocal microscopy images of bee brains. Neuroimage 21: 1428–1442. [DOI] [PubMed] [Google Scholar]
- Rohlfing T, Russakoff DB, Maurer CR Jr ( 2004b): Performance‐based classifier combination in atlas‐based image segmentation using expectation‐maximization parameter estimation. IEEE Trans Med Imaging 23: 983–994. [DOI] [PubMed] [Google Scholar]
- Rohlfing T, Zahr NM, Sullivan EV, Pfefferbaum A ( 2008): The SRI24 multi‐channel brain atlas: Construction and applications. In: Reinhardt JM, Pluim JPW, editors. Medical Imaging 2008: Image Processing, Vol. 6914 of Proceedings of SPIE. Bellingham, WA, EID 691409. [DOI] [PMC free article] [PubMed]
- Rueckert D, Sonoda LI, Hayes C, Hill DLG, Leach MO, Hawkes DJ ( 1999): Nonrigid registration using free‐form deformations: Application to breast MR images. IEEE Trans Med Imaging 18: 712–721. [DOI] [PubMed] [Google Scholar]
- Russakoff DB, Tomasi C, Rohlfing T, Maurer CR Jr ( 2004): Image similarity using mutual information of regions. In: Computer Vision—ECCV 2004: 8th European Conference on Computer Vision, Prague, Czech Republic, May 11–14, 2004. Proceedings, Part III. Vol. 3023 of Lecture Notes in Computer Science. Berlin/Heidelberg: Springer‐Verlag. pp 596–607.
- Salat D, Tuch D, Greve D, van der Kouwe A, Hevelone N, Zaleta A, Rosen B, Fischl B, Corkin S, Diana Rosas H, Dale A ( 2005): Age‐related alterations in white matter microstructure measured by diffusion tensor imaging. Neurobiol Aging 26: 1215–1227. [DOI] [PubMed] [Google Scholar]
- Shattuck DW, Mirza M, Adisetiyo V, Hojatkashani C, Salamon G, Narr KL, Poldrack RA, Bilder RM, Toga AW ( 2008): Construction of a 3D probabilistic atlas of human cortical structures. Neuroimage 39: 1064–1080. [DOI] [PMC free article] [PubMed] [Google Scholar]
- Smith SM ( 2002): Fast robust automated brain extraction. Hum Brain Mapp 17: 143–155. [DOI] [PMC free article] [PubMed] [Google Scholar]
- Spitzer V, Ackerman MJ, Scherzinger AL, Whitlock D ( 1996): The visible human male: A technical report. J Am Med Inform Assoc 3: 118–130. [DOI] [PMC free article] [PubMed] [Google Scholar]
- Studholme C, Cardenas V ( 2004): A template free approach to volumetric spatial normalization of brain anatomy. Pattern Recognit Lett 25: 1191–1202. [Google Scholar]
- Studholme C, Constable RT, Duncan JS ( 2000): Accurate alignment of functional EPI data to anatomical MRI using a physics‐based distortion model. IEEE Trans Med Imaging 19: 1115–1127. [DOI] [PubMed] [Google Scholar]
- Sullivan EV, Adalsteinsson E, Pfefferbaum A ( 2006): Selective age‐related degradation of anterior callosal fiber bundles quantified in vivo with fiber tracking. Cereb Cortex 16: 1030–1039. [DOI] [PubMed] [Google Scholar]
- Sullivan EV, Rohlfing T, Pfefferbaum A: Quantitative fiber tracking of lateral and interhemispheric white matter systems in normal aging: Relations to timed performance. Neurobiol Aging (in press). [DOI] [PMC free article] [PubMed] [Google Scholar]
- Svarer C, Madsen K, Hasselbalch SG, Pinborg LH, Haugbøl S, Frøkjær VG, Holm S, Paulson OB, Knudsen GM ( 2005): MR‐based automatic delineation of volumes of interest in human brain PET images using probability maps. Neuroimage 24: 969–979. [DOI] [PubMed] [Google Scholar]
- Talairach J, Tournoux T ( 1988): Co‐planar Stereotaxic Atlas of the Human Brain: 3‐Dimensional Proportional System—An Approach to Cerebral Imaging. New York: Thieme Medical Publishers. [Google Scholar]
- Toga AW, Santori EM, Hazani R, Ambach K ( 1995): A 3D digital map of rat brain. Brain Res Bull 38: 77–85. [DOI] [PubMed] [Google Scholar]
- Twining CJ, Cootes T, Marsland S, Petrovic V, Schestowitz R, Taylor CJ ( 2005): A unified information‐theoretic approach to groupwise non‐rigid registration and model building. In: Christensen GE, Sonka M, editors. Information Processing in Medical Imaging—19th International Conference, IPMI 2005, Glenwood Springs, CO, USA, July 2005, Proceedings. Vol. 3565 of Lecture Notes in Computer Science. Berlin/Heidelberg: Springer‐Verlag. pp 1–14. [DOI] [PubMed]
- Tzourio‐Mazoyer N, Landeau B, Papathanassiou D, Crivello F, Etard O, Delcroix N, Mazoyer B, Joliot M ( 2002): Automated anatomical labeling of activations in SPM using a macroscopic anatomical parcellation of the MNI MRI single‐subject brain. Neuroimage 15: 273–289. [DOI] [PubMed] [Google Scholar]
- Vitaliano P, Breen A, Albert M, Russo J, Prinz P ( 1984): Memory, attention, and functional status in community‐residing Alzheimer type dementia patients and optimally healthy aged individuals. J Gerontol 39: 58–64. [DOI] [PubMed] [Google Scholar]
- Wang Q, Seghers D, D'Agostino E, Maes F, Vandermeulen D, Suetens P, Hammers A ( 2005): Construction and validation of mean shape atlas templates for atlas‐based brain image segmentation. In: Christensen GE, Sonka M, editors. Information Processing in Medical Imaging—19th International Conference, IPMI 2005, Glenwood Springs, CO, USA, July 2005, Proceedings. Vol. 3565 of Lecture Notes in Computer Science. Berlin/Heidelberg: Springer‐Verlag. pp 689–700. [DOI] [PubMed]
- Woods RP, Dapretto M, Sicotte NL, Toga AW, Mazziotta JC ( 1999): Creation and use of a Talairach‐compatible atlas for accurate, automated, nonlinear intersubject registration, and analysis of functional imaging data. Hum Brain Mapp 8: 73–79. [DOI] [PMC free article] [PubMed] [Google Scholar]
- Zahr NM, Mayer D, Pfefferbaum A, Sullivan EV ( 2008): Low striatal glutamate levels underlie cognitive decline in the elderly: Evidence from in vivo molecular spectroscopy. Cereb Cortex 18: 2241–2250. [DOI] [PMC free article] [PubMed] [Google Scholar]
- Zahr NM, Rohlfing T, Pfefferbaum A, Sullivan EV ( 2009): Problem solving, working memory, and motor correlates of association and commissural fiber bundles in normal aging: A quantitative fiber tracking study. Neuroimage 44: 1050–1062. [DOI] [PMC free article] [PubMed] [Google Scholar]
- Zhang J, Rangarajan A ( 2005): Multimodality image registration using an extensible information metric and high dimensional histogramming In: Christensen GE, Sonka M, editors. Information Processing in Medical Imaging—19th International Conference, IPMI 2005, Glenwood Springs, CO, USA, July 2005, Proceedings. Vol. 3 of Lecture Notes in Computer Science. Berlin/Heidelberg: Springer‐Verlag; pp 725–737. [DOI] [PubMed] [Google Scholar]
- Zhang Y, Brady M, Smith S ( 2001): Segmentation of brain MR images through a hidden Markov random field model and the expectation‐maximization algorithm. IEEE Trans Med Imaging 20: 45–57. [DOI] [PubMed] [Google Scholar]


