Abstract
The propagation of information through signaling cascades spans a wide range of time-scales, including the rapid ligand-receptor interaction and the much slower response of downstream gene expression. To determine which dynamic range dominates a response, we used periodic stimuli to measure the frequency dependence of signal transduction in the osmo-adaptation pathway of Saccharomyces cerevisiae. We applied system identification methods to infer a concise predictive model. We found that the dynamics of the osmo-adaptation response are dominated by a fast-acting negative feedback through the kinase Hog1 that does not require protein synthesis. After large osmotic shocks, an additional, much slower, negative feedback through gene expression allows cells to respond faster to future stimuli.
The mechanisms cells use to sense and respond to environmental changes include complicated systems of biochemical reactions that occur with rates spanning a wide dynamic range. Reactions can be fast, such as association and dissociation between a ligand and its receptor (< 1 s), or slow, such as protein synthesis (> 103 s). Though a system may comprise hundreds of reactions, often only a few of them dictate the system dynamics. Unfortunately, identification of the dominant processes is often difficult, and many models instead incorporate knowledge of all reactions in the system. Although occasionally successful (1–4), this exhaustive approach often suffers from missing information, such as unknown interactions or parameters.
Here we used systems engineering tools to study how oscillatory signals propagate through a signal transduction cascade, allowing us to identify and concisely model the interactions that dominate system dynamics. The cornerstone of this approach is to measure the cascade output in response to input signals oscillating at a range of frequencies (5, 6). By comparing the frequency response of the wild-type network to that of mutants, the molecular underpinnings of network dynamics can be determined. Studies of neural and other physiological systems have used systems theory (6), while control-theory has also been applied to cellular networks (7–14).
We focused on the high osmolarity glycerol (HOG) Mitogen-activated protein kinase (MAPK) cascade in the budding yeast Saccharomyces cerevisiae. This cascade forms a core module of the hyperosmotic-shock-response system and is particularly well suited to frequency-response analysis for several reasons. First, both the input (extracellular osmolyte concentration) and output (activity of the MAPK Hog1) of the network are easily measured and manipulated. Second, the molecular components of the network have been well studied, facilitating connection of dynamic models with molecular events. Finally, the system contains multiple negative feedback loops that operate on different time-scales (4, 15, 16). It is still unclear which negative feedback loop or loops dominate the signaling dynamics and whether the different feedback loops have distinct biological functions. We determined the properties of the main negative feedback loops in the HOG network and arrived at a concise predictive model of the signaling dynamics. Furthermore, by analyzing the system's dynamics over a range of osmotic shock strengths, we begin to understand how the multiple-feedback architecture might be beneficial for osmotic homeostasis in fluctuating environments.
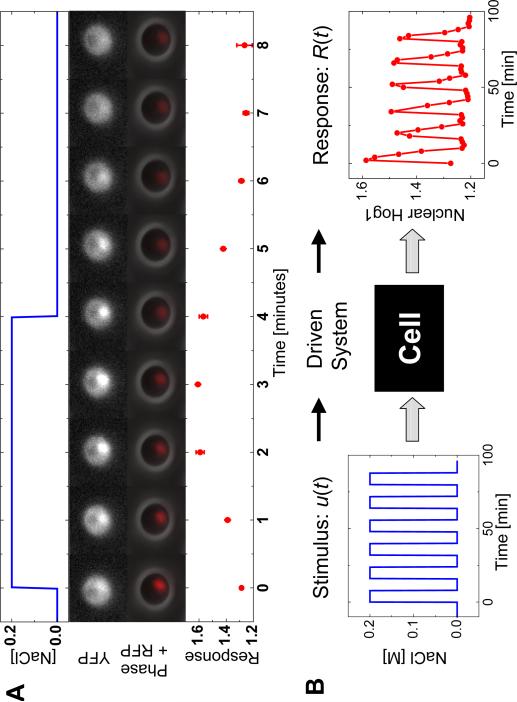
Upon hyperosmotic shock, membrane proteins trigger a signal-transduction cascade that culminates in the activation of the MAPK Hog1, which is primarily cytoplasmic prior to the osmoshock (17, 18). When activated, Hog1 accumulates in the nucleus (Fig. 1A), where it activates a broad transcriptional response to osmotic stress (19). Constitutively active phosphatases dephosphorylate and deactivate Hog1, leading to its export from the nucleus. Upon restoration of osmotic balance, either through changes to the extracellular environment or the intracellular osmolyte concentration, cascade activity ceases, and the Hog1 nuclear enrichment decreases (Fig. 1A). To estimate the amount of phosphorylated Hog1 in living cells, we simultaneously monitored the cellular localization of Hog1-YFP, a yellow fluorescent protein fused to Hog1, and Nrd1-RFP, a red fluorescent protein fused to a strictly nuclear protein. To quantify Hog1 nuclear localization, we define the function, , as the ratio (averaged over many cells) of mean YFP pixel intensities in the nucleus and the whole cell (Fig. 1A, red circles).
Fig. 1.
Enrichment of Hog1 nuclear localization is driven by pulsed salt shocks. (A) Localization of the fusion protein Hog1-YFP and the nuclear marker Nrd1-RFP by fluorescence microscopy. NaCl (0.2 M) was applied and removed Hog1-YFP as shown by the blue line. The population average translocation response (red circles) was defined by the ratio of average YFP fluorescence in the nucleus to the average YFP fluorescence. (B) Oscillations of Hog1-YFP translocation in a population of cells (red circles) in response to square wave oscillations in the input of extracellular NaCl (blue line).
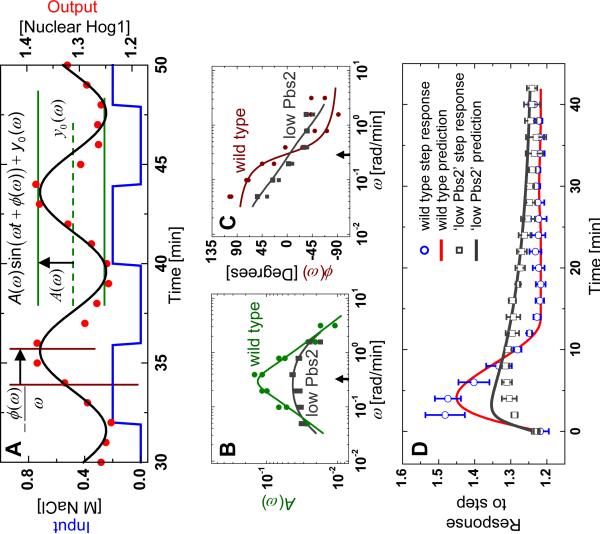
Cells were periodically shocked in a flow chamber (Fig. S1) in which a computer-actuated valve supplied square-wave pulses of media with and without 0.2 M NaCl (Fig. 1B, blue line). Localization of fluorescent proteins was concurrently imaged (Fig. 1B, red circles). Using Fourier analysis (20), we approximated both the input and output signals as sine waves oscillating with a period and quantified the output signal by a magnitude A(ω) and relative phase shift ϕ(ω) (Fig. 2A) (21). We measured the response of the system to square-wave stimuli with periods ranging from T0 = 2 minutes to T0 = 128 minutes (Fig. S2). These responses were analyzed to obtain so-called Bode plots (Fig. 2, B and C) (20), representing the frequency-dependent amplitude A(ω) and phase ϕ(ω).
Fig. 2.
Fourier analysis, model fits, and model predictions of Hog1 nuclear enrichment. (A) Illustration of the input (NaCl concentration, blue line), the network response (Hog1-YFP translocation, red circles), and the sine wave (black line) corresponding to the Fourier transform of the response at the driving frequency ω. This Fourier component is described by three parameters: A(ω) (green) representing the amplitude of the oscillations, ϕ(ω) (brown) representing the phase delay between the input and the response oscillations, and y0(ω) representing the signal offset. (B) Measurement of the Fourier amplitude A(ω) (green dots) over a range of driving frequencies along with model fit (green line). (C) Phase of the response measured relative to the driving signal (brown dots) along with model prediction of the phase (brown line). (D) Response of the system to a step increase of 0.2 M NaCl compared to the step response predicted by the model. The `Low Pbs2' data (gray boxes) is gathered from the Pbs2 under-expression mutant strain and was used to generate the model fit (gray line in (B)) and model predictions (gray lines in (C) and (D)).
We used linear-systems theory to develop a predictive model for the response to arbitrary osmotic input signals u(t) (20). We fitted a general second order linear time invariant (LTI) model to the data in Fig. 2B and used the extracted parameters and a simple non-linear element (20, 22) to predict the response to a step input of 0.2 M NaCl. The model accurately predicted both the response amplitude and the time required to return to basal activity (Fig. 2D, blue circles).
Because our model was not instructed by knowledge of the underlying biology, we sought to explore how it is similar to and different from the canonical molecular model of the hyperosmotic-shock response. Thus, we converted our LTI model into a model, which is more readily interpreted in terms of biological processes (20):
| [1] |
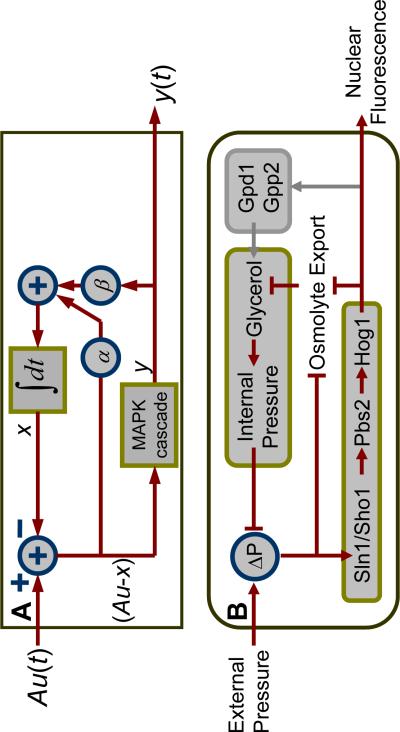
This model contains two negative feedback loops, which act to reduce the difference, (A0u − x), between the stimulus A0u and the internal state variable x. Fig. 3A shows a schematic of the model, and Fig. 3B shows the canonical biochemical mechanisms that regulate the osmotic-shock response. Because of the high degree of correspondence between our derived model and the extensive Hog1 literature, we interpret the state variable, x, as the intracellular osmolyte concentration, and y as enrichment of phosphorylated Hog1 above its baseline level. Thus, interpreted in biological terms, our model predicts that one feedback pathway depends on Hog1-induced glycerol accumulation (i.e., βy changes x through the activity of the observable y), whereas a second glycerol-accumulating pathway is Hog1-independent (i.e., α(A0u − x) changes x independently of y).
Fig. 3.
Network topology implied by pulsed-input analysis corresponds to biological network. (A) Diagramatic representation of the mechanistic model shows two linear negative feedbacks: one dependent on Hog1 activity with strength β, and a second independent of Hog1 activity with strength α. The intracellular osmotic pressure was modeled as an integrator, whereas the MAPK signal transduction pathway was modeled by the linear impulse response function. The output of circumscribed-plus-sign symbols is simply the sum of its inputs. (B) The osmo-adaptation network structure. Upon osmotic stress, cells increase or decrease their export rate of glycerol through the trans-membrane protein Fps1, which is modified by Hog1-independent and Hog1-dependent mechanisms. In addition, under high osmotic stresses, active nuclear Hog1 is known to modify the expression of glycerol producing proteins over longer timescales. ΔP represents the difference between internal and external pressure relative to its optimal value.
To gauge the relative strength of the two feedbacks, we applied the same Fourier technique to a mutant strain expressing a reduced amount of Pbs2, the MAPK kinase that phosphorylates Hog1 (Fig. 3B). Because Hog1 is not activated as highly after a hyperosmotic shock in this strain, we can effectively isolate Hog1-dependent feedback from Hog1-independent feedback by comparing the response dynamics (Fig. S4) to those of the wild-type strain. Bode plots for this strain were different than those of the wild-type strain (Fig. 2, B and C). Fitting the LTI model to the A(ω) data alone yielded a good fit (Fig. 2B, black squares) as well as an accurate prediction for the ϕ(ω) data (Fig. 2C, black squares) and the step response (Fig. 2D, black squares). This latter prediction (Fig. 2D, gray line) reproduced both the reduced maximum response and the slower response dynamics observed in this strain. This suggests that the Hog1-dependent feedback loop plays a major role in rapidly regulating the osmotic shock response (20).
We compared our model with known biological details of the hyperosmotic shock response (4, 15, 16). Yeast regulate their intracellular osmolyte concentration through two parallel mechanisms. In a Hog1-independent manner, the membrane protein Fps1 quickly (< 2 min) responds by decreasing the glycerol-export rate (23, 24), thereby leading to glycerol retention. Further, active Hog1 increases expression of the glycerol-producing proteins Gpd1 and Gpp2. This raises the intracellular glycerol level over longer timescales (> 30 min) (25).
Though the topology of our derived model corresponds closely to that of the known biological system (Fig. 3A–B), dynamical differences suggest that the current view of the MAPK's role in osmotic regulation is incomplete. Cells begin to recover from the NaCl pulse within 5 min and are finished responding within 15 min. Both of these time-scales are faster than the >15 min typically required for gene expression (4). This suggests that both feedback loops in our model control the rapid accumulation of glycerol, consistent with previous reports (23, 24, 26).
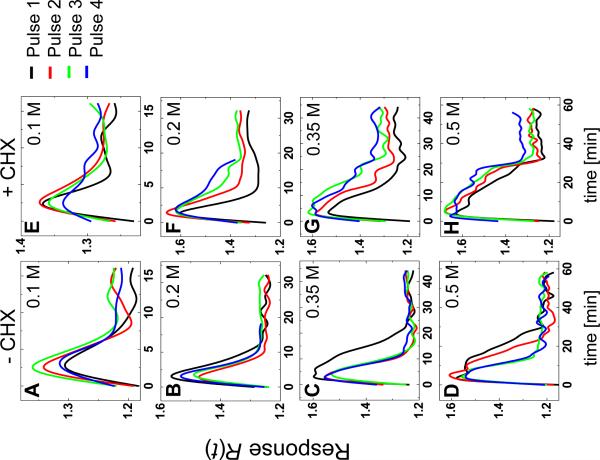
Our model suggests that gene expression plays a minimal role in the hyperosmotic-shock response, yet the expression of hundreds of genes changes in response to hyperosmotic shock. We hypothesized that gene expression may be more important as a longer-timescale feedback in this system, so we looked for pulse-to-pulse variability in the response of cells stimulated with periodic pulses of NaCl (Fig. S5). Cells were shocked either in the absence (Figs. 4A through D) or presence (Figs. 4E through H) of cycloheximide, a small molecule that inhibits protein synthesis. As predicted by the initial data, cells responded very similarly to an initial pulse of osmolyte regardless of their ability to synthesize new proteins (Fig. 4, black lines). Nevertheless, we found that cells stimulated multiple times recovered from each subsequent pulse faster in the absence of cycloheximide and slower in its presence, revealing a longer timescale component absent from our earlier data. These results suggest that non-transcriptional feedback mediates short-timescale osmolyte accumulation (4, 16, 26, 27), whereas gene expression plays a role in osmolyte production only on longer timescales and for more intense shocks. Accordingly, we found that stronger shocks cause cells to increase their rate of glycerol production (Fig. S6) in a gene-expression-dependent manner, permitting faster recovery to subsequent fluctuations (28).
Fig. 4.
Gene expression facilitates response to subsequent pulses. Consecutive-pulse responses were compared for cells treated with (A) 0.1 M NaCl, 16 min. period (i.e., 8 min at 0.1 M followed by 8 min at 0.0 M), (B) 0.2 M NaCl, 32 min. period, (C) 0.35 M NaCl, 45 min. period, and (D) 0.5 M NaCl, 60 min. period. (E–H) Similarly treated cells also exposed to cycloheximide.
These results demonstrate the promise of applying engineering principles to cellular networks, particularly when predicting the response of the system to dynamic stimuli. In more complex systems, measuring the activity level of all relevant state-space variables could help with determining the effective network structure.
Supplementary Material
Acknowledgments
We thank J. Falvo, R. Tsien, and E. O'Shea for suggesting and providing Nrd1-RFP as a nuclear marker, and thank E. Sontag, S. Hohmann, K. Maclean, and A. Raj for helpful discussions. Supported by NSF grant PHY-0548484 and NIH grants R01-GM068957 and 5 R90 DK071511-01, NSF Graduate Research Fellowships to J.T. Mettetal and D. Muzzey, and an MIT-Merck Graduate Fellowship to C. Gómez-Uribe.
References and Notes
- 1.Tyson JJ, Chen K, Novak B. Nat Rev Mol Cell Biol. 2001;2:908–16. doi: 10.1038/35103078. [DOI] [PubMed] [Google Scholar]
- 2.Slepchenko BM, Schaff JC, Macara I, Loew LM. Trends Cell Biol. 2003;13:570–6. doi: 10.1016/j.tcb.2003.09.002. [DOI] [PubMed] [Google Scholar]
- 3.Kitano H, Funahashi A, Matsuoka Y, Oda K. Nat Biotechnol. 2005;23:961–6. doi: 10.1038/nbt1111. [DOI] [PubMed] [Google Scholar]
- 4.Klipp E, Nordlander B, Kruger R, Gennemark P, Hohmann S. Nat Biotechnol. 2005;23:975–82. doi: 10.1038/nbt1114. [DOI] [PubMed] [Google Scholar]
- 5.Oppenheim AV, Willsky AS, Young IT. Signals and systems. Prentice-Hall; 1983. [Google Scholar]
- 6.Westwick DT, Kearney RE. Identification of Nonlinear Physiological Systems. IEEE Press; 2003. [Google Scholar]
- 7.Savageau MA. Biochemical systems analysis. A study of function and design in molecular biology. Addison-Wesley; Reading, MA: 1976. [Google Scholar]
- 8.Block SM, Segall JE, Berg HC. Cell. 1982;31:215–26. doi: 10.1016/0092-8674(82)90421-4. [DOI] [PubMed] [Google Scholar]
- 9.Yi TM, Huang Y, Simon MI, Doyle J. Proc Natl Acad Sci U S A. 2000;97:4649–53. doi: 10.1073/pnas.97.9.4649. [DOI] [PMC free article] [PubMed] [Google Scholar]
- 10.Vance W, Arkin A, Ross J. Proc Natl Acad Sci U S A. 2002;99:5816–21. doi: 10.1073/pnas.022049699. [DOI] [PMC free article] [PubMed] [Google Scholar]
- 11.Samoilov M, Arkin A, Ross J. Journal of Physical Chemistry A. 2002;106:10205–10221. [Google Scholar]
- 12.Ingalls BP. Journal of Physical Chemistry B. 2004;108:1143–1152. [Google Scholar]
- 13.Sontag ED. European Journal of Control. 2005;11:396–435. [Google Scholar]
- 14.Lipan O, Wong WH. Proc Natl Acad Sci U S A. 2005 May 17;102:7063–8. doi: 10.1073/pnas.0403790102. [DOI] [PMC free article] [PubMed] [Google Scholar]
- 15.Hohmann S. Microbiol Mol Biol Rev. 2002;66:300–72. doi: 10.1128/MMBR.66.2.300-372.2002. [DOI] [PMC free article] [PubMed] [Google Scholar]
- 16.Gennemark P, Nordlander B, Hohmann S, Wedelin D. In Silico Biol. 2006;6:0018. [PubMed] [Google Scholar]
- 17.Ferrigno P, Posas F, Koepp D, Saito H, Silver PA. Embo J. 1998;17:5606–14. doi: 10.1093/emboj/17.19.5606. [DOI] [PMC free article] [PubMed] [Google Scholar]
- 18.Reiser V, Ruis H, Ammerer G. Mol Biol Cell. 1999;10:1147–61. doi: 10.1091/mbc.10.4.1147. [DOI] [PMC free article] [PubMed] [Google Scholar]
- 19.Posas F, et al. J Biol Chem. 2000;275:17249–55. doi: 10.1074/jbc.M910016199. [DOI] [PubMed] [Google Scholar]
- 20.Details are available in the Supplementary Materials.
- 21.In principle, both the input and output signals also contain higher frequency components. Nevertheless, here we focus on the driving frequency alone in order to simplify analysis while obtaining significant information about the signal's strength and timing.
- 22.The linear model is related to measured outputs using the formulas Rmodel (t) = fnl (y(t)) + R0 and fnl (y) = y(t) + |y(t)| (Fig. S3).
- 23.Luyten K, et al. Embo J. 1995;14:1360–71. doi: 10.1002/j.1460-2075.1995.tb07122.x. [DOI] [PMC free article] [PubMed] [Google Scholar]
- 24.Tamas MJ, et al. Mol Microbiol. 1999;31:1087–104. doi: 10.1046/j.1365-2958.1999.01248.x. [DOI] [PubMed] [Google Scholar]
- 25.Albertyn J, Hohmann S, Thevelein JM, Prior BA. Mol Cell Biol. 1994;14:4135–44. doi: 10.1128/mcb.14.6.4135. [DOI] [PMC free article] [PubMed] [Google Scholar]
- 26.Thorsen M, et al. Mol Biol Cell. 2006;17:4400–10. doi: 10.1091/mbc.E06-04-0315. [DOI] [PMC free article] [PubMed] [Google Scholar]
- 27.Proft M, Struhl K. Cell. 2004;118:351–61. doi: 10.1016/j.cell.2004.07.016. [DOI] [PubMed] [Google Scholar]
- 28.Krantz M, et al. Eukaryot Cell. 2004;3:1381–90. doi: 10.1128/EC.3.6.1381-1390.2004. [DOI] [PMC free article] [PubMed] [Google Scholar]
Associated Data
This section collects any data citations, data availability statements, or supplementary materials included in this article.


