Abstract
The elevation of serum alanine aminotransferase (ALT) is regarded as an indicator of liver damage based on the presumption that ALT protein is specifically and abundantly expressed in the liver. However, ALT elevation is also observed in non-liver injury conditions (e.g., muscle injury) and in apparently healthy people. Conversely, serum ALT activity is normal in many patients with confirmed liver diseases (e.g., cirrhosis and hepatitis C infection). To improve the diagnostic value of the ALT assay and to understand the molecular basis for serum ALT changes in various pathophysiological conditions, we have cloned rat ALT isoenzyme ALT1 and ALT2 cDNAs, examined their tissue expressions at the mRNA and protein levels, and determined ALT1 and ALT 2 serum levels in response to liver damage in rodents. Quantitative real-time PCR (qRT-PCR) analysis shows that ALT1 mRNA is widely distributed and mainly expressed in intestine, liver, fat tissues, colon, muscle and heart, in the order of high to low expression level, whereas ALT2 gene expression is more restricted, mainly in liver, muscle, brain, and white adipose tissue. The tissue distribution pattern of ALT1 and ALT2 proteins largely agrees with their mRNA expression. Interestingly, hepatic ALT2 protein is about four times higher in male rats than female rats. In addition, ALT isoenzymes distribute differentially at the subcellular level in that ALT1 is a cytoplasmic protein and ALT2 a mitochondrial protein, supporting bioinformatic prediction of mitochondrial localization of ALT2. Finally, using animal models of hepatoxicity induced by carbon tetrachloride and acetaminophen, we found that both serum ALT1 and ALT2 protein levels were significantly elevated and correlated with ALT activity, providing, for the first time, the molecular basis for the elevated total serum ALT activity.
INTRODUCTION
Alanine aminotransferase (ALT) [EC 2.6.1.2., also called glutamate pyruvate transaminase] is an important enzyme in the intermediary metabolism of glucose and protein catalyzing the reversible transamination between alanine and 2-oxoglutarate to form pyruvate and glutamate. ALT has been used as a marker for liver injury in people and in preclinical toxicity studies. Serum ALT activity is significantly elevated in a variety of liver conditions, including viral infection, cirrhosis, non-alcoholic steatohepatitis (NASH) and drug toxicity. However, the increase of serum ALT activity is also observed in conditions other than liver damage, such as muscle disease, celiac disease and in apparently healthy people (1–7). Conversely, serum ALT is not increased in some patients with histopathologically confirmed liver diseases, e.g., in cirrhosis, NASH (8), hepatitis C infection (9, 10). Similarly, in preclinical drug toxicity evaluation, there are often examples where serum ALT elevation is observed in rodents in the absence of histological damage (11). Thus, interpretation of serum ALT data can sometimes be challenging in clinical diagnostics and in preclinical drug toxicity evaluation. The reason that ALT has historically served as a major marker for liver damage is attributed to its abundant expression in liver (12–14) and low levels present in other tissues in both rats and humans (15), The “leakage” of the enzyme is thought to occur during damage of the liver, which results in an elevation of ALT in serum. Currently, serum ALT levels are measured by the catalytic activity of the enzyme. However, whether liver damage indeed results in the increase of ALT protein in serum has not been demonstrated. We and others have cloned the genes of ALT isoenzymes, ALT1 and ALT2, in the mouse (16) and human (17) (18) and found that the two isoenzymes are expressed differently in tissues and probably in the subcellular compartments. We have speculated that both ALT isoenzymes will be present in the serum and contribute to the total ALT activity. Therefore, the measurement of ALT isoenzyme may provide new valuable information in clinical diagnostics and preclinical drug safety assessment.
The rat is the most commonly used animal model in regulatory toxicology studies for assessment of drugs in development. The results from the animal studies are then used to help predict potential hepatotoxicity issues in humans. Liver toxicity is one of the most common reasons for termination of the development of drugs in people, but overall there is only 43% concordance between toxicities seen in rodents and humans as assessed by a retrospective study of toxicity of pharmaceuticals in development (19). Thus a better understanding of ALT distribution and pathophysiology in rats and humans would be useful to improve the predictability of the ALT test for liver damage. To this end, we have cloned ALT1 and ALT2 genes in rats, and measured their expression in multiple tissues at the mRNA and protein level. In addition, we examined their sex-differences and subcellular localization, and the changes of their protein levels in serum of animals treated with known liver toxicants carbon tetrachloride and acetaminophen.
MATERIALS AND METHODS
Molecular cloning of rALT1 and rALT2 cDNAs
The expressed sequence tags (ESTs) of rALT1 and rALT2 in GenBank were identified through bioinformatics analysis using human and murine ALT protein sequences as probes. Restriction endonuclease (RE)-anchored PCR primers p1615 (5-cca gat cta agc ttc cat ATG GCC TCA CGG GTG AAT GAT-3’; RE sequence in lower case) and p1616 (5’-tgc ggc cgc tct aga TCA GGA GTA CTC ATG GGT GAA -3’) were designed based on rALT1 EST sequence and used to amplify the full-length rALT1 cDNA with rat liver first-strand cDNAs as the template by using Phusion High-Fidelity polymerase (New England Biolabs). Primers p1617 (5’-gcc tct aga cat atg GCC GAA GCC TCG GCG GCG CTC-3’) and p1618 (5’-tgc ggc cgc TCA TGA GTA CTT CTC CAG GAA-3’) were used to obtained full-length rALT2 cDNA using the IMAGE clone 7113147 of the Mammalian Genome Collection as the template by PCR. The PCR products were cloned into pCRII-blunt vector (Stratagene) and verified to be rat ALT1 and ALT2 full-length cDNAs by sequencing.
Quantitative Real-time PCR Analysis
Total RNAs were prepared with Trizol (Invitrogen) from snap-frozen tissues of Sprague-Dawley rat (Jackson Laboratories). First-strand cDNAs were made by reverse transcription from the total RNAs using the Advantage cDNA kit (Clontech) according to the manufacturer’s instruction. Real-time PCR was conducted using Taqman gene expression assay (Applied Biosystems, assay ID: rALT1: Rn00578989_g1, rALT2: Rn01538341_m1 and rat cyclophilin: Rn00690933_m1) on an ABI7900 sequencing detection system. The relative expression level of rALT mRNAs were calculated by using 2−Δ Δct method and normalized by the expression level of cyclophilin A.
Recombinant rALT1 and rALT2 production and antibody purification
The full-length rALT cDNAs from the pCRII-blunt vector were re-subcloned into insect expression vector pFastBacHTb (Invitrogen) and the recombinant rALT1 and rALT2 (without the 28-amino acid mitochondrial leader sequence at the N-terminus) enzymes were expressed as His-tag fusion proteins according to Invitrogen’s Bac-to-Bac baculovirus expression protocol. The expressed fusion protein was purified with nickel affinity chromatography, followed by the removal of His tag after TEV protease cleavage for functional analysis. Polyclonal antisera against rALT1 or rALT2 were generated through a standard protocol (Abbomax, CA) by using the recombinant protein. The antisera were purified through the following alternative antigen-based depletion and absorption protocols to remove low degree of cross-reactivities of ALT antiserum against each other isoenzyme. Briefly, 5 mg of recombinant protein was covalently immobilized to CNBr-activated Sepharose 4B resin (Pharmacia) according to the manufacturer’s instruction. To obtain rALT1-specific antibody, 1 ml of diluted ALT1 antiserum (in 1XTBS buffer) was first passed through rALT2-affinity column to deplete rALT2 cross-reactivity. The flow-through fraction was then loaded to rALT1-affinity column. After washing with 15 ml 1xTBS buffer, rALT1-specific antibody was obtained by eluting the ALT1-affinity column-absorbed antibody with 2 ml of glycine-buffer (pH 2.7) into a tube containing 0.2 ml of 1M Tris-HCl buffer (pH 8.0). A similar procedure was used to obtain rALT2-specific antibody.
Western blot analysis
Snap-frozen tissues of Sprague-Dawley rats (Charles River) were minced and then homogenized with a Dounce homogenizer in lysis buffer containing 0.5% NP40, 50 mM Tris-HCl (pH 7.5), 150 mM NaCl, and proteinase inhibitor cocktails. Lysate supernatants were collected after centrifugation at 3,000 × g for 10 min. For Western blot analysis, reduced cell lysates were separated by electrophoresis on 7.5% Criterion (Bio-Rad) or home-made polyacrylamide gels. Following electrophoresis, proteins were transferred onto PVDF membranes and bound proteins were probed with an appropriate primary ALT antibody and HRP-conjugated second antibody, developed with electrochemiluminescence (ECL). Concentrations of ALTs in each sample were obtained by measuring the density of Western signals by FluorChem (Alpha Innotech) using recombinant rat ALTs as standards, Rabbit anti-rat cyctochrome C antibody (Cell Signaling Technology) was used for assessing mitochondrial content.
Mitochondria purification
To purify rat mitochondria, male rat liver tissues were homogenized in 5 volumes of buffer A (210mM mannitol, 70mM sucrose, 5mM Hepes-KOH (pH 7.4), 1mM EGTA and 0.5% BSA) and homogenate was then centrifuged at 700 × g for 10 min. The resultant supernatant was further centrifuged at 14,000 × g for 10 min to collect the mitochondrial pellet. Enriched mitochondria fraction was obtained by washing twice with buffer B [210mM mannitol, 70mM sucrose, 10mM MgCl2, 5mM K2HPO4, 10mM MOPS (pH 7.4) and 1mM EGTA] and centrifugation at 10,000 × g. The resulting pellet was dissolved in lysis buffer (see Western blot analysis) and used for measuring ALT activity and Western analysis.
ALT activity assay
ALT activity was determined by using the alanine aminotransferase kit (Calchem) according to the manufacturer’s instruction. Briefly, 10 ul of serum was incubated with a 2.5 ml mixture of reagent A and B containing L-alanine, NADH, LDH and 2-oxoglutarate at 25°C. Absorbance at 340 nm was recorded for 5 min at 30 second intervals after the addition of protein fraction or serum. The slope of absorbance decrease is proportional to ALT activity. Final ALT activities were corrected by protein concentration of cell lysates. One unit of ALT activity was defined as the amount of enzyme that catalyzes the formation of 1 μmol/L of NAD per minute under conditions of the assay at 25°C.
Hepatoxicity induced by carbon tetrachloride (CCl4) and acetaminophen (APAP)
CCL4 and APAP were obtained from Sigma
For CCL4 study, four eight-week old male C57BL/6 mice were injected intraperitoneally with CCl4 at 2 ml per kilogram of body corn oil and blood was collected before and 24 hours after injection and serum was used for measuring ALT activity and for ALT proteins. For APAP study, Sprague-Dawley rats were divided into APAP group, receiving APAP (1400 mg/kg in 0.5% methylcellulose, oral gavage) or control group receiving the vehicle 0.5% methylcellulose. Sera were collected at 48 hours.
Statistics
Data were expressed as mean+/− S.E. Statistical analyses to compare the difference of ALT activity, protein concentrations or gene expression levels between groups were performed with Student’s t test. Linear regression for correlation was carried out with GraphPad-Prism 4 software. A p value less than 0.05 was considered to be significant.
RESULTS
Cloning of rALT1 and rALT2
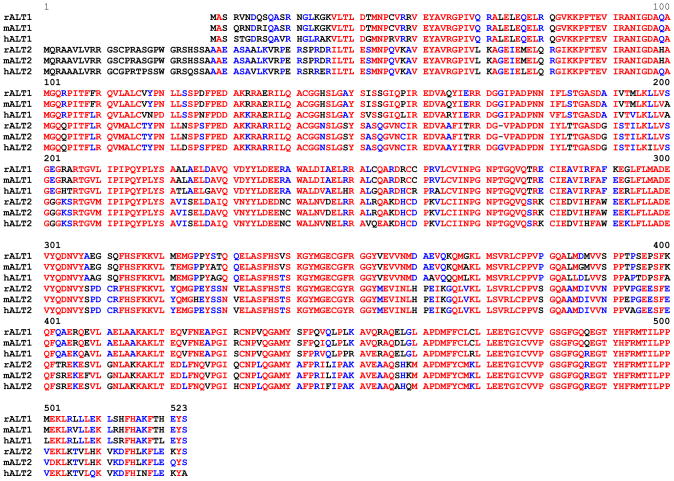
A search of rat EST database in GenBank using human and murine ALT1 and ALT2 peptide sequences as probes yielded multiple highly homologous EST sequences (data not shown). The PCR fragments flanking the entire protein-coding region were obtained at the expected size of 1.5 kb and 1.55 kb by PCR for ALT1 and ALT2, respectively. Subsequent cloning and sequencing resulted in rALT1 and rALT2 cDNAs, which are predicted to encode proteins of 496 and 522 amino acids, respectively (Figure 1). Comparison of the rat with human and murine peptide sequences reveals that rALT1 shares 97% and 88% identities to the murine and human counterpart, respectively, whereas more conservation is observed in rALT2, which is 98% and 94% identical to its murine and human orthologs (Table 1). Rat ALT1 and ALT2 share 68% identity between the translated amino acid sequences, which is at a similar degree of conservation observed in the mouse and human (17).
Fig. 1.
Comparison of deduced peptide sequences ALT1 and ALT2 from the rat (r), mouse (m) and human (h). Amino acid in red: fully conserved; blue: well conserved and black: less conserved. Peptide sequences are aligned using Multalin (35). Amino acids are numbered to the ALT2 sequence.
Table 1.
Comparison of amino acid identity of ALT1 and ALT2 isoenzymes among the rat (r), mouse (m) and human (h), determined by GAP analysis with Genetics Computer Group (GCG) DNA analysis package.
| rALT1 | hALT1 | mALT1 | rALT2 | hALT2 | mALT2 | |
|---|---|---|---|---|---|---|
| rALT1 | 100 | 88 | 97 | 68 | 68 | 68 |
| hALT1 | 100 | 87 | 68 | 67 | 67 | |
| mALT1 | 100 | 67 | 68 | 67 | ||
| rALT2 | 100 | 94 | 98 | |||
| hALT2 | 100 | 93 | ||||
| mALT2 | 100 |
Quantitative analyses of ALT gene and protein expression
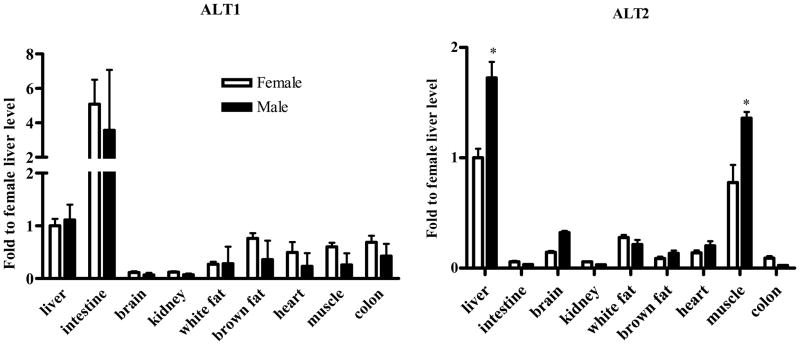
We next determined the tissue distribution and expression levels of ALT1 and ALT2 in adult male and female rats. As shown in Fig. 2, ALT1 appears widely expressed in the tissues examined, being highest in small intestine and liver, significant amounts in brown adipose tissue, white adipose tissue, heart, muscle and colon, and low expression in kidney and brain. On the other hand, ALT2 expression is more restricted with highest expression in the muscle and liver, and then in the white adipose tissue and brain and lower levels are present in heart, kidney and colon. The tissue with most difference in ALT isoenzyme expression is the intestine, with abundant ALT1 expression and nominal ALT2 expression.
Fig. 2.
Quantitative PCR of ALT1 and ALT2 tissue distribution. Quantitative RT-PCR was conducted on the tissues indicated. The relative gene expression levels were adjusted to cyclophilin across the tissues and relative to the liver tissue of female rats. Data were expressed as mean + S.E. (n = 5 animals). *: p < 0.05, compared to the female.
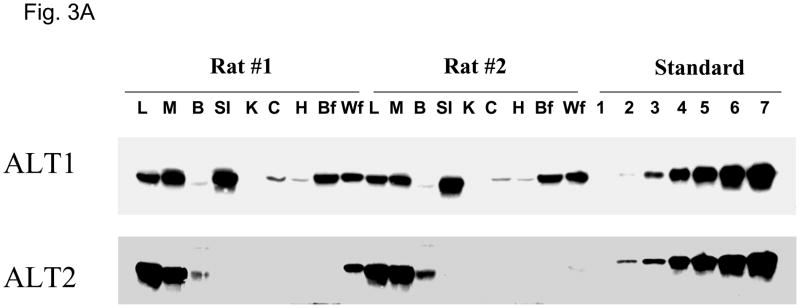
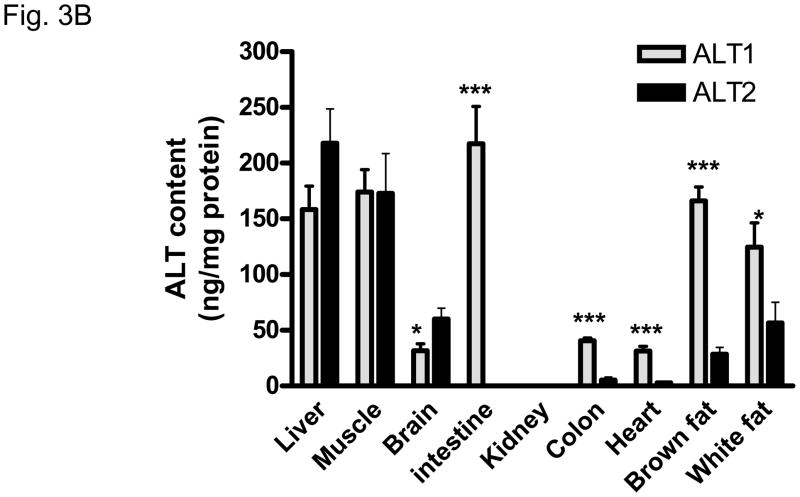
Quantification of ALT protein expression by Western analysis was conducted on tissue lysates with reference to known amount of recombinant ALT1 or ALT2 protein on the same blot (Figure 3A and 3B). The expression pattern of ALT proteins agrees largely with the findings of ALT gene expression analysis in that both ALT1 and ALT2 are highly expressed in the liver and muscle in the male rats. Striking difference in ALT isoenzyme expression is observed in the intestine where ALT1 is highly expressed in the small intestine and lower expression in the colon versus ALT2 where there is minimal expression in these tissues. The content of ALT1 is relatively higher than ALT2 in the heart and fat tissues whereas the converse is true in the brain. A similar pattern of tissue distribution at the mRNA and protein levels was observed in the female rats (data not shown) with the exceptions noted below.
Fig. 3.
Quantitative analysis of rat ALT isoenzyme tissue distribution. A. Representative Western Blot of ALT1 and ALT2 in male rats. 20 ug of tissue lysates were loaded to each lane. L: liver, M: muscle, B: brain, SI: small intestine, K: kidney, C: colon, H: heart, Bf: brown fat, Wf: white fat. The number indicates the amount of recombinant proteins of ALT1 and ALT2 respectively; 1: 0.1ng, 2: 0.5 ng, 3: 1.0 ng, 4: 3 ng, 5: 5 ng, 6: 8 ng, 7: 10 ng. B. Quantification of ALT isoenzyme tissue distribution in male rats. Grey column: ALT1; Black column: ALT2. Data are expressed as mean + S.E (n = 5 animals); *: p < 0.05; ***: p < 0.001, vs. ALT2 in the same tissue.
Sex-difference in ALT2 expression
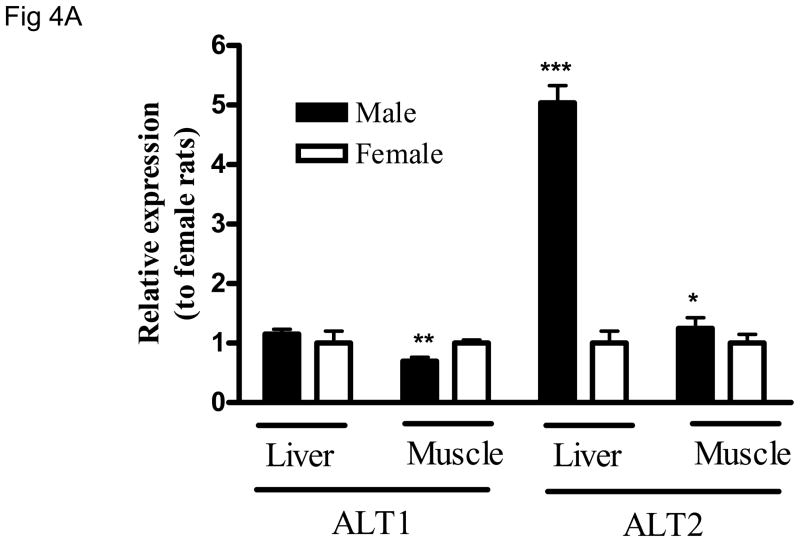
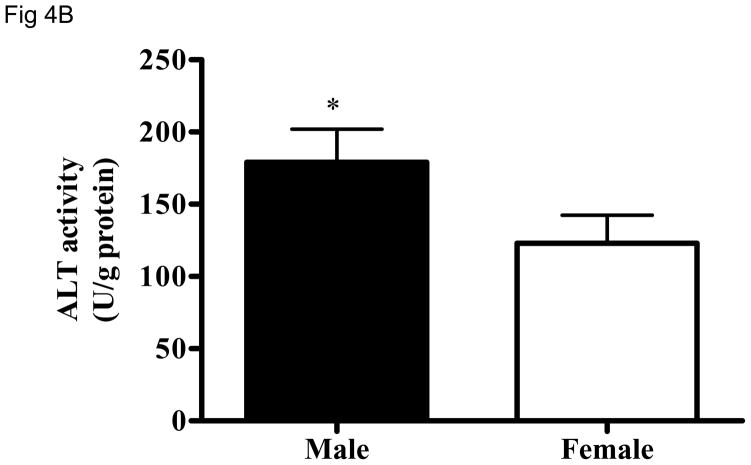
Gene expression analysis suggests a sex-dependent difference in ALT2 gene expression in the liver and muscle (Fig. 2). To examine whether the sex-dependent difference exists at the protein level, lysates of liver and muscle tissues from both sexes were analyzed for ALT1 and ALT2 on the same blot. As shown in Fig. 4A, ALT2 expression in male rats is about 4 fold and 20% higher in the liver and muscle, respectively, than female rats. Likewise, hepatic ALT activity is 30% higher in males than females (Figure 4B). No sex-dependent difference was seen in the liver for ALT1, but it appears 20% higher in muscle in females.
Fig. 4.
Sex-dependent difference of hepatic ALT2 expression. The protein expression of ALT1 and ALT2 in liver and muscle (4A), and total hepatic ALT activity (4B) between male and female rats. Data are expressed as mean + S.E. (n = 5 animals). *: p < 0.05; **: p < 0.01; ***: p < 0.001, relative to the female rat.
ALT2 is a mitochondrial protein
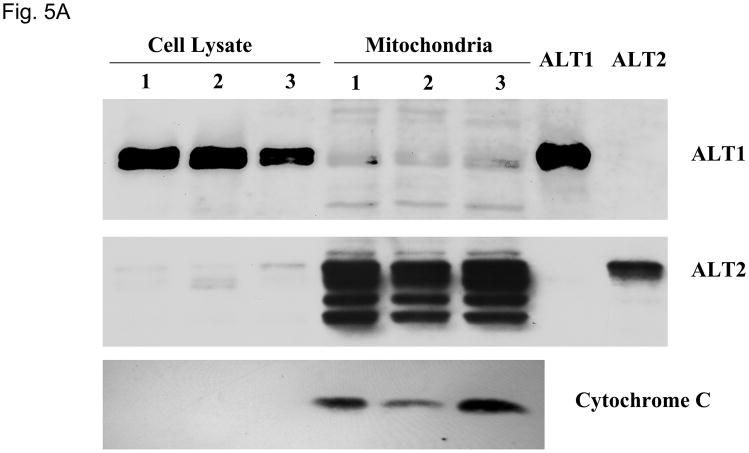
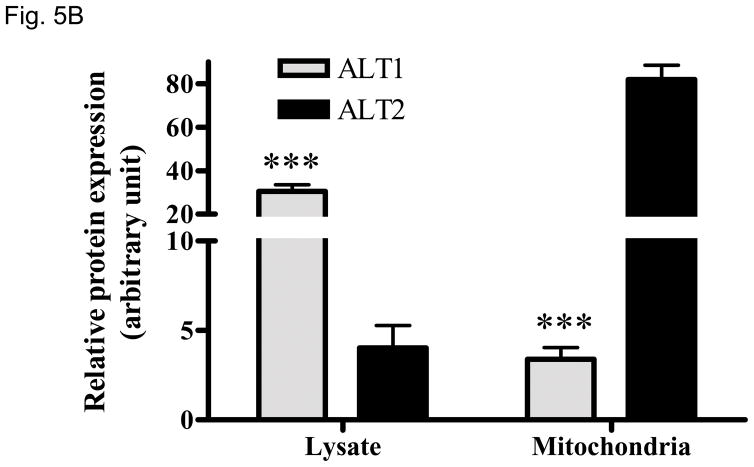
Peptide sequence comparison of ALT2 with ALT1 indicates that ALT2 contains an additional 28-amino acid sequence at the N-terminus (Fig. 1) which is likely a leader sequence of mitochondrial targeting (20) by bioinformatics analysis (data not shown). To determine the possible subcellular localization, we fractionated liver cell lysates into mitochondrial fractions and examined ALT1 and ALT2 content with Western blotting. As shown in Fig. 5, both ALT1 and ALT2 are present in lysate fractions. Impressively, ALT2 is enriched by about 20 fold but ALT1 is decreased by about 9 fold in the mitochondrial fraction. Detection of mitochondrial protein marker cytochrome C confirmed the enrichment of mitochondria. Multiple ALT2-staining bands may be a result of degradation of ALT2 during mitochondria purification. Nevertheless, this experiment confirmed our bioinformatics prediction that ALT2 is a mitochondrial protein.
Fig 5.
Relative ALT isoenzyme distributions in liver lysate and mitochondria. 10 ug of lysate or mitochondria isolated from three male rats, alone with 2 ng of recombinant ALT1 and ALT2 were loaded for Western analysis (5A) and quantitation (5B), blotted for ALT1, ALT2 and mitochondrial marker cytochome C respectively. Relative protein expression was determined by densitometer and expressed as mean + sem. ***: p < 0.001, compared to ALT2 in the same fraction.
Serum ALT1 and ALT2 protein levels are elevated in animals treated with CCl4 and APAP
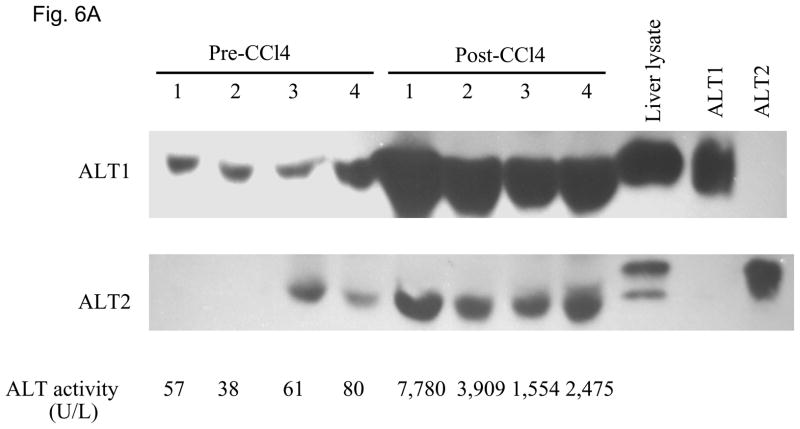
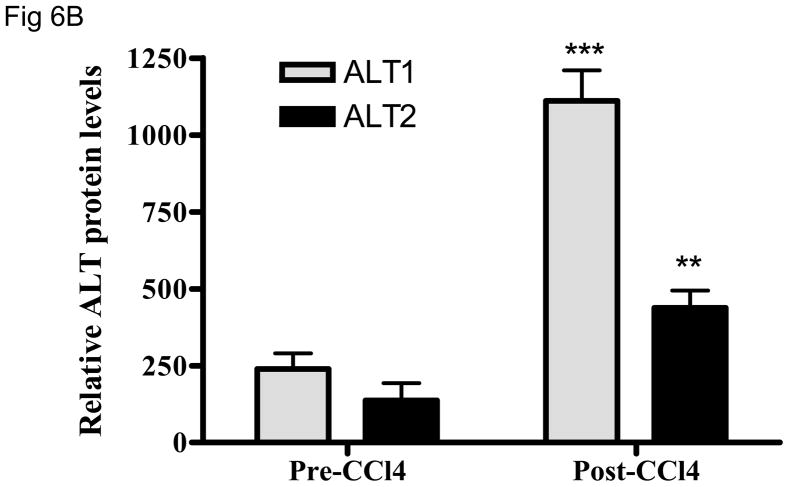
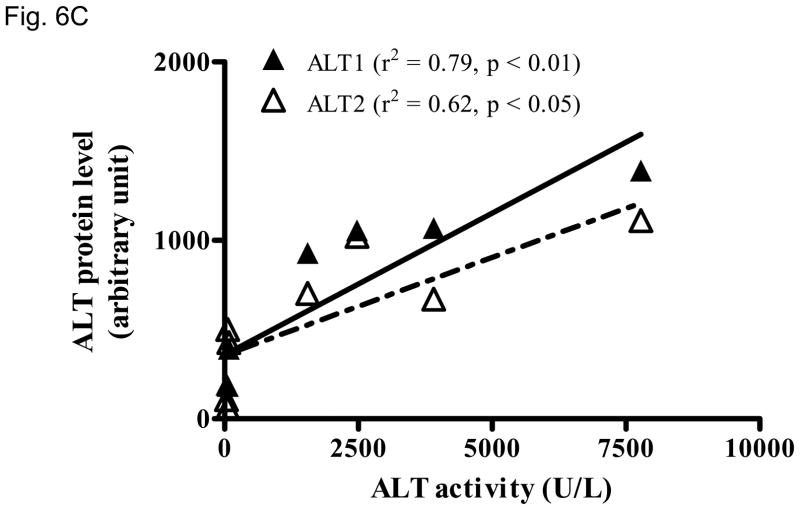
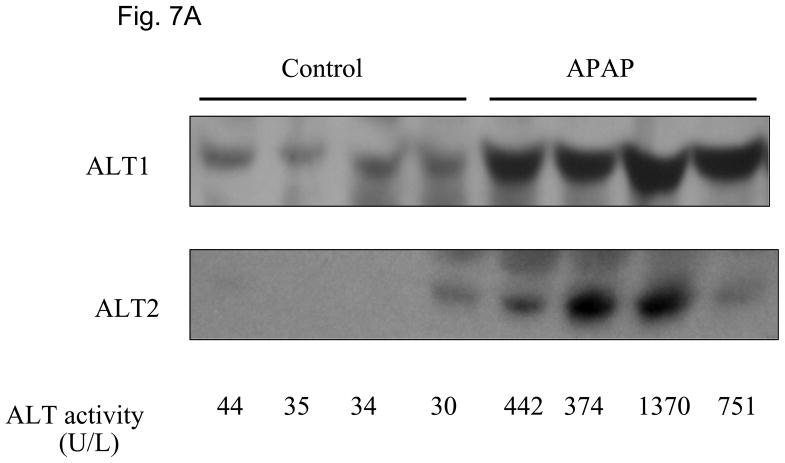
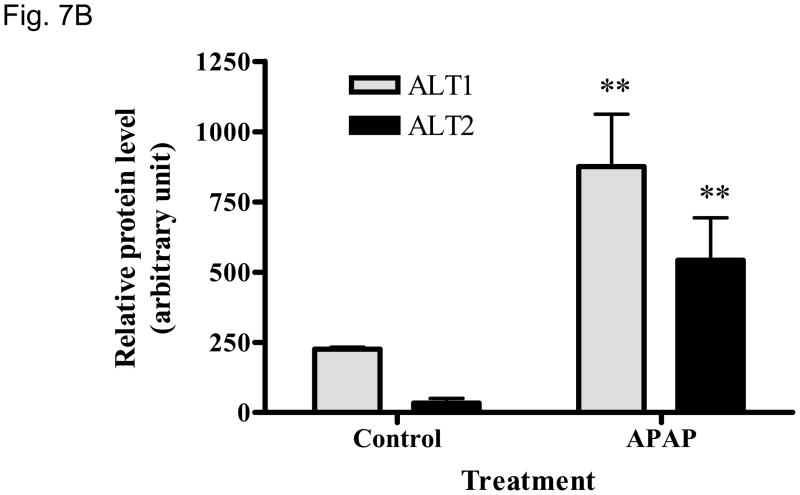
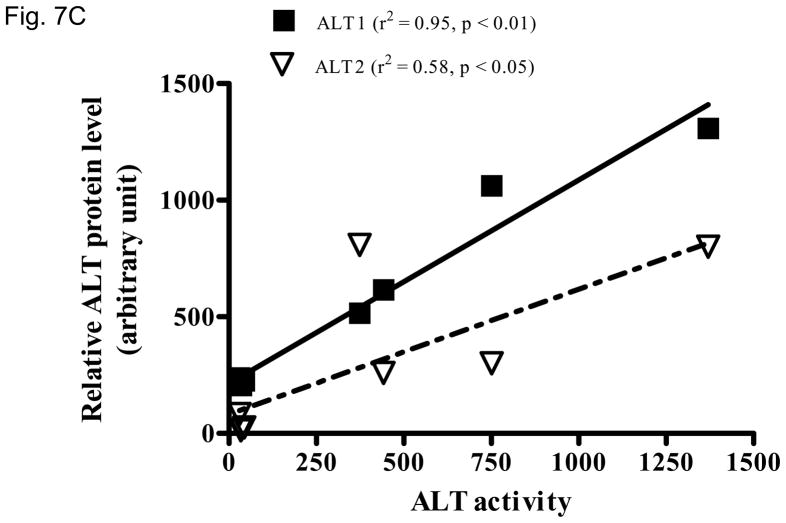
We then examined whether ALT proteins were present in the serum and if its level was increased in liver damage. As rat ALT1 and ALT2 share more than 97% of identity at the amino acid level, we predict that rat ALT polyclonal antibody will cross react with their mouse counterparts. As expected, CCl4-administration increased the serum ALT activity (Fig 6A) dramatically by 66-fold [post- vs. pre-CCl4: 3930 + 820 vs. 59 + 9 U/L (mean + S.E), p < 0.05]. ALT1 proteins were readily detectable in the sera of all untreated mice, whereas ALT2 was detected in 2 of the 4 untreated animals. Upon CCl4-treatment, ALT1 protein was significantly elevated by 4.8 fold and ALT2 by 3.9 fold based on densitometric analysis of the Western blot (Fig 6B). To extend the CCl4 finding in mice, we next examined the hepatoxicity of APAP in rats. Serum ALT activity was elevated by 20-fold (APAP vs control: 734.5 +227.2 vs. 35.8 +3, p < 0.05). Accordingly, relative serum ALT1 and ALT2 levels are increased by 3-and 15-fold, respectively (Fig. 7A & 7B). Linear regression analysis was carried out to examine whether serum ALT protein levels correlate its activity. In CCl4 study (Fig. 6C), total ALT activity is positively correlated with ALT1 (r2 = 0.79, p < 0.01) and ALT2 (r2 = 0.62, p < 0.05). Likewise, in APAP study (Fig. 7C), the activity is correlated with ALT1 (r2 = 0.95, p < 0.01) and ALT2 (r2 = 0.58, p < 0.05). Thus, serum total ALT activity is correlated with both ALT1 and ALT2 protein levels but it appears more correlated to serum ALT1 levels, and very low (barely detectable) ALT2 levels in control groups may have contributed to its lower correlation value. The molecular weights of serum ALT1 and ALT2 appear a little smaller (run faster) than that of liver lysate and recombinant proteins on the electrophoresis gel, which might be due to the serum ion strength, minor degradation/cleavage, or interference by albumin which is abundant in the serum with a molecular weight close to ALT. It is interesting to note that doublet bands of ALT2 are seen in the liver lysate, which may represent two ALT forms with or without mitochondrial targeting sequence. The serum ALT2 band appears corresponding to the smaller band, likely the mitochondrial leader-cleaved ALT2. In conclusion, this experiment demonstrated that both ALT1 and ALT2 are present in the serum of normal rodents and their levels are increased in liver damage and correlated with total ALT activity.
Fig. 6.
Elevation of serum ALT1 and ALT2 proteins in mice treated with carbon tetrachloride (CCl4). Four male mice were intraperitoneally injected with CCl4 (2 ml/kg). Sera were collected before (Pre-CCl4) and 24 hours after (Post-CCl4) the administration for Western analysis (6A). 2 ul of serum was electrophoresed with 20 ug of mouse liver lysates and 2 ng of recombinant rat ALT1 and ALT2 proteins. The serum ALT activity is listed below and corresponding to the Western lane for each sample. Relative protein levels are quantitated by densitometer (6B) and expressed as mean + sem (n = 4 per group, **: p < 0.01; ***: p < 0.001). Linear regression (C) indicates the correlation of total ALT activity with ALT1 and ALT2 protein levels (n = 8).
Fig. 7.
Elevation of serum ALT1 and ALT2 proteins in rats treated with acetaminophen (APAP). Sera were collected 48 hours from rats receiving APAP or vehicle control. 2 ul of serum was electrophoresed for Western analysis (7A). The serum ALT activity is listed below and corresponding to the Western lane for each sample. Relative protein levels are expressed as mean + sem ( 7B, n = 4 per group, **: p < 0.01 vs. control). Linear regression (C) indicates the correlation of total ALT activity with ALT1 and ALT2 protein levels (n = 8).
DISCUSSION
ALT has been extensively used as a marker for liver injury in clinical diagnostics. In this study, we cloned rat ALT1 and ALT2 cDNAs subsequent to the murine (16) and human (17) counterparts out of the consideration that the rat is frequently used for drug safety studies and has an advantage of larger blood volume and tissue mass than the mouse and thus can be more readily utilized for time course studies using model hepatotoxicants. The comparison of ALT1 and ALT2 protein sequences among the three species indicates that ALT1 and ALT2 are well conserved inter-species (>88% identity), but less conserved intra-species (~70% identity), suggesting a functional significance and deviation of each ALT isoenzyme evolutionally. Quantitative gene expression analysis indicated a differential tissue distribution of the isoenzymes in that ALT1 is more widely distributed than ALT2 and that the former is expressed in liver, muscle, digestive tract, adipose tissue, and heart tissue, whereas ALT2 is mainly restricted to the liver, muscle, brain and adipose tissue. This pattern of ALT isoform expression in the rat is similar to the distribution in the mouse (16) and human (17).
As tissue ALT content is more directly related to ALT enzymatic activity than the gene expression level, we generated ALT isoform-specific antibodies to determine the protein content in multiple tissues. Indeed, ALT1 and ALT2 protein contents are high in muscle and liver. However, small intestine expresses the highest amount of ALT1 among the tissues examined and there is significant expression in the colon as well. In contrast, there is nominal expression of ALT2 in intestinal tract tissues. In comparison, the expression of ALT2 protein is mainly in muscle and liver, and modestly in brain and white adipose tissue. The restricted expression of ALT2 raises a possibility that ALT2 may become a more specific serum marker for liver damage if muscle injury is excluded. ALT2 from brain is not expected to be released into the circulation due to the blood-brain barrier. Both ALT1 and ALT2 proteins are expressed in adipose tissues and whether the adipose ALTs contribute to serum ALT activity is worth further investigation.
Our detection of ALT protein in many tissues agrees with early biochemical study of ALT enzymatic activity in tissues. Boyd et al found that, in rats, the intestine (4.5 IU/g) has the highest activity levels second to the liver (24 IU/g) versus other tissues that have lower activity levels, heart (1.7 IU/g), muscle (2.8 IU/g), and, kidney (1.6 IU/g) (15). Intestinal ALT is thought to be important for gluconeogenesis (21). Whether the abundant expression of intestinal ALT1 is conserved between rats and humans and whether an intestinal injury will result in serum ALT elevation have not been studied. However, serum ALT elevation was observed in patients infected with rotavirus which preferentially infects the intestine without liver damage (22) and in patients with celiac disease (23–25). Thus, the possibility that intestine injury leads to serum ALT1 elevation exists.
Another interesting finding is the sex-dependent difference in rat hepatic ALT2 expression; males had significantly higher ALT2 expression than females. Similarly, we found that total hepatic ALT activity was higher in male than female rats, but the difference was not as great as at the protein level, which might be attributed to lower enzymatic activity and less stability of ALT2 than ALT1 (26). Whether the sex-difference of hepatic ALT2 expression is conserved in humans and contributes to a difference in serum ALT activity remains to be studied. However, numerous studies have reported higher serum ALT activity in men than women by 20–100% (27).
Cytosol and mitochondrial ALT activities were previously found in liver, kidney, and skeletal and cardiac muscles (28–30). Our bioinformatics analysis suggests that ALT2 contains a mitochondrial leader sequence (20) and suggests it may be a mitochondrial protein. Mitochondrial purification studies had revealed that ALT1 was lost but ALT2 was enriched during mitochondria purification, unequivocally demonstrating that ALT2 is a mitochondrial protein and ALT1 is a cytoplasmic protein. In an agreement with this finding, Meton et al (31) showed that the N-terminal 1–83 amino acids are required for green fluorescence protein-tagged fish ALT2 to target into mitochondria. The finding of differential subcellular localization of ALT isoenzymes may be useful to assess tissue damage at the subcellular level as well as metabolic adaptation. For example, an increased ALT2/ALT1 ratio may be indicative of a degree of the mitochondrial involvement. Recently, Diaz-Juarez et al reports that, during partial hepatectomy-induced liver regeneration in rats, liver mitochondrial proteins appear to be released predominantly into the serum with no evidence of hepatocellular necrosis (32). Thus, due to the distinctive liver lobule distribution (unpublished results) and subcellular localization of the each ALT isoenzyme, the ratio between the isoenzymes may have potential application in evaluating the extent and nature of liver damage or metabolic adaptation.
ALT activity has been measured in clinical chemistry and its elevation is regarded as a sign of liver damage. However, the molecular basis for the elevation of serum ALT activity has not been identified. Using isoform-specific antibodies, we have been able to assess serum ALT protein changes in rodents treated with CCl4 and APAP, two most-used hepatoxicants. As expected, serum ALT activity was elevated by 66-fold by CCl4. Accordingly, both ALT1 and ALT2 were increased by 4.8- and 3.9-fold respectively. APAP treatment increased serum ALT activity by 21-fold, ALT1 protein by 4-fold and ALT2 protein by 16-fold, respectively. The extent of the serum protein increase is less than that of the activity. One explanation for this discrepancy is that the protein quantification by Western is semi-quantitative and another possible explanation is that part of serum ALTs were inactive after being released into serum and the activity might reflect the freshly-released ALT protein. Further correlation analysis shows that the amount of ALT1 and ALT2 proteins were correlated with the serum activity in the animals treated with CCl4 and APAP, indicating that both isoenzymes may contribute to the elevated activity in the serum. Nevertheless, ALT1 protein levels are more correlated with ALT activity than ALT2, suggesting that ALT1 is likely to contribute more to the serum ALT activity. On an additional note, ALT1 appeared to be a major ALT protein in the serum as it was readily detectable in mice and rats, whereas ALT2 was low and barely detectable under normal conditions (Fig. 6 and 7). This finding agrees with the recent study where immuno-depletion of ALT1 decreases majority of the serum ALT activity in healthy humans (33). Based on our tissue distribution and cell fractionation studies, ALT1 is anticipated to contribute more to “basal” serum ALT activity since it is more widely expressed in tissues and localized in cytoplasm. Normal cell turnover in liver and other tissues would release ALT1 into the circulation. Moreover, as a cytoplasmic protein, ALT1 is relatively easier to “leak” out of the cell than mitochondrial ALT2. In this regard, elevation of ALT2 in serum in conjunctions with ALT1 elevation may be a better indicator of “true” liver damage with mitochondria involvement. On the other hand, the current enzyme activity assay may have been optimized for measuring ALT1 activity because it is the prevailing ALT in the serum. It should be noted that serum ALT activity levels do not necessarily reflect the severity of liver damage. For example, a significant portion of hepatitis C patients with liver damage show persistently normal ALT levels (9, 10) and serum ALT levels are found not to be correlated with histologic severity of liver damage in patients with non-alcoholic fatty liver disease (34). Whether ALT1 and/or ALT2 protein levels are elevated in these conditions is worth investigating, as it is possible that ALT activity may subside relatively faster than the proteins in the circulation (26).
In summary, we have examined the difference of ALT isoenzymes in tissue and subcellular distributions and between genders in rats, providing essential basics for the future understanding of serum ALT changes in liver vs. non-liver injuries or normal vs. disease conditions. Importantly, we have shown for the first time that serum ALT1 and ALT2 proteins are elevated in liver damage induced by typical hepatoxicants CCl4 and APAP in animal models. Whether ALT isoenzyme-specific assays will have more diagnostic value than currentlybeing used total ALT activity in determining the nature and extent of liver or non-liver injuries is under investigation by examining the relationship between the dynamics of serum ALTs with pathological changes of the liver in a variety of disease conditions.
Acknowledgments
We thank David Amacher for initiating this collaboration, Hong Hu and Linda Nelms for technical assistance and to Joseph D. Jamieson for isolation of mitochondria. RY is a liver scholar of the American Association for the Study of Liver Diseases. The study was partially supported by grants of Maryland Clinical Nutrition Research Unit (DK072488) and the Baltimore Diabetes Research and Training Center from the National Institutes of Health and a grant from Pfizer Inc.
Abbreviations
- ALT
alanine aminotransferase
- APAP
acetaminophen
- CCl4
carbon tetrachloride
- qRT-PCR
quantitative real-time PCR
References
- 1.Ruhl CE, Everhart JE. Relation of elevated serum alanine aminotransferase activity with iron and antioxidant levels in the United States. Gastroenterology. 2003;124:1821–1829. doi: 10.1016/s0016-5085(03)00395-0. [DOI] [PubMed] [Google Scholar]
- 2.Lozano M, Cid J, Bedini JL, Mazzara R, Gimenez N, Mas E, Ballesta A, et al. Study of serum alanine-aminotransferase levels in blood donors in Spain. Haematologica. 1998;83:237–239. [PubMed] [Google Scholar]
- 3.Johnston DE. Special considerations in interpreting liver function tests. Am Fam Physician. 1999;59:2223–2230. [PubMed] [Google Scholar]
- 4.Saxena S, Korula J, Shulman IA. A review of donor alanine aminotransferase testing. Implications for the blood donor and practitioner. Arch Pathol Lab Med. 1989;113:767–771. [PubMed] [Google Scholar]
- 5.Giboney PT. Mildly elevated liver transaminase levels in the asymptomatic patient. Am Fam Physician. 2005;71:1105–1110. [PubMed] [Google Scholar]
- 6.Chen CH, Huang MH, Yang JC, Nien CK, Yang CC, Yeh YH, Yueh SK. Prevalence and etiology of elevated serum alanine aminotransferase level in an adult population in Taiwan. J Gastroenterol Hepatol. 2007;22:1482–1489. doi: 10.1111/j.1440-1746.2006.04615.x. [DOI] [PubMed] [Google Scholar]
- 7.Clark JM, Brancati FL, Diehl AM. The prevalence and etiology of elevated aminotransferase levels in the United States. Am J Gastroenterol. 2003;98:960–967. doi: 10.1111/j.1572-0241.2003.07486.x. [DOI] [PubMed] [Google Scholar]
- 8.Browning JD, Szczepaniak LS, Dobbins R, Nuremberg P, Horton JD, Cohen JC, Grundy SM, et al. Prevalence of hepatic steatosis in an urban population in the United States: impact of ethnicity. Hepatology. 2004;40:1387–1395. doi: 10.1002/hep.20466. [DOI] [PubMed] [Google Scholar]
- 9.Bacon BR. Treatment of patients with hepatitis C and normal serum aminotransferase levels. Hepatology. 2002;36:S179–184. doi: 10.1053/jhep.2002.36386. [DOI] [PubMed] [Google Scholar]
- 10.Marcellin P, Levy S, Erlinger S. Therapy of hepatitis C: patients with normal aminotransferase levels. Hepatology. 1997;26:133S–136S. doi: 10.1002/hep.510260723. [DOI] [PubMed] [Google Scholar]
- 11.Ozer J, Ratner M, Shaw M, Bailey W, Schomaker S. The current state of serum biomarkers of hepatotoxicity. Toxicology. 2008;245:194–205. doi: 10.1016/j.tox.2007.11.021. [DOI] [PubMed] [Google Scholar]
- 12.Dufour DR, Lott JA, Nolte FS, Gretch DR, Koff RS, Seeff LB. Diagnosis and monitoring of hepatic injury. II. Recommendations for use of laboratory tests in screening, diagnosis, and monitoring [In Process Citation] Clin Chem. 2000;46:2050–2068. doi: 10.1093/clinchem/46.12.2050. [DOI] [PMC free article] [PubMed] [Google Scholar]
- 13.Dufour DR, Lott JA, Nolte FS, Gretch DR, Koff RS, Seeff LB. Diagnosis and monitoring of hepatic injury. I. Performance characteristics of laboratory tests [In Process Citation] Clin Chem. 2000;46:2027–2049. [PubMed] [Google Scholar]
- 14.Sherman KE. Alanine aminotransferase in clinical practice. A review [see comments] Arch Intern Med. 1991;151:260–265. [PubMed] [Google Scholar]
- 15.Boyd JW. The mechanisms relating to increases in plasma enzymes and isoenzymes in diseases of animals. Vet Clin Pathol. 1983;12:9–24. doi: 10.1111/j.1939-165x.1983.tb00609.x. [DOI] [PubMed] [Google Scholar]
- 16.Jadhao SB, Yang RZ, Lin Q, Hu H, Anania FA, Shuldiner AR, Gong DW. Murine alanine aminotransferase: cDNA cloning, functional expression, and differential gene regulation in mouse fatty liver. Hepatology. 2004;39:1297–1302. doi: 10.1002/hep.20182. [DOI] [PubMed] [Google Scholar]
- 17.Yang RZ, Blaileanu G, Hansen BC, Shuldiner AR, Gong DW. cDNA cloning, genomic structure, chromosomal mapping, and functional expression of a novel human alanine aminotransferase. Genomics. 2002;79:445–450. doi: 10.1006/geno.2002.6722. [DOI] [PubMed] [Google Scholar]
- 18.Sohocki MM, Sullivan LS, Harrison WR, Sodergren EJ, Elder FF, Weinstock G, Tanase S, et al. Human glutamate pyruvate transaminase (GPT): localization to 8q24.3, cDNA and genomic sequences, and polymorphic sites. Genomics. 1997;40:247–252. doi: 10.1006/geno.1996.4604. [DOI] [PubMed] [Google Scholar]
- 19.Olson H, Betton G, Robinson D, Thomas K, Monro A, Kolaja G, Lilly P, et al. Concordance of the toxicity of pharmaceuticals in humans and in animals. Regul Toxicol Pharmacol. 2000;32:56–67. doi: 10.1006/rtph.2000.1399. [DOI] [PubMed] [Google Scholar]
- 20.Habib SJ, Neupert W, Rapaport D. Analysis and prediction of mitochondrial targeting signals. Methods Cell Biol. 2007;80:761–781. doi: 10.1016/S0091-679X(06)80035-X. [DOI] [PubMed] [Google Scholar]
- 21.Mithieux G. New data and concepts on glutamine and glucose metabolism in the gut. Curr Opin Clin Nutr Metab Care. 2001;4:267–271. doi: 10.1097/00075197-200107000-00004. [DOI] [PubMed] [Google Scholar]
- 22.Teitelbaum JE, Daghistani R. Rotavirus Causes Hepatic Transaminase Elevation. Dig Dis Sci. 2007;52:3396–3398. doi: 10.1007/s10620-007-9743-2. [DOI] [PubMed] [Google Scholar]
- 23.Novacek G, Miehsler W, Wrba F, Ferenci P, Penner E, Vogelsang H. Prevalence and clinical importance of hypertransaminasaemia in coeliac disease. Eur J Gastroenterol Hepatol. 1999;11:283–288. doi: 10.1097/00042737-199903000-00012. [DOI] [PubMed] [Google Scholar]
- 24.Bardella MT, Fraquelli M, Quatrini M, Molteni N, Bianchi P, Conte D. Prevalence of hypertransaminasemia in adult celiac patients and effect of gluten-free diet. Hepatology. 1995;22:833–836. [PubMed] [Google Scholar]
- 25.Farre C, Esteve M, Curcoy A, Cabre E, Arranz E, Amat LL, Garcia-Tornel S. Hypertransaminasemia in pediatric celiac disease patients and its prevalence as a diagnostic clue. Am J Gastroenterol. 2002;97:3176–3181. doi: 10.1111/j.1572-0241.2002.07127.x. [DOI] [PubMed] [Google Scholar]
- 26.Liu L, Zhong S, Yang RZ, Hu H, Yu D, Zhu D, Hua Z, et al. Expression, purification, and initial characterization of human alanine transaminase (ALT) isoenzyme 1 and 2 in High-five insect cells. Protein Expr Purif. 2008 doi: 10.1016/j.pep.2008.04.006. in press. [DOI] [PMC free article] [PubMed] [Google Scholar]
- 27.Grossi E, Colombo R, Cavuto S, Franzini C. Age and gender relationships of serum alanine aminotransferase values in healthy subjects. Am J Gastroenterol. 2006;101:1675–1676. doi: 10.1111/j.1572-0241.2006.00627_6.x. [DOI] [PubMed] [Google Scholar]
- 28.Ziegenbein R. Two different forms of glutamic pyruvic transaminase in rat heart and their intracellular localization. Nature. 1966;212:935. [PubMed] [Google Scholar]
- 29.Gubern G, Imperial S, Busquets M, Cortes A. Partial characterization of the alanine aminotransferase isoenzymes from human liver. Biochem Soc Trans. 1990;18:1288–1289. doi: 10.1042/bst0181288. [DOI] [PubMed] [Google Scholar]
- 30.Sakagishi Y. [Alanine aminotransferase (ALT)] Nippon Rinsho. 1995;53:1146–1150. [PubMed] [Google Scholar]
- 31.Meton I, Egea M, Fernandez F, Eraso MC, Baanante IV. The N-terminal sequence directs import of mitochondrial alanine aminotransferase into mitochondria. FEBS Lett. 2004;566:251–254. doi: 10.1016/j.febslet.2004.04.051. [DOI] [PubMed] [Google Scholar]
- 32.Diaz-Juarez J, Rivera-Valerdi L, Bernal-Cerrillo DE, Hernandez-Munoz R. Predominance of released mitochondrial enzymes by partial hepatectomy-induced rat regenerating liver is controlled by hemodynamic changes and not related to mitochondrial damage. Scand J Gastroenterol. 2006;41:223–233. doi: 10.1080/00365520510024142. [DOI] [PubMed] [Google Scholar]
- 33.Lindblom P, Rafter I, Copley C, Andersson U, Hedberg JJ, Berg AL, Samuelsson A, et al. Isoforms of alanine aminotransferases in human tissues and serum--differential tissue expression using novel antibodies. Arch Biochem Biophys. 2007;466:66–77. doi: 10.1016/j.abb.2007.07.023. [DOI] [PubMed] [Google Scholar]
- 34.Mofrad P, Contos MJ, Haque M, Sargeant C, Fisher RA, Luketic VA, Sterling RK, et al. Clinical and histologic spectrum of nonalcoholic fatty liver disease associated with normal ALT values. Hepatology. 2003;37:1286–1292. doi: 10.1053/jhep.2003.50229. [DOI] [PubMed] [Google Scholar]
- 35.Corpet F. Multiple sequence alignment with hierarchical clustering. Nucleic Acids Res. 1988;16:10881–10890. doi: 10.1093/nar/16.22.10881. [DOI] [PMC free article] [PubMed] [Google Scholar]


