Abstract
The dielectrophoretic behavior of active, dead, and dormant Mycobacterium smegmatis bacterial cells was studied. It was found that the 72-h-old dormant cells had a much higher effective particle conductivity (812±10 μS cm−1), almost double that of active cells (560±20 μS cm−1), while that of dead (autoclaved) M. smegmatis cells was the highest (950±15 μS cm−1) overall. It was also found that at 80 kHz, 900 μS cm−1 dead cells were attracted at the edges of interdigitated castellated electrodes by positive dielectrophoresis, but dormant cells were not. Similarly, at 120 kHz, 2 μS cm−1 active cells were attracted and dormant cells were not. Using these findings a dielectrophoresis-based microfluidic separation system was developed in which dead and active cells were collected from a given cell suspension, while dormant cells were eluted.
INTRODUCTION
Many micro-organisms are able to convert to a dormant state under adverse environmental conditions. When conditions improve such cells are not always able to resume growth again, forming a viable-but-not-culturable (VBNC) state.1, 2, 3 Only under very specific conditions can these cells then be made to resuscitate.1, 4 The separation of culturable and dormant bacterial cells is of great interest for the researchers of VBNC cells as the resuscitation conditions in most cases do not only encourage dormant cells to regain their culturability but also support normal cell growth. It is therefore crucial to eliminate any active cells from the dormant culture before carrying out the resuscitation procedure as the presence of only a few culturable cells in a VBNC cell suspension of interest could give false resuscitation results.5 In the past, many techniques have been employed to prepare, isolate, and study bacterial cells that are viable but unable to multiply.1, 2, 3, 6, 7 Unfortunately, many of these techniques are time consuming and labor intensive, and it is therefore necessary to look for rapid techniques for the separation of dormant from nondormant cells.
Dielectrophoresis (DEP) is the movement of particles in nonuniform ac or dc electric fields. The first DEP separations of cells were attempted by Pohl8 almost 50 years ago. Since then a myriad of DEP-based techniques have been developed, which offer simple, quick, and cheap methods of cell manipulation, characterization, and separation.9, 10 Dielectrophoretic separation techniques have been used for the separation of bacterial, yeast, animal, and plant cells of different species, strains, and physiological states.9, 10 As dielectrophoretic methods are capable of distinguishing between cells of different physiological states in very short time scales (seconds to minutes), it would be useful to assess its ability to distinguish between dormant and nondormant cells.
Our investigations will concentrate on the dielectrophoretic separation of dormant Mycobacterium smegmatis from active and dead M. smegmatis. M. smegmatis has been extensively used as a nonpathogenic relative of Mycobacterium tuberculosis. M. tuberculosis has the ability to remain in a dormant state for prolonged periods, making effective diagnosis and treatment more difficult.11 Mycobacterial cells at different physiological states have distinct morphological features including differences in cell size, the structure of cell walls, and the permeability of cell membranes.4, 12, 13, 14 Such differences in the cell morphology, structure, and composition can be expected to lead to differences in cell electrical polarizabilities15 and hence, their effective particle conductivities, which could form the basis for their dielectrophoretic separation.
MATERIALS AND METHODS
Cell culture
Mycobacterium smegmatis strain mc2155 was maintained on nutrient agar plates at 5–7 °C. To obtain active cells M. smegmatis cells were cultured12, 13, 14, 15, 16 in 100 ml glass flasks with loose caps for 24 h at 37 °C on an orbital incubator shaker at 200 rpm in 20 ml of the rich medium nutrient broth E LabM, supplemented with 0.05 % (v∕v) Tween-80. To obtain dead M. smegmatis cells, a 24-h-old active culture was autoclaved at 126 °C for 30 min. To obtain dormant M. smegmatis cells, 330 μl active bacterial culture was subcultured in 50 ml modified Hartman’s-de Bont (mHdeB) medium supplemented with 0.5% albumin bovine serum (filtered with 0.22 μm pore size, Millex™) for 72 h at 37 °C on an orbital incubator shaker at 200 rpm in 250 ml glass flasks. Per liter mHdeB contains 6.7 g Na2HPO4, 1.1 g citric acid, 20 g (NH4)2SO4, 30 ml glycerol, 10 ml 5% (v∕v) Tween-80, 5 ml of trace elements solution N1, and 5 ml of trace elements solution N2. Per liter trace elements solution N1 contains 1 g EDTA, 9.3 g MgCl2, 0.2 g CaCl2⋅2H2O, and 1 g FeSO4⋅7H2O. Per liter trace element solution N2 contains 1 g EDTA, 0.08 g CoCl2⋅6H2O, 0.25 g MnCl2⋅4H2O, 0.04 g Na2MoO4⋅2H2O, 0.4 g ZnSO4⋅7H2O, and 0.04 g CuSO4⋅5H2O. Trace element solutions N1 and N2 were prepared separately and salts were added in the order given to 1 l distilled water. A small amount of 1M NaOH solution was added, if necessary, to trace element solutions N1 and N2 to adjust the pH to 7.0–7.5.
Each population of cells was harvested and washed with a 0.5M sorbitol solution with 0.05% (v∕v) Tween-80 as a supplement to reduce the formation of cell clumps. Washing was done at least four times by repeated centrifugation for 3 min at 10 000 rpm. After each centrifugation the supernatant was decanted and replaced with fresh 0.5M sorbitol solution until a low and stable value of medium conductivity was reached. Suspensions with different relative amounts of M. smegmatis cells of different physiological states were made by mixing.
Measurement of the bacterial particle conductivity
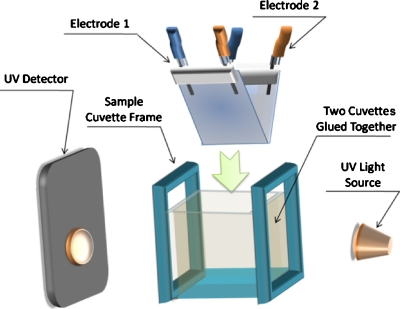
To measure the particle conductivity a chamber was used, as shown in Fig. 1, which was based on a design by Talary and Pethig.17 The chamber was constructed from two slides with microelectrodes of the interdigitated oppositely castellated design with characteristic sizes of 30 μm. Standard friction locker heads with extended metal fingers (RS components, U.K.) were used to make connections with the microelectrodes. The microelectrode slides were glued vertically at an angle facing each other inside an optical chamber made from two 1 cm plastic cuvettes. A UV light beam (450 nm) traveled through the space between the two slides to the light sensor. The system is preferable over systems in which the light travels through the electrodes themselves,18, 19 as it makes the measurement less dependent on the redistribution of the cells on the electrode surface and enables the measurement of negative as well as positive dielectrophoretic forces.
Figure 1.
Schematic drawing of the system used for the measurement of the dielectrophoretic properties of bacterial cells. The UV light (450 nm) was shone between the two slides which were covered with ITO microelectrodes. Any changes in the optical absorbance in a cell suspension by DEP after the generation of nonuniform electric fields at the microelectrodes could be picked up by the UV detector.
To determine the bacterial particle conductivity, active, dormant, or autoclaved dead M. smegmatis cell suspensions were injected into the space between the two electrodes with an initial optical density reading of around 0.8. An electric field of 80 kHz, 20 Vp.p. was applied, and the rate of decline of the optical absorbance was measured for 3 min with the help of a potentiometric recorder. As shown previously,19, 20 for a given electrode structure and applied voltage and frequency, the rate of decrease in the optical absorbance ΔA can be used as a measure for the average rate at which cells travel from the suspension to the electrode surface, which in turn is proportional to the strength of the DEP force. As the DEP force is proportional to the Clausius–Mossotti factor, this relation can be expressed as
| (1) |
where k is a constant. is the medium conductivity, which is relatively independent of the frequency. is the frequency-dependent overall complex particle conductivity of the cells. Its value is dependent on the cell shape, the structures of which the cell consists and their composition.20 Although the cells used in our studies are mainly rod shaped, for simplicity we have used the equation for an equivalent sphere; more advanced models for other cell shapes can be found in literature (e.g., Ref. 21). At low frequencies the cell interior is shielded from the electric field by the insulating cell membrane, and the particle conductivity is dominated by the properties of the cell wall. Between 10 and 100 kHz, a plateau region occurs in the dielectrophoretic response. To a good approximation, the complex particle conductivity can also be regarded as frequency independent.22 The equation then becomes
| (2) |
Rearrangement of Eq. 2 gives
| (3) |
A plot of σm as a function of ([k−ΔA]∕[2ΔA+k]) gives a straight line with a slope σp. The value of k can be determined when σm is equal to zero, as then k=ΔA.
Construction of the separation chambers
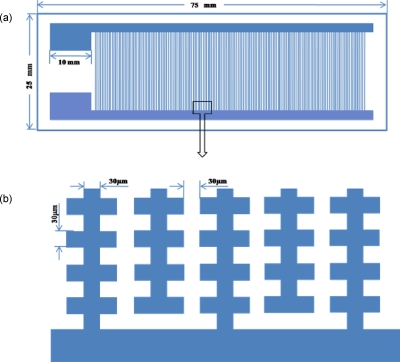
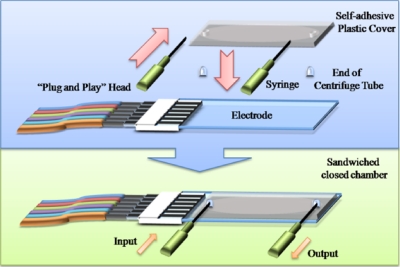
For the separation of mixtures of cells, electrodes were used with a characteristic size of 30 μm, as shown in Fig. 2. Self-adhesive plastic covers from Sigma (Hybri-well Press-seal hybridization chambers 21×41×0.15 mm3) were used to create a chamber above the electrodes with a height of 150 μm, with two 2 mm diameter holes as fluid input and output points at each end of the chamber. Two 0.65 ml microcentrifuge tube (Coaster) bottoms were cut off, pierced with syringe needles (diameter 1 mm), and used as the connections for the input and output tubes, as shown in Fig. 3. The chambers were then finally glued together using two-component glue (RS components, U.K.). Several chambers could be connected in series to construct a multistep separation system.
Figure 2.
Schematics of interdigitated oppositely castellated microelectrodes. (a) Overall design; (b) close-up of microelectrode design.
Figure 3.
Construction of a DEP separation chamber. Electrodes were made from ITO-covered microscope slides using pholitography; chambers were made from Hybri-well Press-seal hybridization chambers.
Separation of dormant and active and dormant and dead M. smegmatis
For investigations into the separation of dormant and active M. smegmatis cells, a 1:1 mixture of washed active and dormant cells was made in 0.5M 2 μS cm−1 sorbitol medium. Around 200 μl of the resulting suspension was injected into the separation chamber. An electric field was generated between the electrodes by applying a set to 120 kHz, 20 Vp.p. signal to the electrodes using a Thurlby Thanby TG120 frequency generator. The cells were allowed to settle inside the chamber and be attracted to the electrodes for 2–3 min before fresh fluid was pumped into the chamber. After the dormant population of cells (which were not strongly attracted) was fully removed from the separation chamber by the medium flow, the applied electric field was removed and active cells that were more strongly attracted were flushed out and collected in a separate container.
For the separation of dormant and dead M. smegmatis cells a similar procedure was used, but the medium conductivity was increased to 900 μS cm−1 by the addition of NaCl, and electric signal of 80 kHz, 20 Vp.p. was applied to the electrodes for the separation of the cells. Under these conditions dead cells showed positive DEP and were retained at the electrodes, while dormant cells showed negative DEP and were easily flushed out from the chamber.
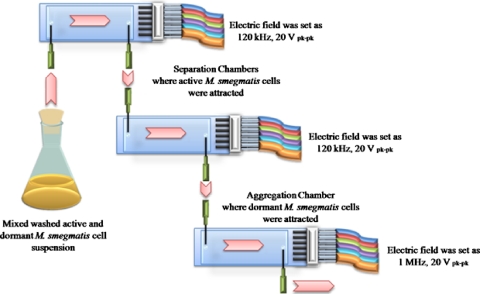
For resuscitation studies of dormant M. smegmatis, it is necessary to remove all active cells from a suspension of dormant cells. A separation system, as shown in Fig. 4, was developed to do this. The system consisted of two separation chambers and one collection chamber in series. A suspension containing both dormant and active cells (total concentration of approximately 1×10⁸ cells ml−1) in 0.5M sorbitol solution (conductivity of 2 μS cm−1) was introduced in a continuous flow of 10 μl min−1 into the chamber, and an electric signal of 120 kHz, 20 Vp.p. was applied to the two separation chambers. Active M. smegmatis cells experienced a positive DEP force under these conditions, and were attracted to the high electric field regions at the electrodes. Dormant M. smegmatis cells under these conditions also showed positive DEP, but were not sufficiently strongly attracted to be kept at high field regions near the electrodes, and eluted from the chamber. Dormant cells were collected in the last chamber, which was energized by a 1 MHz, 20 Vp.p. signal. After 2–3 h, to collect the dormant cells, the electric signal to the third collection chamber was turned to zero, while the electric signal to the first two separation chambers was maintained.
Figure 4.
Outline of the system used for the removal of active M. smegmatis cells from dormant M. smegmatis cells by DEP. The system consisted of two DEP separation chambers with interdigitated castellated microelectrodes (characteristic size of 30 μm) in series in which active cells could be collected from s mixed suspension by applying a 120 kHz, 20 Vp.p. electric field. In series with these was a chamber of similar construction for collecting dormant cells in which a 1 MHz, 20 Vp.p. was applied to the electrodes. The medium conductivity was 2 μS cm−1 and the flow rate was 10 μl min−1.
Cell identification
To be able to identify active, dormant, and dead M. smegmatis cells in a mixed cell suspension during and after separation, cells of different physiological states were stained with different fluorescent dyes. Active cells were stained by incubating them at 37 °C for 30 min with 5-cyano-2,3-ditolyltetrazolium chloride23 (CTC) at a final concentration of 4 mM in 1M glucose. Autoclaved dead cells were stained23 with propidium iodide (PI) with a final concentration of 0.3 μM in phosphate buffer for 2–5 min. An E600 Nikon fluorescence microscope and a Nikon Coolpix 4500 digital camera were used to monitor the fluorescence. CTC had an excitation range of 530–550 nm, emission of ≥580 nm, PI emission range of 510–560 nm, and emission of 590–650 nm. Both stains therefore fluoresced red. Dormant cells could not be stained with either CTC or PI.
RESULTS
Measurement of the bacterial particle conductivity
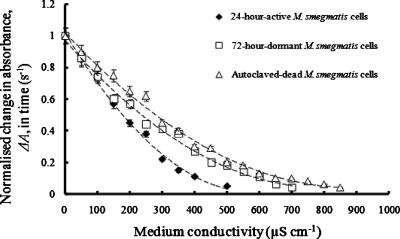
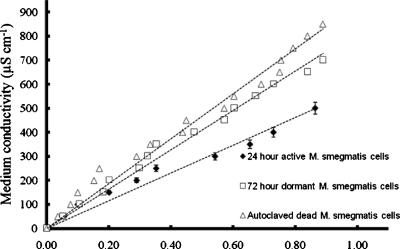
The effective particle conductivity of M. smegmatis cells was determined by measuring the rate of the decrease in the optical absorbance, ΔA, as a function of the suspending medium conductivity using the two-electrode optical chamber. Figure 5 shows the net rate of change in the dielectrophoretically induced optical absorbance, ΔA, at 450 nm, of 24-h-old active, 72-h-old dormant and autoclaved M. smegmatis cells as a function of the suspending medium conductivity. The applied electric field signal was 80 kHz, 20 Vp.p.. A plot of the medium conductivity as a function of ([k−ΔA]∕[2ΔA+k]) is shown in Fig. 6. From the slope of the graphs in Fig. 6, the effective particle conductivities were determined to be 560±20, 812±10, and 950±15 μS cm−1 for active, dormant, and dead M. smegmatis cells, respectively.
Figure 5.
The net rate of change in the dielectrophoretically induced optical absorbance, ΔA, at 450 nm, of 24-h-old active, 72-h-old dormant, and autoclaved dead M. smegmatis cells as a function of the suspending medium conductivity. The applied signal was 80 kHz, 20 Vp.p..
Figure 6.
Plot of the medium conductivity σm as a function of ([k−ΔA]∕[2ΔA+k]) to determine the particle conductivity σp of 24-h-old active, 72-h-old dormant, and autoclaved dead M. smegmatis cells. The applied electrical signal was 80 kHz, 20 Vp.p..
Separation
The previous results showed that significant differences existed in the effective particle conductivities of M. smegmatis cells of different physiological states. This suggested that it may be possible to separate the cells from each other using DEP-based methods.
First, individual samples of washed M. smegmatis cells of different physiological states (active, dead, and dormant) were prepared, and the cells were suspended in 0.5M sorbitol solution with different medium conductivities. The dielectrophoretic responses of the samples of the different cell types were investigated at microelectrodes of 30 μm characteristic size at constant voltage (20 Vp.p.) and different frequencies and medium conductivities. In addition to this, the flow rate needed to remove cells from the electrodes was investigated.
The exploratory experiments on pure samples of dead, dormant, and active cells showed two major effects. First, for individual samples of pure active, dead, and dormant cells, the cells distributed themselves unevenly over the electrodes. Second, when comparing the flow rate needed to remove active, dead, or dormant cells from the electrode arrays, it was quite clear that under most condition, the force holding dormant cells was much smaller than the force holding active cells. The force holding dead cells was intermediate. The fact that the DEP force on dormant cells is much smaller than on active (or dead) cells is arguably caused by the fact that dormant cells are rounder and smaller (about half the size) than active cells.
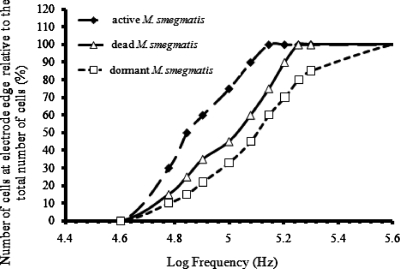
To quantify the nonuniform distribution of cells over the electrodes, different areas in a cell array were selected randomly. The number of cells attracted to the tips of the electrodes within the view was counted manually and divided by the total number of cells in the view. The total number of cells counted each time was at least 200. Results are shown in Fig. 7 for a medium conductivity of 2 μS cm−1. Significant differences can be seen in the dielectrophoretic behavior of active, dead, and dormant cells. At 120 kHz, 20 Vp.p., the largest proportion of active cells appeared to be attracted to the tips of the electrodes by positive DEP. The dormant cells, however, were mainly in areas on top of the electrodes at this frequency. Further experiments therefore concentrated on this frequency.
Figure 7.
The dielectrophoretic response of M. smegmatis cells of different physiological states as a function of the applied frequency of the electric field.
When a signal of 120 kHz, 20 Vp.p. was applied to the electrodes at the lowest medium conductivity used—2 μS cm−1—dormant cells could already be removed from the electrodes at flow rates as low as 3.5 μl min−1. Over 90% of dormant cells were removed from the electrodes within 5 min at a flow rate of 10 μl min−1. At the other extreme, under the same conditions, removal of active cells was insignificant until the flow rates reached values in the order of 170 μl min−1.
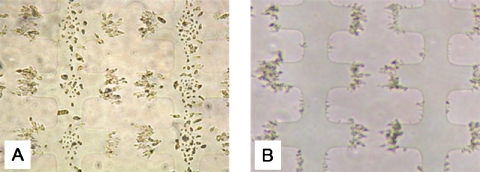
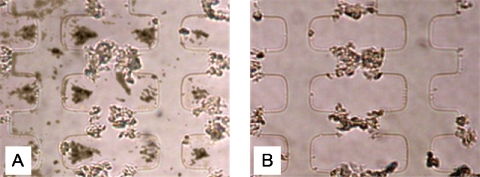
Under the chosen separating conditions, i.e., frequency of 120 kHz and medium conductivity of 2 μS cm−1, it was quite straightforward to separate active and dormant M. smegmatis cells. When a 1:1 mixture of active and dormant cells was made in 0.5M sorbitol solution, the majority of active M. smegmatis cells were strongly attracted to the tip of the electrodes, while dormant cells were mainly pushed on the top of the electrode surface [see Fig. 8a]. Pumping a medium flow of 10 μl min−1 with a conductivity of 2 μS cm−1 through the chamber for 3 min was sufficient to remove the majority (approx. 90% or over) of the dormant cells from the chamber, while the active M. smegmatis cells were still retained inside the chamber, as shown in Fig. 8b. The electric field was then removed and the attracted cells were flushed from the chamber. The two populations of cells were collected in presterilized containers for further testing. These tests confirmed that the majority of cells that were retained in the chamber were active cells, as growth could readily be obtained in both nutrient broth and Sauton’s medium. However, the other population of eluted cells only started to grow in Sauton’s medium after resuscitation by coculture with active M. luteus cells.4
Figure 8.
Dielectrophoretic separation of active and dormant M. smegmatis. Microelectrodes were of the interdigitated oppositely castellated type with a characteristic size of 30 μm. The applied electrical signal was 120 kHz, 20 Vp.p. and the flow rate was 10 μl min−1. The suspending medium was a 0.5M sorbitol solution with a conductivity of 2 μS cm−1. (a) Distribution of cells from a mixed suspension in the electric field without fluid flow. (b) Same chamber 3 min after the fluid flow was started while keeping the electric field applied.
To separate dead and dormant M. smegmatis cells, whose particle conductivities were very close, it was necessary to adjust not only the electric frequency but also the suspending medium conductivity. NaCl was added to the 0.5M sorbitol medium to adjust the medium conductivity to a value of 900 μS cm−1, which is between the effective particle conductivities of dead and dormant M. smegmatis cells. As shown in Fig. 9a, upon the application of a signal of 80 kHz, 20 Vp.p., at this medium conductivity, the dead cells were collected at the electrode edges by positive DEP. Dormant M. smegmatis cells were directed into triangular-shaped aggregates in between castellations by negative DEP. A small number of dormant cells were also pushed on top of the electrode surface by electro-osmotically or thermally induced fluid flow. Figure 9b shows that after the medium was pumped into the separation chamber at a flow rate of 10 μl min−1, dead cells attracted by positive DEP were left inside the chamber, while dormant M. smegmatis cells were all flushed out. The two separated populations of cells were collected into individual sterilized containers, concentrated, stained with propidium iodide, and assessed using fluorescence microscopy. Microscopic observation of the cells suggested that only a small number of dormant cells (which were not stained) were attracted by positive DEP and had remained in the chamber, while no fluorescent (dead) cells were observed among the cells that underwent a negative dielectrophoretic force.
Figure 9.
Dielectrophoretic separation of dead and dormant M. smegmatis. Microelectrodes were of the interdigitated oppositely castellated type with a characteristic size of 30 μm. The applied electric signal was 80 kHz, 20 Vp.p. and the flow rate was 10 μl min−1. The suspending medium was a 0.5M sorbitol solution with a conductivity of 900 μS cm−1. (a) Chamber with a mixed suspension with the electric field applied but no fluid flow. (b) Chamber 3 min after the fluid flow was started; the electric field was still applied.
For resuscitation experiments it is necessary to have large numbers of dormant cells without any active cells. For this purpose a system was developed as in Fig. 4. Active cells were collected from the continuous 10 μl min−1 flow of 0.5M 2 μS cm−1 sorbitol solution in the first two chambers by applying a 120 kHz, 20 Vp.p. signal to the microelectrodes; dormant cells were collected in the third chamber using a 1 MHz, 20 Vp.p. signal. After 2–3 h the dormant cells were collected by turning off the signal that was applied to the third chamber. A total of 1–2 ml of cell suspension was separated. The collected dormant cells were spread on agar plates; no cell growth was observed. Resuscitation of the collected dormant cells in Sauton’s medium by coculture with active M. luteus cells was similar to that of dormant cells that had not undergone the DEP separation process. Although it is likely that some (unknown) loss of dormant cells may have occurred in the separation process, the results indicate that the method can effectively remove active cells from dormant cells.
CONCLUSIONS
The results of the measurement of bacterial effective particle conductivity of M. smegmatis cells suggested that it is highly dependent on the cell physiological state. The effective particle conductivity of active M. smegmatis cells was the lowest (560±20 μS cm−1), while the dormant cells had a much higher effective particle conductivity, almost double that of active cells (812±10 μS cm−1). The effective particle conductivity obtained for autoclaved dead M. smegmatis cells was the highest (950±15 μS cm−1).
Differences between dead and active cells can be ascribed to the higher permeability of the cell membrane, leading to increases in the membrane conductivity and decreases in the cytoplasmic conductivity. Although it cannot be excluded that differences exist between the dielectric properties of the interior between dormant and active cells,24 all experiments described here have been done with frequencies of 1 MHz and lower. At such frequencies, the cell membrane insulates the cell interior from the electric field and the cells’ dielectric properties are dominated by the electrical properties of the cell wall. The differences in the particle conductivity of dormant and active M. smegmatis cells can arguably be explained by differences in their cell wall properties. Cells in the dormant state have a much thicker cell wall compared to active cells.16, 25, 26 The overall cell conductivity increases with an increase in the thickness of cell wall,20, 27, 28 and thus the increase in the bacterial conductivity from active to dormant state can have been caused by an increase in wall thickness. The results obtained tie in with previous studies, in which the particle conductivity of M. luteus (but not E. coli) greatly increased when the cells went from exponential to stationary phase.20, 28
Despite the relatively high particle conductivity, dormant cells were, in general, quite easily removed from the electrodes by a fluid flow over the electrodes. One possible explanation is the smaller size and more round shape of the dormant cells, leading to a reduction in the dielectrophoretic forces holding the dormant cells at the electrode arrays.
Separation of active and dormant M. smegmatis at interdigitated castellated electrodes with a characteristic size of 30 μm was found to be possible using an applied electrical signal of 120 kHz, 20 Vp.p. and a suspending medium conductivity of 2 μS cm−1 at a flow rate through the chamber of 10 μl min−1. For the separation of a mixture of dead and dormant M. smegmatis using the same chamber and flow rate, an applied signal was found to be suitable of 80 kHz, 20 Vp.p. with a medium conductivity of 900 μS cm−1.
The removal of active cells from a 1:1 mixture of dormant and active M. smegmatis cells was demonstrated. Although some loss of dormant cells occurred during the separation process, no active growing cells were found in the dormant cell fraction. The complete removal of active from dormant cells is potentially very useful in resuscitation studies.
Finally, it has been shown29 previously that M. tuberculosis (a close relative of the M. smegmatis) in the dormant state has a different cell wall from cells in an active state. Also, dormant forms of M. tuberculosis are smaller than those of active cells.13 Thus, the results obtained here may also hold for M. tuberculosis.
ACKNOWLEDGMENTS
We wish to thank the School of Chemical Engineering and Analytical Science at the University of Manchester for a scholarship for Ke Zhu and NATO for funds for exchange visits between Manchester and Moscow. We also wish to thank Dr. J. Hatfield and Mr. M. McGowan of the School of Electronic and Electrical Engineering at the University of Manchester for the use of the clean rooms for electrode manufacture.
References
- Oliver J. D., J. Microbiol. 43, 93 (2005).15765062 [Google Scholar]
- Hayes C. S. and Low D. A., Curr. Opin. Microbiol. 12, 667 (2009). 10.1016/j.mib.2009.09.006 [DOI] [PMC free article] [PubMed] [Google Scholar]
- Barer M. R., J. Med. Microbiol. 46, 629 (1997). 10.1099/00222615-46-8-629 [DOI] [PubMed] [Google Scholar]
- Shleeva M. O., Mukamolova V. G., Young M., Williams D. H., and Kaprelyants A. S., Microbiology 150, 1687 (2004). 10.1099/mic.0.26893-0 [DOI] [PubMed] [Google Scholar]
- Coutard F., Crassous P., Droguet M., Gobin E., Colwell R. R., Pommepuy M., and Hervio-Heath D., ISME J. 1, 111 (2007). 10.1038/ismej.2007.1 [DOI] [PubMed] [Google Scholar]
- Davey H. M., Kaprelyants A. S., and Kell D. B., in Flow Cytometry in Microbiology, edited by Lloyd D. (Springer, Heidelberg, 1993), p. 83. [Google Scholar]
- Del Mar Lleo M., Perobon S., Tafi M. C., Signoretto C., and Canepari P., Appl. Environ. Microbiol. 66, 4564 (2000). 10.1128/AEM.66.10.4564-4567.2000 [DOI] [PMC free article] [PubMed] [Google Scholar]
- Pohl H. A., Dielectrophoresis (Cambridge University Press, Cambridge, 1978). [Google Scholar]
- Gascoyne P. R. C. and Vykoukal J., Electrophoresis 23, 1973 (2002). [DOI] [PMC free article] [PubMed] [Google Scholar]
- Hughes M. P., Electrophoresis 23, 2569 (2002). [DOI] [PubMed] [Google Scholar]
- Kochi A., Tubercle 72, 1 (1991). 10.1016/0041-3879(91)90017-M [DOI] [PubMed] [Google Scholar]
- Mukamolova G. V., Kormer S. S., Yanopolskaya N. D., and Kaprelyants A. S., Microbiology 64, 284 (1995). [Google Scholar]
- Shleeva M. O., Bagramyan K., Telkov M. V., Mukamolova G. V., Young M., Kell D. B., and Kaprelyants A. S., Microbiology 148, 1581 (2002). [DOI] [PubMed] [Google Scholar]
- Shleeva M. O., Mukamolova G. V., Telkov M. V., Berezinskaia T. L., Syroeshkin A. V., Biketov S. F., and Kapreliants A. S., Mikrobiologiia 72, 76 (2003). [PubMed] [Google Scholar]
- Mukamolova G. V., Yanopolskaya N. D., Votyakova T. V., Popov V. I., Kaprelyants A. S., and Kell D. B., Arch. Microbiol. 163, 373 (1995). 10.1007/BF00404211 [DOI] [Google Scholar]
- Mukamolova G. V., Yanopolskaya N. D., Kell D. B., and Kaprelyants A. S., Antonie van Leeuwenhoek 73, 237 (1998). 10.1023/A:1000881918216 [DOI] [PubMed] [Google Scholar]
- Talary M. S., and Pethig R., IEE Proc.: Sci., Meas. Technol. 141, 395 (1994). 10.1049/ip-smt:19941073 [DOI] [Google Scholar]
- Burt J. P. H., Alameen T. A. K., and Pethig R., J. Phys. E 22, 952 (1989). 10.1088/0022-3735/22/11/011 [DOI] [Google Scholar]
- Price J. A. R., Burt J. P. H., and Pethig R., Biochim. Biophys. Acta 964, 221 (1988). [DOI] [PubMed] [Google Scholar]
- Carstensen E. L. and Marquis R. E., in Spores VI, Sixth International Spore Conference, Michigan, 1975, edited by Gerhardt P., Costilow R. N., and Sandoff H. L. (ACS, Washington, 1975), p. 563. [Google Scholar]
- Sebastián J. L., Muñoz S., Sancho M., and Álvarez G., Phys. Rev. E 78, 051905 (2008). 10.1103/PhysRevE.78.051905 [DOI] [PubMed] [Google Scholar]
- Marks G. H., Huang Y., Zhou X. -F., and Pethig R., Microbiology 140, 585 (1994). 10.1099/00221287-140-3-585 [DOI] [Google Scholar]
- Maraha N., Backman A., and Jansson J. K., FEMS Microbiol. Ecol. 51, 123 (2004). 10.1016/j.femsec.2004.07.007 [DOI] [PubMed] [Google Scholar]
- Carstensen E. L., Marquis R. E., Child S. Z., and Bender G. R., J. Bacteriol. 140, 917 (1979). [DOI] [PMC free article] [PubMed] [Google Scholar]
- Day A. P. and Oliver J. D., J. Microbiol. 1, 67 (2004). [Google Scholar]
- Novitsky J. A. and Morita R. Y., Appl. Environ. Microbiol. 32, 617 (1977). [DOI] [PMC free article] [PubMed] [Google Scholar]
- Carstensen E. L. and Cox H. A., Biophys. J. 5, 289 (1965). 10.1016/S0006-3495(65)86717-0 [DOI] [PMC free article] [PubMed] [Google Scholar]
- Ni D., “Measurement of the influence of the cell wall on the electrical properties of cells,” M.S. thesis, UMIST, 2003. [Google Scholar]
- Seiler P., Ulrichs T., Bandermann S., Pradl L., Jorg S., Krenn V., Morawietz L., Kaufmann S. H. E., and Aichele P., J. Infect. Dis. 188, 1326 (2003). 10.1086/378563 [DOI] [PubMed] [Google Scholar]


