Abstract
We demonstrated a simple method for the device design of a staggered herringbone micromixer (SHM) using numerical simulation. By correlating the simulated concentrations with channel length, we obtained a series of concentration versus channel length profiles, and used mixing completion length Lm as the only parameter to evaluate the performance of device structure on mixing. Fluorescence quenching experiments were subsequently conducted to verify the optimized SHM structure for a specific application. Good agreement was found between the optimization and the experimental data. Since Lm is straightforward, easily defined and calculated parameter for characterization of mixing performance, this method for designing micromixers is simple and effective for practical applications.
INTRODUCTION
Rapid mixing of fluids flowing through microchannels is very important for reactions to take place within microchannels in many micro total analysis system (μTAS) applications.1, 2 However, flows in microchannels are generally laminar and are characterized by low Reynolds numbers (Re), thus making mixing processes at the microscale difficult and ineffective.3 In order to achieve complete mixing within a reasonable time and a microchannel length scale, many micromixing technologies have been developed.4, 5, 6 Among all of the successfully developed micromixers, those with grooved surfaces in a channel floor have attracted intensive research interests and have found numerous applications. The floor-grooved micromixers use a series of patterned grooves on the inner channel surface to stretch and fold the fluids to be mixed—over the cross section of the channel—to reduce the distance over which different molecules have to diffuse to mix.7, 8 For example, Johnson et al.7 fabricated and tested several T-mixers with slanted wells at the junction and found that all designs were relatively successful at low flow rates, but had varying degrees of success at high flow rates. Stroock et al.8 conducted studies on mixing in both staggered herringbone micromixers (SHMs) and slanted groove micromixers (SGMs) at low Reynolds numbers. The SHM with herringbones patterned on the bottom wall was shown to produce double helical motions of the fluids in the mixer and thereby resulted in better mixing than the SGM. Importantly, all of these designs have been shown to be more efficient than most of their passive micromixer counterparts, and yet they are simple and inexpensive to fabricate. In addition, the floor-grooved micromixers are more practical than active micromixers, which generally require external energy supplies to agitate the fluids in order to achieve efficient mixing and require complicated device packaging and system integration.
Many methods have been used to characterize the mixing performance of micromixers in order to develop proper designs for targeted applications. Experimentally, color change-based pH indicators,9, 10 iodide-iodate pair reactions,11, 12 and decolorization reaction of iodine with sodium thiosulfate13 are simple ways to characterize micromixers, while advanced instrumentations, such as confocal microscopy,8 laser-induced fluorescence,14, 15 and thermal lens spectrometry16 may provide more detailed information at a higher cost. Theoretically, numerical simulation based on computational fluid dynamics (CFD) has been widely used to study the mixing process. Wanget al.17 conducted three-dimensional (3D) flow analysis with a CFD package for microfluidics (MEMCFD™) and showed a cross-sectional velocity field and streak lines. Liu et al.18 studied the influence of fluid properties and a large concentration gradient on mixing phenomena for two types of micromixers at Re=1 and 10, respectively. Some commercial CFD packages are developed using a finite volume method [such as FLUENT,19CFX5,20, 21ANSYS CFX-10.0 (Refs. 22, 23)] or a finite element method (FEM) [such as COMSOL (Refs. 24, 25, 26) and FIDAP (Ref. 27)] to solve flow problems. For example, Aubin et al.20 compared the flow pattern and mixing behavior in both the slanted groove and staggered herringbone mixers. Williams et al.26 used the results from confocal microscopy and CFD modeling to develop and evaluate an analytical model of mixing in the SHM to guide mixer design. In addition, particle tracking method24, 28 was also applied to characterize the mixing behavior of micromixers in details.
In addition to its application in mixing studies, numerical simulation may also have a great potential in device optimization for micromixer design. Aubin et al.21 investigated the effect of different geometrical parameters on the mixing quality and found that different mixing efficiencies could be achieved with very small modifications to the geometry of the grooves. Ansari and Kim22, 23 applied 3D Navier–Stokes analysis to optimize the shape of SHM, which is based on either the response surface method or the radial basis neural network method. The mixing index at the end of the patterned groove is employed as the objective function. Furthermore, the effects of geometric parameters on the mixing performance of SHM are numerically investigated in a systematic manner by Yang et al.29 These numerical simulations were shown to be able to provide a general trend about the effect of device structure on mixing performance, which is helpful in guiding device design. However, the true optimum design has yet to be discovered for a specific application through numerical simulations so that experimental trials can be minimized, as demonstrated in the design and fabrication of microelectronic and integrated photonic devices. As such, majority of the researchers who do not have an expertise in fluidics still do not have an effective tool to adopt a reported micromixer structure in a microfluidic channel with different dimensions, and have to rely on experiment to search the optimal device structure for their applications. Indeed, how to transfer a reported device structure remains a problem. In this paper, we reported a simple method of using numerical simulation to design a SHM for our targeted application and demonstrated its effectiveness with the fabricated devices. The method is based on characterizing the simulation results of a mixing process with a performance parameter critical to applications, and is easy to be implemented.
NUMERICAL SIMULATION
Figure 1 shows a typical structure of the SHM used for numerical simulation. It is a 75% proportionally reduced version of a SHM reported in literature,8 with a microchannel cross-sectional dimension of 20 μm(height)×50 μm(width) and herringbone grooves of 7 μm(depth)×12.5 μm(width). The x axis is the flow direction along the channel length, the y axis is the direction of the microchannel width, and the z axis is the direction of the microchannel height. We initially set the microchannel width at 50 μm to fit the design requirements for our microfluidic-based flow cytometer with small dimensions. The grooves are patterned at a 45° angle to the x axis since it was concluded as the optimal angle in literatures.8 The asymmetry index of our SHM (fraction of the width of the channel occupied by the short arms of the herringbones) is one third which was considered the optimal in literature.8 As shown in Fig. 1, the half cycle contains a group of six grooves. The total length of the simulated channel is 5 mm, which is the maximum allowable dimension for our targeted application. In our study, the number of full cycles is dependent on the groove width provided that the same number of grooves is included in per cycle. For the micromixer with groove width of 12.5 μm, the channel length occupied by one full cycle is equal to 0.33 mm, therefore, there are 15 full cycles within the 5 mm channel length.
Figure 1.
Structure of the simulated SHM (unit in microns).
CFD modeling was completed using COMSOL MULTIPHYSICS version 3.4 (Burlington, MA). The numerical simulation was used to solve incompressible Navier–Stokes equations and convection-diffusion equations at steady state, as reported in literature.29 In details, two main equations are as followed: Navier–Stokes equations,
| (1) |
and convection-diffusion equations,
| (2) |
Here ρ denotes density (kg∕m3), u is the velocity (m∕s), η denotes viscosity (Pa s), p equals pressure (Pa), D denotes the diffusion coefficient (m2∕s), and c represents the concentration (mol∕m3).
This simulation of the COMSOL was based on FEM, which uses free mesh elements that can easily adapt to the structure of the channel. All the implementation was done by the software with the type of equations and the boundary conditions to be defined by the operator. The tetrahedral free meshing method, with a maximum element size scaling factor at 0.2, an element growth rate at 1.3, a mesh curvature factor at 0.2, a mesh curvature cutoff at 0.001, and resolution of narrow region at 1, was used in the simulation. It combined a triangular grid system with the tetrahedral grid at the wall region to capture the gradient near the channel walls. There were (1.0–1.5)×106 of tetrahedral elements and (1.4–1.8)×105 of triangular elements involved in the simulation, in which mesh was adjusted according to every specific device structure and mixing condition to obtain the required convergence at a reasonable time scale while maintaining the required accuracy. The inlet flows were set as laminar flows. The boundary conditions were set as follows: Outflow gauge pressure of the channel as 0 Pa (p=0), velocity of the flows at the channel walls as 0 m∕s (u=0), and fluid concentrations at two inlets as 1 m mol l−1 (color coded in red) and 0 m mol l−1 (color coded in blue), respectively. Both fluids were composed of the same type of solute and solvent. Other parameters used in the simulation included 0.01 m∕s as required in our application for the average linear velocity of both fluids at the inlets and 1×10⁻¹⁰ m2∕s for the molecular diffusion coefficient for the solute in the solvent. The corresponding Reynolds number Re=lρν∕η of the studied fluids was therefore calculated to be 0.3 assuming that the fluids were aqueous solutions with density ρ=1×10³ kg∕m3 and viscosity η=1×10⁻³ N s∕m2, respectively. The postprocessing or visualization of the simulated results was obtained using the associated function in COMSOL, which is based on an undisclosed mesh independent solution.
EXPERIMENTAL
Material
All chemicals were purchased from Sigma-Aldrich (St. Louis, MO) and used as received unless otherwise indicated.
Device fabrication
The simulation-optimized SHM device was fabricated through a previously reported two-level photolithography process.30 Briefly, a 4 in. silicon wafer was surface treated with Piranha solution and spin coated the first layer of SU-8 photoresist (MicroChem, Newton, MA). The wafer was then soft baked, exposed to UV through a photomask and postbaked to prepare the channel structure. Subsequently, the second level of SU-8 photoresist was spin coated on the exposed photoresist and again exposed to UV with a second aligned photomask to define the pattern of the staggered herringbone just on the top of the initially created channel patterns. After postbaking, the two exposed layers were developed simultaneously to finally obtain the mold master. The resulting master was silanized with tridecafluoro-1,2,2,2-tetrahydrooctyl-1-trichlorosilane for mold release and then used to cast Sylgard 184 prepolymer (Dow Corning, Midland, MI) to fabricate the patterned polydimethylsiloxane (PDMS) channels. Finally the obtained channels were sealed by irreversible bonding of PDMS with plasma treated clean glass slides, and connected to stainless tubes through leak-proof pressure sealing to finally obtain a fully functional SHM device.
Device testing
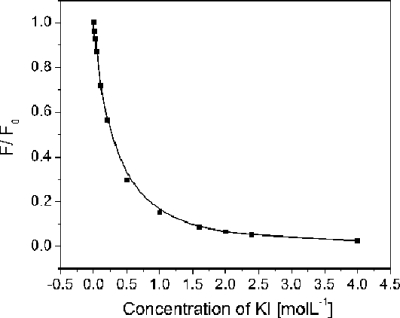
The mixing efficiency in the fabricated device was tested by performing fluorescence quenching experiments as previously described.31, 32 Potassium iodide (KI) was used as the quencher of fluorescein in borate buffer solution. Initially, a series of quenching experiments were carried out in static conditions to establish the optimized concentrations of both fluorescein and KI for experiments in the microchannel. Specifically, 1 μ mol l−1 fluorescein was mixed with equal volume of KI solutions of different concentrations. The premixed solutions were excited at 480 nm and the emission collected by a fluorescence spectrometer (FluoroLog-3, HORIBA Jobin Yvon, Mississauga, ON) at a spectrum range from 495 to 650 nm. As shown in Fig. 2, the normalized fluorescence intensity obtained at 510 nm decreased rapidly with an increasing concentration of KI and started to level off at 2 mol l−1. This is because a nonfluorescent complex forms between quencher and fluorophore.31, 33 We chose to use 2 mol l−1 KI concentration in all dynamic micromixing experiments in this study.
Figure 2.
Normalized fluorescence intensity of premixed solutions of 1 μmol l−1 fluorescein with equal volume of KI of different concentrations.
For the dynamic mixing studies, the fluorescein and KI solutions were separately introduced to the Y-type inlet of each SHM device using a two-channel syringe pump (Harvard Apparatus, Holliston, MA) at a flow velocity of 0.01 m∕s. The flow within the microchannel was monitored with an inverted microscope (model IX71, Olympus, Markham, ON) equipped with a digital camera (QICAM FAST, Lumenera Corp., Ottawa, ON). The captured images were analyzed using IMAGEPRO PLUS Imaging Analysis software (MediaCybernetics, Bethesda, MD).
RESULTS AND DISCUSSION
Simulation characterization
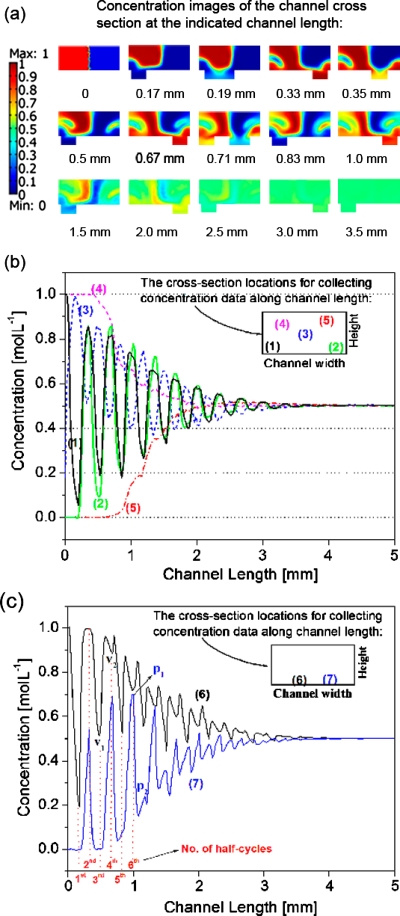
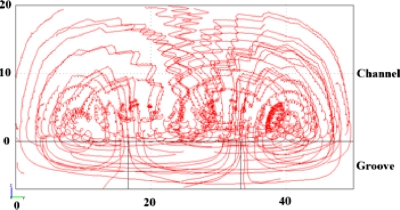
From the simulation results, the concentration data at five predetermined cross-sectional locations along different channel lengths were retrieved and plotted against respective channel length to obtain concentration versus channel length profiles.34 This was used to gain insights into the dynamic micromixing process within a SHM since concentration change is related to both vortices and mixing occurs along channel length. In comparison with the commonly used color coded cross-sectional concentration profiles, as shown in Fig. 3a, Figs. 3b, 3c showed concentration streamlines of the predetermined locations of a cross-sectional area along the channel length. The periodical concentration oscillation shown in Fig. 3b is believed to be caused by two transverse vortices, one large and one small, alternating with the asymmetry of SHM structure. For example, the falling and rising edges of streamline (1) correspond to the large vortex and small vortex, respectively, as indicated in location (1) at the left bottom of the channel cross sections. Likewise, the falling and rising edges of streamline (2) correspond to small vortex and large vortex, respectively, as indicated in location (2) at the right bottom of the channel cross sections. The rest of the streamlines are all similarly defined. Since two vortices coexist and alternate periodically, streamlines (1) and (2) reached peaks and valleys at the same time, except for the first half-cycle period, as seen in Fig. 3b. This is likely because the right small vortex initially mixed with the same fluid from the right inlet (indicated in blue), and as a result the concentration of streamline (2) remained unchanged. Moreover, it is noted that the oscillation amplitudes of both streamlines (1) and (2) were larger than that of streamline (3), suggesting a stronger mixing effect at the vicinity of the grooves. The peak-to-peak (or valley-to-valley) pitches (Ph) of one particular streamline were found to be equal to 0.33 mm, which is the channel length occupied by one full cycle structure. We also studied the concentration profiles of other SHMs with various structure dimensions (data not shown) and confirmed the notion that Ph was only dependent on the channel length of one full cycle. This result is, however, different from mixing process in a SGM whose corresponding helical pitch has been shown to decrease with increasing groove depth.32 As to the locations further away from the grooves, such as locations (4) and (5), their concentrations remained constant at initial values for a short distance along the channel suggesting that the initial mixing by the two vortices was only limited to the regions close to the grooves until the upper portion of the channel fluid was sufficiently affected by the two vortices. Further details about the mixing process can be analyzed from the velocity fields in the SHM, as shown in Fig. 4. Extensive chaotic mixing occurs in the locations close to the grooves, causing the above described concentration oscillations. In the locations far way from the grooves, such as locations (4) and (5) in Fig. 3b, on the other hand, the helical flows are slow and the concentrations in these locations are gradually changed by the transportation of mixed solution to the locations, and do not exhibit oscillations.
Figure 3.
(a) The concentration images of the channel cross sections are collected at the indicated channel lengths. [(b) and (c)] Concentration vs channel length profiles for the SHM. The concentration data are collected along channel length in its flow direction at the fixed cross-sectional locations represented with (1) at (5, 3) (unit in microns), (2) at (45, 3), (3) at (25, 10), (4) at (12.5, 15), (5) at (37.5, 17.5), (6) at (16.7, 1), and (7) at (33.3, 1) in the y-z coordinate system of the channel cross section with its left-down point set at (0, 0).
Figure 4.
Velocity fields of SHM. Channel dimension of 20(h)×50(w) μm2; groove dimension of 7(d)×12.5(w) μm2.
Interestingly, when we collected the concentration data at locations (6) and (7), the obtained concentration profiles showed two valleys∕peaks in one full cycle after the first couple of mixing cycles, as shown in Fig. 3c. This is significantly different from those shown in Fig. 3b and has not been previously reported in literature. It can be explained as follows as we take streamline (6) as an example here. During the odd-numbered half cycles, the mixing concentration at location (6) is affected by only one large vortex with the transportation of lower concentration liquid from right to left. This process is the same as that at location (1) and the mixing concentration decreases to the minimum (V1) at the end of each odd-numbered half cycles. In comparison, during the even-numbered half cycles, location (6) is at the interface of two vortices with the asymmetric alternation of the grooves. At this time, the interface concentration is, in fact, controlled by two helical motions with two different concentrations: On the one hand, small vortex on the left mixes the lower concentration fluid with the bulk higher concentration fluid thereby causing the concentration at the interface to go up; on the other hand, large vortex on the right transports the higher concentration fluid to the right to be mixed with the bulk lower concentration fluid, causing the concentration at the interface to go down. The interaction of the two vortices causes the interface concentration to first go up and then down to valley (i.e., V2) during the even-numbered half cycle, except for V2 which is unobvious for one overwhelming motion during the second half cycle. The above process is repeated in the following mixing cycles until the whole mixing completes. The detailed mathematical analysis on the two valleys is beyond the scope of the present study and will not be discussed here.
Most importantly, all of the concentration profiles [as shown in Figs. 3b, 3c] were found to converge to 0.5 m mol l−1, which is the expected theoretical value for fully mixed fluids with respective concentrations of 1 and 0 m mol l−1. When the concentration at every location within the whole cross section reaches a value of C=0.5±ε m mol l−1 at a channel length Lm, where ε is the targeted concentration uniformity according to a specific application, we define Lm as mixing completion length at which the mixing can be considered completed. A small Lm value corresponds to an efficient mixing. An Lm value of 2.8 mm was needed for the SHM structure shown in Fig. 1 at a ε=0.01. This Lm value is much smaller than 5.0 mm, which was needed in a SGM under similar flow conditions.34 This conclusion is in good agreement with the reported observations that SHM is more effective than SGM due to the formation of two helical flows in the mixing process.8, 20
Geometric parameter analysis
From an application’s point of view, mixing completion length Lm under a fixed mixing condition is the most straightforward parameter to verify the mixing performance although many other parameters are useful to understand the process. Unlike many well-known parameters, such as mixing efficiency or mixing index, Lm does not directly provide detailed information about a mixing, but covers all the effects involved in a mixing process. It is a comprehensive performance parameter and can best represent the whole mixing as a single parameter. For our application of integrating a micromixer with a microfluidic-based flow cytometer for pathogen detection, Lm≤5 mm at ε=0.005 under a flow velocity of 0.01 m∕s for a desired channel dimension of (10–25)(h)×50(w) μm2 is required for the device. With the well-defined Lm as described earlier, the SHM structure was simply optimized to meet the requirement.
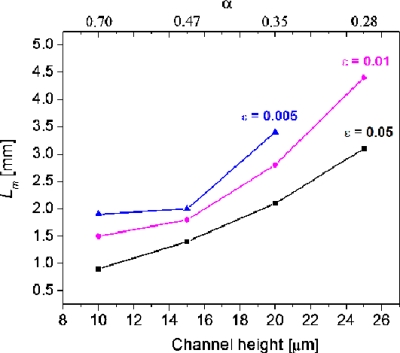
Figure 5 shows the Lm required for various SHMs, which have identical device structure except their channel heights. Evidently, a larger Lm value is required for a smaller ε value at the same channel height, and the Lm value increases with the increasing channel height from 10 to 25 μm. Note that a mixing concentration uniformity of ε=0.005 cannot be reached within a 5 mm long microchannel when the channel height is 25 μm (therefore no data are shown for this data point in Fig. 5). The above results indicate that the mixing finishes quickly in a shallow channel. It should also be noted, however, that shallower channels allow smaller quantity of fluid to be mixed in the micromixer. We therefore stay with channel height of 20 μm for the initially set channel width of 50 μm.
Figure 5.
Effect of channel height on the Lm. Channel width at 50 μm; groove dimension of 10(d)×12.5(w) μm2. Note that Lm cannot reach the mixing extent of ε=0.005 within the simulated 5 mm length when the channel height is 25 μm.
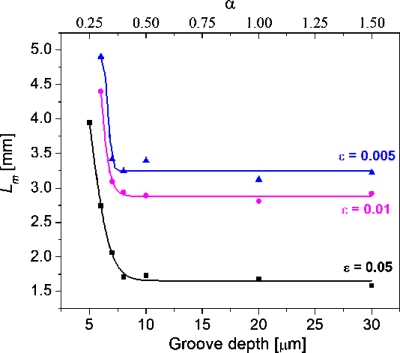
Figure 6 shows the effects of groove depth on the Lm value. All of the Lm values fall sharply first and then level off as the groove depth is increased, indicating that deepening groove within a limited range is very effective in enhancing the mixing and a further increase in groove depth does not lead to a faster mixing completion.
Figure 6.
Effect of groove depth on the Lm. Channel dimension of 20(h)×50(w) μm2; groove width at 12.5 μm. Note that Lm cannot reach the mixing extent of ε=0.01 and ε=0.005 within the simulated 5 mm length when the groove depth is 5 μm.
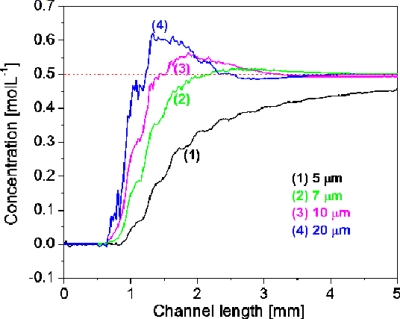
As for the ratio of groove depth to channel height α, which is usually considered one of the most effective parameters to characterize SHM mixing efficiency,32, 33 it was found that a larger α value does not always lead to a smaller Lm value and thus a better mixing as expected. As seen in Figs. 56, α value can be increased either by decreasing the channel height or by deepening the grooves. If it is increased by decreasing the channel height, the mixing enhancement corresponds to the increase in α value within a broad range of 0.28–0.7 (as seen in Fig. 5). Alternatively, if it is increased by deepening the grooves (as seen in Fig. 6), the intensive mixing enhancement only happens when α value is increased from 0.25 to 0.4. Out of the range when α value is further expanded from 0.4 to 1.5, which is still within the reported upper limit of α at 1.6,35Lm remains almost constant. A similar weakened dependence of mixing performance on α value was reported in literature. For example, Yang et al.29 found that when the α value was increased by deepening grooves, a 0.07 increase in the signal to noise ratio η was achieved by changing α value from 0.30 to 0.45, in comparison with a 0.21 change in η value with a α change from 0.15 to 0.30. The reason for this to happen is that the very deep grooves may also bring a significant negative contribution that would offset its positive effect on mixing. It is known that the groove-caused transverse fluid transportation within a microchannel simultaneously happens above the grooved floor and under the floor (i.e., within the grooves). Those flowing above the floor are mostly in the vortices and experience a fast chaotic mixing, and those flowing within the grooves are basically in a typical laminar flow and are mostly exposed to a slow diffusion-dominated mixing. When the groove depth is overly increased, a large quantity of fluid enters the grooves and its slow mixing becomes significant to the overall mixing within the channel. This explanation can find support from the above described concentration versus channel length profiles. Taking the location at (37.5 and 17.5 μm) of cross section, for example (as shown in Fig. 7), the slopes of the concentration profiles increase as the grooves are deepened, indicating that deep grooves are in favor of the chaotic mixing. However, when the groove depth is 10 or 20 μm, corresponding to α values of 0.5 or 1.0, there appears an evident concentration overshoot that prolongs the concentration convergence. As a result, the achieved improvement in chaotic mixing is offset by the increased weight of poor-mixed component, and thus the Lm remains unchanged. The explanation is also in good agreement with the concept of the so-called dead volume reported in literature.32
Figure 7.
Concentration profiles of location at (37.5 and 17.5 μm) of the channel cross section in SHM with different groove depths. Channel dimension of 20(h)×50(w) μm2; groove width at 12.5 μm.
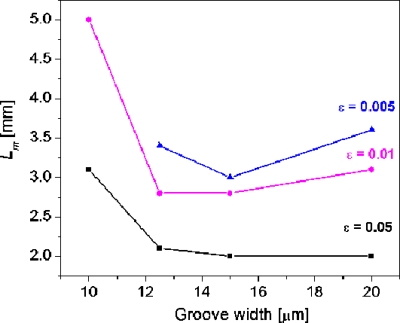
Figure 8 shows the effect of groove width on the Lm value. The Lm value decreases sharply as groove width is increased from 10 to 12.5 μm, indicating that a better mixing is achieved in a wider groove. When the groove width reaches 15 μm, its impact on the Lm is nearly the same as that at 12.5 μm at ε=0.05 and 0.01 but is slightly improved at ε=0.005. When the groove width is further increased to 20 μm, the mixing performance is hardly improved at ε=0.05 and even worse at ε=0.01 and ε=0.005. The reason for this phenomenon was discussed by Aubin et al.21 If the groove width is very narrow, the flow in the microchannel is hardly affected by the transversal velocity component and spatial mixing is very poor. However, the wide grooves give rise to dead zones in the microchannel volume. Therefore, it is concluded that the optimum groove width is 12.5 μm for the groove depth of 7 μm.
Figure 8.
Effect of groove width on the Lm. Channel dimension of 20(h)×50(w) μm2; groove depth at 7 μm. Note that Lm cannot reach the mixing extent of ε=0.005 within the simulated 5 mm length when the groove width is 10 μm.
While other device structure parameters may also affect the mixing performance, the above optimized geometry of SHM with a 20 μm in channel height, 7 μm in groove depth, and 12.5 μm in groove width, already met our targeted performance for integrating the micromixer with microfluidic-based flow cytometer on a single chip, and was thus chosen to be fabricated for experimental verification.
Experimental verification
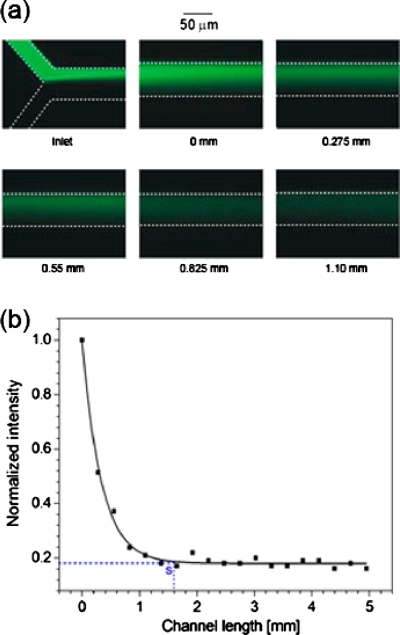
The simplified simulation-optimized SHM was fabricated with a 0.5 mm long grooveless section added ahead the first group groove [image of inlet in Fig. 9a] to introduce the steady fluids to SHM and compare the pure diffusion-dominated mixing in the region with the chaotic mixing in the floor-grooved region. Figure 9a shows the fluorescence images of the fluorescein solution and iodide solution flowed along the micromixer channel. With an increasing distance or channel length, the fluorescence field at the location gradually expends to the whole channel width with decreased intensity, indicating the quick mixing of fluorescein and iodide, and quick fluorescence quenching during their flow. When the channel length is equal and longer than 0.825 mm, there is no difference in fluorescence intensities to the naked eyes. In order to quantitatively characterize the quenching effect and thus the mixing process, we measured and analyzed the fluorescence intensity profiles crossing the channel width at every 0.275 mm interval of channel length (from starting the first groove, where channel length was set as 0 and fluorescence intensity as initial intensity). As seen in Fig. 9b, the normalized intensity decreases sharply along the channel length initially and then quickly levels off while approaching a constant. The intensity decrease is apparently associated with the quick mixing and fluorescence quenching process, while the constant intensity was found equal to the value when the two fluids were fully mixed by a mechanical mixer. With this figure, mixing can be considered complete as the fluorescence intensity decreases to a constant value in the SHM, and its corresponding channel length can thus be defined as the mixing completion channel length. This value is 1.6 mm, which is very close to 1.4 mm as calculated from concentration profiles at ε=0.09, experimentally confirming the optimized device structure.
Figure 9.
(a) Fluorescence images at inlet and indicated channel lengths. (b) Normalized fluorescence intensity as a function of channel length. Data are collected at every 0.275 mm interval of channel length from 0 to 5 mm.
Such a high level of agreement between experimental results and simulation results is quite normal in the design of microelectronics and optical electronic devices. It has demonstrated that a well-defined Lm can be used to design SHM device structure through numerical simulation to meet our specific requirement. The method can be also easily used to evaluate more device parameters with a systematical approach and cover a broad range of mixing conditions for other applications. Given that μTAS is application driven and involves researchers with a much diversified background, such a method using a straightforward performance parameter Lm, which can be precisely defined from the simulated concentration-channel length profiles, is easy to understand and simple to use for the researchers. It should be applicable to design another type of micromixer for a specific application.
CONCLUSIONS
In conclusion, the concentration versus channel length profiles of a SHM, which are obtained from numerical stimulation, can be used to reveal the detailed dynamic micromixing process within the micromixer. The most straightforward parameter, Lm, was used to characterize mixing performance and to design SHM structure for our targeted application. The performance of fabricated device was experimentally in good agreement with the results obtained in simulation. The simple, direct, and effective method described in this work demonstrates a simple device design of a SHM using numerical simulation and should be applicable to design other types of micromixers.
ACKNOWLEDGMENTS
A postdoctoral fellowship (Y.D.) by the Natural Sciences and Engineering Research Council of Canada (NSERC) through a Strategic Grant (STPGP 336596-06) and the assistance of Ping Zhao of the NRC in device fabrication are greatly appreciated.
References
- Gong X. Q. and Wen W. J., Biomicrofluidics 3, 012007 (2009). 10.1063/1.3098963 [DOI] [PMC free article] [PubMed] [Google Scholar]
- Lam Y. C., Gan H. Y., Nguyen N. T., and Lie H., Biomicrofluidics 3, 014106 (2009). 10.1063/1.3108462 [DOI] [PMC free article] [PubMed] [Google Scholar]
- Bertsch A., Heimgartner S., Cousseau P., and Renaud P., Lab Chip 1, 56 (2001). 10.1039/b103848f [DOI] [PubMed] [Google Scholar]
- Nguyen N. T. and Wu Z. G., J. Micromech. Microeng. 15, R1 (2005). 10.1088/0960-1317/15/2/R01 [DOI] [Google Scholar]
- Hessel V., Lowe H., and Schonfeld F., Chem. Eng. Sci. 60, 2479 (2005). 10.1016/j.ces.2004.11.033 [DOI] [Google Scholar]
- Zhang Z. Y., Zhao P., Xiao G. Z., Lin M., and Cao X. D., Biomicrofluidics 2, 014101 (2008). 10.1063/1.2894313 [DOI] [PMC free article] [PubMed] [Google Scholar]
- Johnson T. J., Ross D., and Locascio L. E., Anal. Chem. 74, 45 (2002). 10.1021/ac010895d [DOI] [PubMed] [Google Scholar]
- Stroock A. D., Dertinger S. K. W., Ajdari A., Mezic I., Stone H. A., and Whitesides G. M., Science 295, 647 (2002). 10.1126/science.1066238 [DOI] [PubMed] [Google Scholar]
- Kim D. S., Lee I. H., Kwon T. H., and Cho D. W., J. Micromech. Microeng. 14, 1294 (2004). 10.1088/0960-1317/14/10/002 [DOI] [Google Scholar]
- Melton L. A., Lipp C. W., Spradling R. W., and Paulson K. A., Chem. Eng. Commun. 189, 322 (2002). 10.1080/00986440212077 [DOI] [Google Scholar]
- Panić S., Loebbecke S., Tuercke T., Antes J., and Bošković D., Chem. Eng. J. 101, 409 (2004). 10.1016/j.cej.2003.10.026 [DOI] [Google Scholar]
- Bourne J. R., Chem. Eng. J. 140, 638 (2008). 10.1016/j.cej.2008.01.031 [DOI] [Google Scholar]
- Ohkawa K., Nakamoto T., Izuka Y., Hirata Y., and Inoue Y., Chem. Eng. Res. Des. 86, 1447 (2008). 10.1016/j.cherd.2008.09.004 [DOI] [Google Scholar]
- Kling K. and Mewes D., J. Visualization 6, 165 (2003). 10.1007/BF03181621 [DOI] [Google Scholar]
- Kling K. and Mewes D., Chem. Eng. Sci. 59, 1523 (2004). 10.1016/j.ces.2004.01.015 [DOI] [Google Scholar]
- Ghaleb K. A., Stephan K., Pittet P., Ferrigno R., and Georges J., Appl. Spectrosc. 60, 564 (2006). 10.1366/000370206777412211 [DOI] [PubMed] [Google Scholar]
- Wang H. Z., Iovenitti P., Harvey E., and Masood S., J. Micromech. Microeng. 13, 801 (2003). 10.1088/0960-1317/13/6/302 [DOI] [Google Scholar]
- Liu Y. Z., Kim B. J., and Sung H. J., Int. J. Heat Fluid Flow 25, 986 (2004). 10.1016/j.ijheatfluidflow.2004.03.006 [DOI] [Google Scholar]
- Lynn N. S. and Dandy D. S., Lab Chip 7, 580 (2007). 10.1039/b700811b [DOI] [PMC free article] [PubMed] [Google Scholar]
- Aubin J., Fletcher D. F., Bertrand J., and Xuereb C., Chem. Eng. Technol. 26, 1262 (2003). 10.1002/ceat.200301848 [DOI] [Google Scholar]
- Aubin J., Fletcher D. F., and Xuereb C., Chem. Eng. Sci. 60, 2503 (2005). 10.1016/j.ces.2004.11.043 [DOI] [Google Scholar]
- Ansari M. A. and Kim K. Y., Chem. Eng. Sci. 62, 6687 (2007). 10.1016/j.ces.2007.07.059 [DOI] [Google Scholar]
- Ansari M. A. and Kim K. Y., Chem. Eng. Technol. 30, 962 (2007). 10.1002/ceat.200700055 [DOI] [Google Scholar]
- Kee S. P. and Gavriilidis A., Chem. Eng. J. 142, 109 (2008). 10.1016/j.cej.2008.02.001 [DOI] [Google Scholar]
- Hassell D. G. and Zimmerman W. B., Chem. Eng. Sci. 61, 2977 (2006). 10.1016/j.ces.2005.10.068 [DOI] [Google Scholar]
- Williams M. S., Longmuir K. J., and Yager P., Lab Chip 8, 1121 (2008). 10.1039/b802562b [DOI] [PMC free article] [PubMed] [Google Scholar]
- Camesasca M., Manas-Zloczower I., and Kaufman M., J. Micromech. Microeng. 15, 2038 (2005). 10.1088/0960-1317/15/11/007 [DOI] [Google Scholar]
- Kang T. G. and Kwon T. H., J. Micromech. Microeng. 14, 891 (2004). 10.1088/0960-1317/14/7/008 [DOI] [Google Scholar]
- Yang J. T., Huang K. J., and Lin Y. C., Lab Chip 5, 1140 (2005). 10.1039/b500972c [DOI] [PubMed] [Google Scholar]
- Anderson J. R., Chiu D. T., Jackman R. J., Cherniavskaya O., McDonald J. C., Wu H. K., Whitesides S. H., and Whitesides G. M., Anal. Chem. 72, 3158 (2000). 10.1021/ac9912294 [DOI] [PubMed] [Google Scholar]
- Croney J. C., Jameson D. M., and Learmonth R. P., Biochem. Mol. Biol. Educ. 29, 60 (2001). [Google Scholar]
- Bessoth F. G., deMello A. J., and Manz A., Anal. Commun. 36, 213 (1999). 10.1039/a902237f [DOI] [Google Scholar]
- Jameson D. M., in Fluorescein Hapten: An Immunological Probe, edited by E. W.Voss, Jr. (CRC, Boca Raton, FL, 1984), pp. 40–41. [Google Scholar]
- Zhang Z. Y., Yim C. H., Lin M., and Cao X. D., Biomicrofluidics 2, 034104 (2008). 10.1063/1.2966454 [DOI] [Google Scholar]
- Johnson T. J. and Locascio L. E., Lab Chip 2, 135 (2002). 10.1039/b202631g [DOI] [PubMed] [Google Scholar]


