Abstract
Histidine tRNAs (tRNAHis) are unique in that they possess an extra 5′-base (G-1) not found in other tRNAs. Deletion of G-1 results in at least a 250-fold reduction in the rate of histidine charging in vitro. To better understand the role of the G-1 nucleotide in defining the structure of tRNAHis, and to correlate structure with cognate amino acid charging, NMR and molecular dynamics (MD) studies were performed on the wild-type and a ΔG-1 mutant Escherichia coli histidine tRNA acceptor stem microhelix. Using NMR-derived distance restraints, global structural characteristics are described and interpreted to rationalize experimental observations with respect to aminoacylation activity. The quality of the NMR-derived solution conformations of the wild-type and ΔG-1 histidine microhelices (micro helixHis) is assessed using a variety of MD-based computational protocols. Most of the duplex regions of the acceptor stem and the UUCG tetraloop are well defined and effectively superimposable for the wild-type and ΔG-1 mutant microhelixHis. Differences, however, are observed at the end of the helix and in the single-stranded CCCA-3′ tail. The wild-type microhelixHis structure is more well defined than the mutant and folds into a ‘stacked fold-back’ conformation. In contrast, we observe fraying of the first two base pairs and looping back of the single-stranded region in the ΔG-1 mutant resulting in a much less well defined conformation. Thus the role of the extra G-1 base of the unique G-1:C73 base pair in tRNAHis may be to prevent end-fraying and stabilize the stacked fold-back conformation of the CCCA-3′ region.
INTRODUCTION
Aminoacyl-tRNA synthetases catalyze the attachment of amino acids to specific tRNA substrates via a two-step process. They first form an aminoacyl–adenylate complex, wherein the carboxyl of the amino acid is linked to the alpha-phosphate of ATP with the displacement of inorganic pyrophosphate. After binding to the cognate tRNA, the aminoacyl group of the adenylate complex is transferred to the 2′- or 3′-hydroxyl of the terminal nucleotide (A76). This adenosine is at the end of a strictly conserved single-stranded CCA sequence present at the 3′ end of every tRNA acceptor stem. The vast majority of tRNA isoacceptors contain an additional single-stranded nucleotide at position 73 of the acceptor stem, the so-called ‘discriminator’ base (1). However, histidine tRNAs (tRNAHis) from all species contains a paired discriminator base due to an extra nucleotide at position –1 of the acceptor stem.
The structure of tRNAHis either free or complexed with its cognate histidyl-tRNA synthetase (HisRS) is unknown. However, the synthetase from Escherichia coli has been crystallized with ATP and histidinol (2,3), and the Thermus thermophilus enzyme has been solved in complex with histidine (4). In both E.coli and T.thermophilus tRNAHis, the discriminator base is C73 and the G-1:C73 base pair, found to occur in all tRNAHis of archaebacteria, eubacteria and mitochondria of animals, single-celled organisms and fungi (5), has been proposed to be the principal recognition element in vitro and in vivo.
Replacement of C73 with A, G or U results in ∼10-, ∼100- and ∼10 000-fold decrease, respectively, in aminoacylation efficiency of E.coli tRNAHis in vitro (6). The deletion of G-1 causes ≥250-fold decrease in histidylation efficiency in vitro (6,7), and the substitution by A-1 results in ∼100-fold decrease; a mutant having an A-1:U73 base pair instead of a G-1:C73 failed to recover activity (6). Studies aimed at determining the importance of the extra 5′-phosphate of tRNAHis support a major role for this group in tRNA aminoacylation by E.coli HisRS (7). It was also proposed that the role of the extra G-1 may be attributed to the 5′-phosphate alone and that the G-1 could be responsible for rejecting any non-cognate synthetase (7).
Francklyn and Schimmel (8) have shown that 13 and 8 bp microhelices that reconstruct the acceptor-TΨC or acceptor stem alone of tRNAHis can be charged with histidine, and that the binding interaction between E.coli HisRS and its cognate tRNA is mainly dictated by the acceptor stem. Moreover, the G-1:C73 base pair is also the major recognition element in the microhelix system and is a negative or blocking element for other aminoacyl-tRNA synthetases (9).
Yan and Francklyn (10) have shown that substitutions at position –1:73 of E.coli tRNAHis cause mischarging by glycyl-, glutaminyl- and leucyl-tRNA synthetases in vivo. They also found that this mischarging correlated with the discriminator base rather than with the extra G-1 nucleotide. The two well tolerated residues at position 73 of the tRNA acceptor stem were A and C, with relative suppression efficiencies in vivo measuring at least 7–14 times higher than for G or U, suggesting a possible role for the major groove amino group. The exocyclic amino groups at N6 of A and N4 of C could potentially hydrogen bond with the interacting enzyme (10). This led to the hypothesis that major groove functional groups with hydrogen bonding potential may be significant in HisRS recognition.
In general, a relatively small number of nucleotides are sufficient to confer tRNA identity (11,12). In spite of numerous studies performed to understand the importance of bases in the acceptor stem region of tRNAHis, it is still not clear why tRNAHis requires an extra G-1 base for specific histidylation. Moreover, the conformational effect of a cytosine residue at the discriminator position and the structure of the unique tRNAHis acceptor stem are both unknown. In this work we have determined the solution structure of both wild-type and ΔG-1 mutant E.coli histidine microhelices (microhelixHis) using NMR spectroscopy and molecular dynamics (MD) simulations.
MATERIALS AND METHODS
Experimental methodology
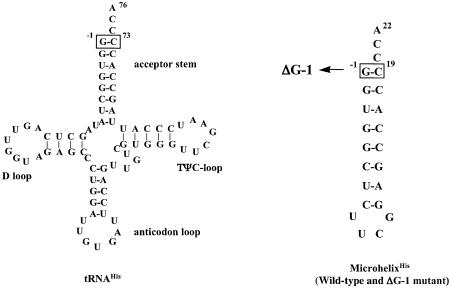
MicrohelixHis (Fig. 1), both wild type and the ΔG-1 mutant, were obtained from Dharmacon Inc (Boulder, CO). After deprotection, purification on a denaturing polyacrylamide gel and extensive dialysis with Millipore water, the samples were lyophilized and resuspended in NMR buffer: 20 mM sodium phosphate, 100 mM KCl pH 6.5 for the wild-type, and 25 mM sodium phosphate, 150 mM KCl pH 6.5 for the mutant RNA. Final sample concentrations were 1.2 mM for wild-type microhelixHis and 2.5 mM for ΔG-1 microhelixHis.
Figure 1.
Sequence of E.coli tRNAHis, wild-type microhelixHis and a ΔG-1 microhelixHis variant used in this study. The unique G-1:C73 base pair is boxed.
All NMR experiments were conducted at 25°C using Varian INOVA 600 MHz or 800 MHz instruments. Experiments were carried out in both H2O and D2O to sort exchangeable from non-exchangeable protons during assignments. A nearly complete chemical shift assignment (see Supplementary Material, Table S1) of non-exchangeable protons was achieved through a combination of DQF-COSY, TOCSY and NOESY experiments of mixing times 100, 150, 200 and 300 ms, and well established RNA resonance assignment methods (13–15). Most experiments were also conducted at 5 and 15°C to evaluate temperature effects on conformation. Solvent suppression was achieved using the WATERGATE pulse sequence (16) on the NOESY experiments, and presaturation for the DQF-COSY.
Data were processed on Varian software and also NMRView (17) using one zero-fill and the appropriate window function. Several NOE build-up rates were calculated for the wild-type microhelix from NOESY mixing times of 100, 150 and 200 ms. Since the interproton distances generated from the build-up rates varied no more than 0.2 Å from distances calculated simply from the 150 ms NOESY cross-peak volumes, the cross-peak volumes were used to generate distance constraints. The H6–H1′ distance for a cytosine in the middle of the helical region was used as a distance reference.
Computational methodology
Starting structures. The starting structures for the wild-type and ΔG-1 RNA microhelices (Fig. 1) were built as canonical A-form RNA helices with a UUCG tetraloop.
Protocol 1. The RNA without solvent was heated from 100 K to 600 K over the first 5000 steps, then cooled from 600 to 100 K over the next 13 000 steps and set at 0 K between steps 18 000 and 20 000. The total processing time was 20 ps. The temperature coupling constant was 0.4 ps for the first 5000 steps, then increased to 4.0 ps for the following 13 000 steps, reduced to 1.0 over the next 1000 steps and to 0.05 over the final 10 000 steps. NMR distance restraint weights were increased from 0.1 to 1.0 during the first 3000 steps and maintained at that value for the rest of the simulation time. Using different random number seeds, 100 different structures were generated and clustered based on root mean square deviations (RMSDs).
Protocol 2. After several runs of simulated annealing using the generalized Born solvation model for water (18–20), explicit solvent was added to the annealed structures and extensive equilibration was carried out, during which 30 ps constant volume simulations were performed from 0 to 300 K, followed by 60 ps of constant pressure simulations. Finally, constant volume MD was performed for 20 ps, with structures saved every picosecond for analysis. NMR-derived distance restraints were included in all the runs.
Protocol 3. Starting from a particular structure, NMR restraints were decreased 10% every 100 ps and MD simulations were run for a total of 1.0 ns. Starting from the 20% restraint reduced structure, restraint weights were increased 10% every 100 ps. At the end of this run, the simulations were further extended by 200 ps with 100% restraints and data from this run were used for analyzing nucleic acid parameters applying the CARNAL module of AMBER (21).
The MD simulations were performed using the SANDER module of AMBER version 6.0 (21) and the force field described by Cornell et al. (22). Charged phosphates were neutralized with Na+ counter-ions and the complex placed in a periodic box of TIP3P water molecules (23) ∼12 Å from the solute in all dimensions. The particle mesh Ewald (PME) method (24) in AMBER was used to treat long-range Coulombic interactions, and the grid spacing was 1 Å. All MD simulations were carried out with periodic boundary conditions. The temperature was maintained at 300 K using the Berendsen coupling algorithm (25). The pressure was stabilized at ∼1 atm with isotropic position scaling. Hydrogen–heavy atom bond lengths were constrained using SHAKE (26). The integration time step was 2.0 fs and the non-bonded cut-off was 9 Å.
NMR restraints. NMR restraints were imposed as a square-bottomed well with parabolic sides out to a defined distance, and then linear sides beyond that. If R is the restraint value, then the restraint function E(R) is described as follows: if R ≤ r1, E is linear with the slope of the ‘left-hand’ parabola at the point R = r1; if r1 ≤ R < r2, E is a parabolic function with a force constant of 20 kcal mol–1Å–2 and E = 0 kcal mol–1Å–2 at R = r2; if r2 ≤ R < r3, E = 0; if r3 ≤ R < r4, E is a parabolic function with force constant 20 kcal mol–1Å–2 and E = 0 kcal·mol–1Å–2 at R = r3; if r4 ≤ R, E is a linear function with the slope of the ‘right-hand’ parabola at the point R = r4.
RESULTS
NMR spectra of wild-type and ΔG-1 microhelixHis
The three types of conformational information obtained from 1H homonuclear NMR are coupling constants, chemical shifts and NOE values. In standard A-form RNA, the H1′–H2′ 3JH–H coupling constant lies between 0 and 1 Hz and is undetectable in a COSY experiment. The presence of H1′–H2′ cross-peaks in a COSY spectrum, therefore, denotes a conformation other than A-form helix. Both the mutant and wild-type microhelices display cross-peaks for the UUCG tetraloop and residues C20, C21 and A22 from the single-stranded 3′ end (data not shown). Interestingly, a cross-peak for C19 does not appear in the mutant spectrum, despite its now being unpaired. The absence of a cross-peak is consistent with the ribose of C19 being in the C3′-endo conformation.
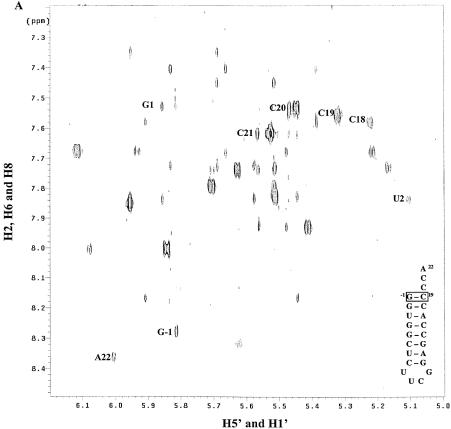
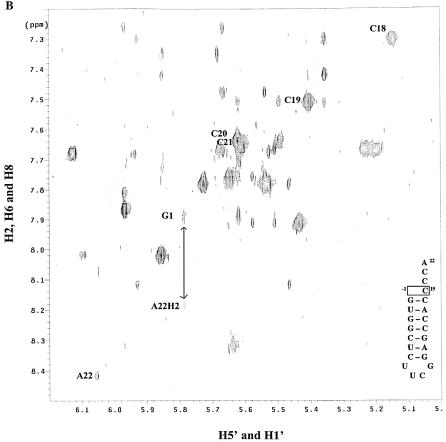
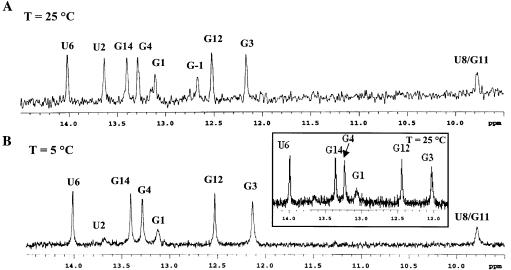
In evaluating chemical-shift changes between the wild-type and mutant microhelices, C18, C19, C20 and U2 had significant migrations. The H5–H6 NOESY cross-peaks for these residues are labeled in Figure 2. Both H5 and H6 of C20 show an increase in chemical shift in going from the wild type to mutant, while those of C18 decrease. The H5 chemical shift of C19 increases, while the H6 shift decreases. In aromatic systems, ring current shifts due to changes in the stacking of the single-stranded bases generally result in such migrations, but the observed shift of U2, which is in the helical stem region, is surprising. The H5 chemical shift for U2 migrates to that of water and thus is absent from the mutant spectrum due to solvent suppression. Analysis of the imino region of the one-dimensional 1H spectrum shows only very weak peaks corresponding to the G1 and U2 iminos for the mutant at 25°C (Fig. 3B, inset). Fraying of the ends of the helix would be expected to increase the exchange with solvent and result in loss of these signals. Consistent with this hypothesis, we observe that reduction in temperature to 5°C eventually slows the exchange of these protons so that they become more clearly visible (Fig. 3B). Fraying was not apparent in the wild-type microhelix at 25°C (Fig. 3A).
Figure 2.
NOESY spectra at 25°C, 800 MHz and 150 ms mixing time for (A) wild-type and (B) ΔG-1 mutant microhelixHis in D2O. The positions of cross-peaks corresponding to nucleotides discussed in the text are labeled to the left of the cross-peak. The arrow indicates a weak interstrand NOE present only in the mutant.
Figure 3.
Imino region of 1H spectrum at 800 MHz in 90% H20/10% D2O for (A) wild-type and (B) ΔG-1 mutant microhelixHis obtained at 25 and 5°C, respectively. The imino region of the ΔG-1 mutant at 25°C is shown in the inset to (B).
Analysis of the NOESY data resulted in the expected NOEs for the helical and tetraloop regions (27). For the single-stranded region, cross-peaks demonstrating proximity between the 5′ and 3′ ends were found only in the mutant microhelix: A22-H2 to G1-H1′ (Fig. 2B, arrow), and A22-H2 to G1-H8 (data not shown). In all, 257 distance restraints for the wild-type microhelix and 154 restraints for the ΔG-1 microhelix were generated and used in the MD structure calculations.
Distance restraints for the microhelix termini
The number and nature (inter- or intranucleotide) of distance restraints derived from unambiguous assignment of NOEs for the single-stranded tail and first base pair of each RNA acceptor stem are separately tabulated in Table 1. An intranucleotide restraint refers to the interaction either between the base and its ribose unit or within the same ribose unit. Internucleotide restraints refer to interactions between a base and another ribose unit, e.g. A22 base and C21 ribose. For example, A22 in the wild type had five intranucleotide and three internucleotide restraints. Lack of restraints does not necessarily mean that no NOEs exist for a given nucleotide; in some instances cross-peaks were too overlapped to accurately measure their volumes and calculate a distance.
Table 1. Numbers of inter- and intranucleotide distance constraints for the microhelix terminia.
| Wild type | ΔG-1 mutant | |||||||
|---|---|---|---|---|---|---|---|---|
| Inter | A22 | 3 | A22 | 2 | ||||
| Intra | 5 | 1 | ||||||
| Inter | C21 | 4 | C21 | 0 | ||||
| Intra | 6 | 0 | ||||||
| Inter | C20 | 5 | C20 | 5 | ||||
| Intra | 8 | 1 | ||||||
| Inter | G-1 | 4 | C19 | 11 | C19 | 5 | ||
| Intra | 9 | 9 | 5 | |||||
| Inter | G1 | 8 | C18 | 9 | G1 | 2 | C18 | 2 |
| Intra | 2 | 7 | 6 | 5 | ||||
aDistance constraints are counted only once, with the value assigned to the higher-numbered nucleotide (e.g. for an NOE between A22 and C21, the value is assigned to A22). All constraints were generated from NOEs, except for three internucleotide constraints included for each of the wild-type base pairs, since the 1H spectra show their imino protons to be hydrogen bonded.
Evaluation of structural restraints
To assess the sufficiency of NMR restraints, protocol 1 with different random number seeds was used to generate 100 structures, and their mutual RMSDs were calculated. Beginning from an A-form RNA stem and a canonical tetraloop, the microhelices were heated to a temperature of 600 K and cooled to 100 K with the imposition of NMR distance restraints. The resulting structures were superimposed using the ‘suppose’ module of NAB (28), which computes the overall pairwise RMSD between structures along with the pairwise deviation of each structure from the mean coordinate set (Table 2).
Table 2. Pairwise RMSDs for the wild-type and mutant microhelixHis structures generated using simulated annealing.
| Wild type | Mutant | |
|---|---|---|
| All atoms | ||
| RMSD between structures (Å) | 2.239 | 5.444 |
| RMSD from mean (Å) | 1.577 | 3.882 |
| ss region | ||
| RMSD between structures (Å) | 4.031 | 8.418 |
| RMSD from mean (Å) | 2.846 | 5.956 |
| Hairpin | ||
| RMSD between structures (Å) | 1.823 | 4.531 |
| RMSD from mean (Å) | 1.282 | 3.251 |
| No. of distance restraints | 257 | 154 |
| No. of restraints per residue | ∼11 | 7 |
The pairwise RMSD between the wild-type microhelix structures averaged 2.239 Å, and the average RMSD from the mean structure was 1.577 Å. The ΔG-1 mutant average RMSD between structures was 5.444 Å, and the average RMSD from the mean was 3.882 Å. The microhelices were then superimposed pairwise over just the single-stranded region and the remaining hairpin region. The RMSDs of those superimpositions are summarized in Table 2. The single-stranded regions are indeed mobile, and contribute substantially to individual RMSDs. When the 100 wild-type structures were aligned, the RMSD of just the single-stranded region was 4.031 Å, while it was 1.823 Å for the hairpin region. For the mutant, the single-stranded RMSD was 8.418 Å and the hairpin RMSD was 4.531 Å.
NMR structure calculations
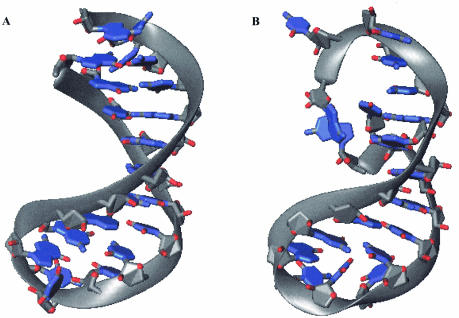
The NMR-derived structures of the wild-type and ΔG-1 microhelices following protocols 1, 2 and 3 are shown in Figure 4. Starting with a canonical A-form RNA helix, the structure calculation methodology applied a standard dynamical simulated annealing consisting of several runs using the generalized Born solvation model as implemented in AMBER (18–21). In protocol 3, this was followed by MD simulations in explicit solvent and Na+ ions while the NMR restraints were relaxed and reimposed. At the end of protocol 3, the MD simulation results showed 124 distance violations of average 0.23 Å for the wild-type microhelix and 60 distance violations of average 0.21 Å for the mutant microhelix. The wild type had nine violations greater than 0.5 Å and none over 1.0 Å. The mutant had only one violation over 0.5 Å (which was also less than 1.0 Å). By first reducing the NMR restraint weights and then gradually increasing them back to 100%, the RMSD of the restraint violations was reduced from 0.220 to 0.195 Å for the wild type and from 0.215 to 0.154 Å for the ΔG-1 mutant.
Figure 4.
NMR structures of (A) wild-type and (B) ΔG-1 mutant microhelixHis. The average structures over the last 200 ps of MD simulations with full NMR restraints generated using protocol 3 are shown. Hydrogen atoms are not displayed.
3′ terminus
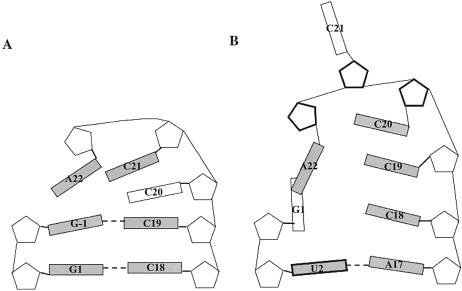
A schematic illustration indicating the base orientations and the sugar puckerings for the nucleotides in the single-stranded tail region, CCA-3′ and CCCA-3′, of the wild-type and mutant microhelices, respectively, is shown in Figure 5. The final two base pairs are also shown in each case. In the wild-type microhelix, as soon as the restraints are imposed, the C20 base flips out of the stacking plane toward the minor groove side resulting in the intrastrand stacking of C21 onto C19. The bases of the single-stranded region are oriented such that base A22 cross-strand stacks onto G-1. As the simulation progresses, there is minimal conformational change associated with the base orientations during either the removal or imposition of restraints. Thus the wild-type microhelix has a well-defined stacked fold-back conformation of the CCA-3′ single-stranded tail.
Figure 5.
Schematic representations of base orientations in the single-stranded region and the first two base pairs in the acceptor stem of (A) wild-type and (B) ΔG-1 mutant histidine microhelices. Riboses are represented as pentagons and bases as rectangles. Bold pentagons represent C2′-endo puckering of the sugar and C3′-endo otherwise. Bold rectangles represent bases in syn orientation about the glycosidic bond and anti otherwise. Shaded rectangles indicate bases oriented in the same plane and unshaded rectangles indicate that the base is oriented behind the plane. Base pairing is shown as horizontal dashed lines.
The 3′ single-stranded region of the mutant microhelix, by contrast, adopts a much less well-defined fold-back conformation in which A22 stacks onto G1, and in the process disrupts the Watson–Crick base pairing between G1 and C18. The G1 base is oriented perpendicular to the Watson–Crick base-pairing plane of the RNA stem, as is base A22. Nucleotides C19 and C20 stack onto C18 as a continuation of the stacking interaction in the stem region, while C21 is flipped out of the RNA. A22 does not form any specific base-pairing interactions, but instead base stacks over G1 during the MD run. This stacking might induce the observed end-fraying of the helix. As the simulation progresses in protocol 3, and as the restraint weights are reduced, the base-pairing interaction between U2 and A17 is also perturbed. When the restraints are completely removed, U2 flips out of its base-pairing plane and stacks onto A22. Reintroduction of the restraint weights restores the base pairing.
Stem–loop region
The stem–loop regions of both microhelices adopt canonical A-form RNA stem-like conformations, with a RMSD of only 1.79 Å between the wild-type and mutant stem loops (defined here as the residues excluding the single-stranded region and the first one or two base pairs in the mutant and wild-type microhelices, respectively). This observation shows that the large structural differences between the two are localized to the remaining regions. The sugar puckers are predominantly C3′-endo, except for residues U9 and C10 in the U8U9C10G11 tetraloop which have C2′-endo puckerings. This is in agreement with previous observations for UUCG tetraloops (27,29).
Removal of NMR restraints
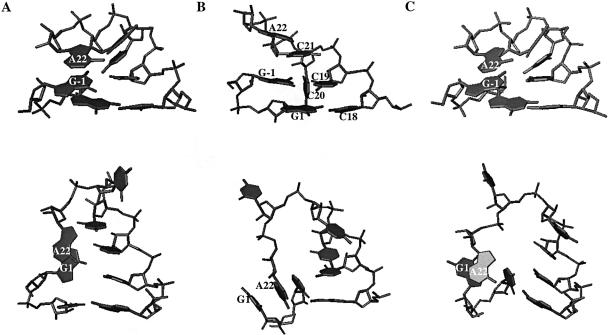
To ascertain the importance of NMR restraints in defining the microhelix structure, starting from the structure generated at the end of protocol 2 (Fig. 6A), the restraint weights were gradually reduced by 10% every 100 ps and were completely removed at the end of 1.0 ns of MD. At this point, the system was simulated for an additional 200 ps with no restraints. For comparison, the RNA structures generated at the end of protocol 2 (Fig. 6A), after complete removal of restraint weights (Fig. 6B) and after protocol 3 (Fig. 6C) are shown for the wild-type (Fig. 6, top) and ΔG-1 (Fig. 6, bottom) microhelices.
Figure 6.
Structures of wild-type (top) and ΔG-1 mutant (bottom) histidine microhelices showing just the single-stranded region and the first two base pairs in the acceptor stem. (A) Structures generated at the end of protocol 2; (B) structures generated after completely relaxing NMR restraints at the rate of 10% every 200 ps; (C) structures generated by reimposing NMR restraints to the 20% restraint-reduced structure. Hydrogen atoms are not displayed.
Following complete removal of restraints, the wild-type microhelix stacks C21 on top of C19. C20 is not involved in any stacking interactions, but instead is oriented along the minor groove (Fig. 6B, top). At the beginning of the simulations, A22 is stacked on top of G-1 (Fig. 6A, top). However, after the final 200 ps of unrestrained MD simulations this cross-strand stacking is lost and the terminal base is now stacked on top of C21 (Fig. 6B, top). The base-pairing interactions in the remaining RNA stem are unperturbed throughout the simulations.
In the case of the mutant, initially G-1 and A22 are stacked together and aligned perpendicular to the other base-pairing residues in the stem (Fig. 6A, bottom). C20 is stacked on top of C19, which is stacked on top of C18. C18 is in turn stacked on top of A17, maintaining the stacking interaction in that strand. C21 has no stacking interaction whatsoever and is aligned perpendicular to the stacking plane, which can be attributed to the lack of any restraints for this residue. As the simulation progresses, and as the restraint weights are reduced, the base-pairing interaction between U2 and A17 is disrupted, making U2 flip out of its base-pairing plane and stack onto A22. Eventually, after 1.2 ns of MD simulation, A22 is stacked in between G1 and U2 (Fig. 6B, bottom). Thus releasing the NMR restraints does not hold the NMR structure for either of the microhelices, emphasizing the importance of restraints in defining the structure.
When the restraint weights are gradually increased back to 100%, the NMR structure of the wild-type microhelix is identical to the one obtained at the end of protocol 2 (Fig. 6C, top). However, the structure of the ΔG-1 microhelix, after reimposing the restraint weights to the maximum, shows variability with respect to the CCCA-3′ tail owing to the flexibility of the single-stranded loop region (Fig. 6C, bottom).
NMR restraint violations
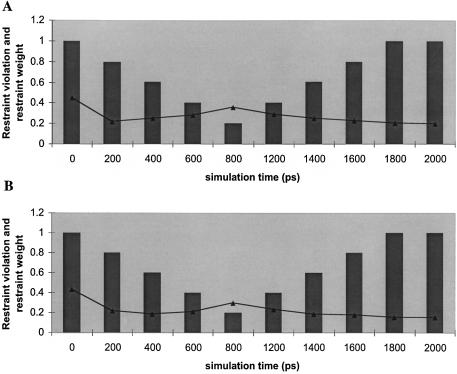
The corresponding NMR restraint violations (in angstroms) from their target values, for the wild-type and ΔG-1 microhelices were calculated every 200 ps of MD and plotted as a function of simulation time (Fig. 7A and B). As the simulations progressed, the distance penalties decreased for the first 200 ps and then increased with reduced restraint weights. Reimposing the restraints further reduced the violations. Thus the initial restraint violations were higher than the values obtained when we relaxed and reimposed restraints. We note that the absolute values of restraint violations are larger for the wild type than the mutant because of the larger number of restraints imposed in the former.
Figure 7.
Plots of NMR restraint violations versus time for (A) wild-type and (B) ΔG-1 mutant histidine microhelices. The structures used for calculating restraint violations were taken at 200 ps intervals from the MD simulations in which the restraint weights were reduced and then increased (protocol 3). Restraint violations are in angstroms and are shown by the lines. Restraint weights are in fractions and are indicated by the vertical bars.
DISCUSSION
Pyrimidine in discriminator position
In tRNAHis, the presence of a cytosine in the discriminator position may direct the 3′ end of the tRNA into a fold-back conformation, just as uracil has been shown to do (30,31). For example, Puglisi et al. (30) have shown that the identity of the discriminator base dictates the conformation of an E.coli formyl methionine derived microhelix. In that case, a microhelixfMet variant with the sequence ACCA-3′ forms a structure in which the four bases extend the stacking interaction of the acceptor stem, while a microhelix with the sequence UCCA-3′ forms a structure in which the single-stranded region folds back to place the 3′ terminal A22 in close proximity to the G1 base in the opposite strand of the stem. In the latter structure, the two NOEs observed between A22 and G1, namely, A22-H2 to G1-H1′ and A22-H1′ to G1-H1′, were also observed in the ΔG-1 mutant studied here (Fig. 2B and data not shown). Surprisingly, similar NOEs to G-1 were not observed in the wild-type microhelixHis, which adopts an even more well defined stacked fold-back conformation. Nevertheless, it was ascertained that the stacked fold-back structure in the wild-type system was due to the three internucleotide NOEs, including NOEs observed between A22-H8 to C21-H2′ and C21-H3′.
An NMR-derived fold-back structural model of the tRNACys acceptor stem has also been proposed by Hou et al. (31), who studied E.coli microhelixCys containing a U73 discriminator base. In this structure, the UCCA-3′ tail adopts a fold-back conformation that places A76 and G1 in close proximity (31). In addition to the two above-mentioned NOEs, these authors observed six additional weak NOEs between residues A76 and G1. The predominant sugar puckering of the UCCA-3′ tail was C2′-endo, in agreement with that observed for the ΔG-1 mutant microhelixHis single-stranded region. A significant structural difference in the vicinity of the single-stranded region between ΔG-1 microhelixHis and microhelixCys is the flipping out of residue G1 resulting in end-fraying. In particular, the G1:C18 base pair of ΔG-1 microhelixHis is disrupted and G1 is flipped by 90º to form interactions with A22. Thus the fold-back conformation of the ΔG-1 microhelixHis mutant is accompanied by a less stable frayed helical end.
The G-1 extra base in microhelixHis appears to have several structural consequences. Himeno et al. (6) proposed that G-1 controls the spatial positioning of C73 and the precise orientation of the single-stranded CCA-3′ tail of tRNAHis with respect to HisRS in the transition state. The positioning of the major groove amino group of C73 is, however, unperturbed in the ΔG-1 microhelix when compared with the wild-type, suggesting a role for RNA 3′ end fold recognition by HisRS rather than appropriate positioning of C73 functional groups. Deletion of G-1 removes the critical 5′-phosphate functional group (7), and also eliminates functional contacts with the G-1 base itself, which play a more minor role in HisRS recognition (A.E.Rosen and K.Musier-Forsyth, submitted).
Folding of tRNA 3′-single-stranded region
The fold of purine73-containing 3′ ends, such as the ACCA-3′ tail in the NMR structure of microhelixAla, differ from the fold observed for pyrimidine73-containing microhelices. In the case of microhelixAla, significant stacking interactions are observed between A73, C74 and C75, in addition to the partial stacking of the discriminator purine (A73) onto G1 in the opposite strand (32). Likewise, the discriminator base G73 in the GCCA-3′ tail of tRNALys is involved in a cross-strand stacking interaction with G1 in addition to the continuation of the A-form-like stacking of the single-stranded region (33).
In the three-dimensional structure of yeast aspartyl tRNA, the GCCA-3′ tail adopts a canonical A-form structure, with no evidence of cross-strand stacking (34,35), similar to the ACCA-3′ tail region of yeast tRNAPhe (36). Previous NMR and UV melting studies on the human microhelixLeu and an A to G discriminator base variant have shown a destabilization of the terminal G1:C20 base pair in the latter in spite of assuming similar conformations of their CCA-3′ ends (37). Hence the G discriminator base has been proposed to be responsible for melting the first base pair in the acceptor stem for making contacts with the synthetase.
Hence the only known 3′-single-stranded regions of uncomplexed tRNAs to exhibit conformations in which the terminal A folds back toward the 5′-G1 (or G-1) are those of wild-type and ΔG-1 microhelixHis, microhelixCys and a U73-microhelixfMet variant. In all cases, there exists a pyrimidine in the discriminator position. Based on our NMR and MD studies, we propose that an important role of the extra G-1 base, found only in tRNAHis, is to stabilize the helical portion of the acceptor stem and the stacked fold-back conformation of the CCCA-3′ tail.
T4 RNA-ligase induced circularization
T4 RNA-ligase, an enzyme that catalyzes the ATP-dependent ligation of 5′-phosphate and 3′-hydroxyl termini of single-stranded RNA or DNA to form a 3′–5′-diphosphate, was used to probe the proximity between the 3′ and 5′ ends of wild-type and ΔG-1 histidine microhelices. In neither case did the RNA circularize (A.E.Rosen and K.Musier-Forsyth, unpublished observations). In the studies performed by Hou et al. (31) on microhelixCys, circularization of the same two termini was observed. In the case of the histidine microhelices, the orientations of the two terminal bases was likely not optimal for the ligation reaction. During the course of the MD simulations, the average distance between the 5′-OH and the 3′-OH ends was calculated to be 11.8 ± 1.1 Å for the mutant and 9.3 ± 0.5 Å for the wild-type, which rationalizes the lack of joining in spite of the fold-back conformation.
Choice of computational methodology
As reported in Table 1, the average number of inter- and intranucleotide distance restraints determined for the wild-type microhelix (11 per base) is much larger than the number measured for the ΔG-1 mutant (seven per base). In fact, this number explains the high RMSD between the mutant structures generated using protocol 1. To address this situation, protocol 3 was applied to improve the resolution of the single-stranded regions and to arrive at a reasonable structure for the ΔG-1 mutant tRNAHis microhelix. Indeed, our refinement protocol, involving relaxing and reimposing of NMR restraints during MD simulations with explicit solvent molecules, did prove effective in reducing the restraint violations and helped define the NMR structure of the mutant in spite of a paucity of restraints.
We were also interested to see if relaxing and reimposing NMR restraint weights would take the trajectory back to the initial NMR structure, but this did not prove to be the case. Instead, the extended MD simulations improved the quality of the structure and decreased restraint violations. Analysis of violation of NMR restraints as a function of simulation time for both wild-type and ΔG-1 mutant microhelixHis suggests that a quick refinement protocol, which includes 20 ps of simulated annealing and 200 ps of MD simulations in explicit solvent with restraints, seems to perform comparably with the lengthy refinement followed in this study (Fig. 7). The long-term refinement does have its advantages with respect to decreasing NMR penalties, however, particularly in exploring a larger conformational space when the restraints are insufficient to precisely determine the solution structure.
CONCLUSIONS
To gain insights into the role of the extra G-1 residue in tRNAHis, NMR and MD studies were performed on the wild-type and ΔG-1 mutant histidine acceptor-stem microhelices. In the NMR study of the mutant microhelix, we observe two important internucleotide NOEs between the 3′-adenine and 5′-guanine residues, showing evidence for the formation of a fold-back conformation placing A22 in close proximity to G1. Structural studies, applying an MD simulation based protocol, confirm the formation of a fold-back conformation in the ΔG-1 microhelix. In the wild-type microhelixHis, the presence of the extra G-1 base stabilizes a more well defined stacked fold-back conformation of the single-stranded CCA-3′ tail. The unique presence of cytosine in the discriminator position of tRNAHis may induce this folding back; congruent observations have been reported for the only other E.coli tRNA with a pyrimidine in the discriminator position, tRNACys. In tRNACys, a folding-back of the UCCA-3′ tail towards the 5′ end is observed in NMR studies (31). Additional evidence for this folding back has been derived from structural characteristics exhibited by the A to U discriminator base mutant of tRNAfMet (30). An evaluation of the computational protocols adopted in this study reveals how well MD simulations perform in refining the structure of an RNA hairpin, and in general, shows the usefulness of MD in defining a structure with a modest set of NMR restraints.
SUPPLEMENTARY MATERIAL
Supplementary Material is available at NAR Online.
Acknowledgments
ACKNOWLEDGEMENTS
We would like to thank the Minnesota Supercomputing Institute (MSI) for computational resources and technical assistance, and Abbey E. Rosen for critical reading of the manuscript. NMR instrumentation was provided with funds from the NSF (BIR-961477), the University of Minnesota Medical School and the Minnesota Medical Foundation. This research was supported by NIH grant GM49928 (K.M.-F.).
REFERENCES
- 1.Crothers D.M., Seno,T. and Söll,G. (1972) Is there a discriminator site in transfer RNA? Proc. Natl Acad. Sci. USA, 69, 3063–3067. [DOI] [PMC free article] [PubMed] [Google Scholar]
- 2.Arnez J.G., Augustine,J.G., Moras,D. and Francklyn,C.S. (1997) The first step of aminoacylation at the atomic level in histidyl-tRNA synthetase. Proc. Natl Acad. Sci. USA, 94, 245–250. [DOI] [PMC free article] [PubMed] [Google Scholar]
- 3.Arnez J.G., Harris,D.C., Mitschler,A., Rees,B., Francklyn,C.S. and Moras,D. (1995) Crystal structure of histidyl-tRNA synthetase from Escherichia coli complexed with histidyl-adenylate. EMBO J., 14, 4143–4155. [DOI] [PMC free article] [PubMed] [Google Scholar]
- 4.Aberg A., Yaremchuk,A., Tukalo,M., Rasmussen,B. and Cusack,S. (1997) Crystal structure analysis of the activation of histidine by Thermus thermophilus histidyl-tRNA synthetase. Biochemistry, 36, 3084–3094. [DOI] [PubMed] [Google Scholar]
- 5.Sprinzl M., Horn,C., Brown,M., Ioudovitch,A. and Steinberg,S. (1998) Compilation of tRNA sequences and sequences of tRNA genes. Nucleic Acids Res., 26, 148–153. [DOI] [PMC free article] [PubMed] [Google Scholar]
- 6.Himeno H., Hasegawa,T., Ueda,T., Watanabe,K., Miura,K. and Shimizu,M. (1989) Role of the extra G-C pair at the end of the acceptor stem of tRNA(His) in aminoacylation. Nucleic Acids Res., 17, 7855–7863. [DOI] [PMC free article] [PubMed] [Google Scholar]
- 7.Fromant M., Plateau,P. and Blanquet,S. (2000) Function of the extra 5′-phosphate carried by histidine tRNA. Biochemistry, 39, 4062–4067. [DOI] [PubMed] [Google Scholar]
- 8.Francklyn C. and Schimmel,P. (1990) Enzymatic aminoacylation of an eight-base-pair microhelix with histidine. Proc. Natl Acad. Sci. USA, 87, 8655–8659. [DOI] [PMC free article] [PubMed] [Google Scholar]
- 9.Francklyn C., Shi,J. and Schimmel,P. (1992) Overlapping nucleotide determinants for specific aminoacylation of RNA microhelices. Science, 255, 1121–1125. [DOI] [PubMed] [Google Scholar]
- 10.Yan W. and Francklyn,C. (1994) Cytosine 73 is a discriminator nucleotide in vivo for histidyl-tRNA in Escherichia coli. J. Biol. Chem., 269, 10022–10027. [PubMed] [Google Scholar]
- 11.Giegé R., Sissler,M. and Florentz,C. (1998) Universal rules and idiosyncratic features in tRNA identity. Nucleic Acids Res., 26, 5017–5035. [DOI] [PMC free article] [PubMed] [Google Scholar]
- 12.Beuning P.J. and Musier-Forsyth,K. (1999) Transfer RNA recognition by aminoacyl-tRNA synthetases. Biopolymers, 52, 1–28. [DOI] [PubMed] [Google Scholar]
- 13.Clore G.M. and Gronenborn,A.M. (1985) Probing the three-dimensional structures of DNA and RNA oligonucleotides in solution by nuclear Overhauser enhancement measurements. FEBS Lett., 179, 187–197. [DOI] [PubMed] [Google Scholar]
- 14.Van de Ven F.J.M. and Hilbers,C.W. (1988) Nucleic acids and nuclear magnetic resonance. Eur. J. Biochem., 178, 1–38. [DOI] [PubMed] [Google Scholar]
- 15.Wüthrich K. (1986) NMR of Proteins and Nucleic Acids. John Wiley, New York, NY. [Google Scholar]
- 16.Hwang T.L. and Shaka,A.J. (1995) WATERGATE experiment—WATER suppression by Gradient Tailored Excitation: water suppression that works. Excitation sculpting using arbitrary waveforms and pulsed field gradients. J. Magn. Reson. A, 112, 275–279. [Google Scholar]
- 17.Johnson B.A. and Blevine,R.A. (1994) NMRView: a computer program for the visualization and analyses of NMR Data. J. Biomol. NMR, 4, 603–614. [DOI] [PubMed] [Google Scholar]
- 18.Still W.C., Tempczyk,A., Hawley,R.C. and Hendrickson,T. (1990) Semianalytical treatment of solvation for molecular mechanics and dynamics. J. Am. Chem. Soc., 112, 6127–6129. [Google Scholar]
- 19.Hawkins G.D., Cramer,C.J. and Truhlar,D.G. (1995) Pairwise solute screening of solute charges from a dielectric medium. Chem. Phys. Lett., 246, 122–129. [Google Scholar]
- 20.Bashford D. and Case,D.A. (2000) Generalized born models of macromolecular solvation effects. Annu. Rev. Phys. Chem., 51, 129–152. [DOI] [PubMed] [Google Scholar]
- 21.Pearlman D.A., Case,D.A., Caldwell,J.W., Ross,W.S., Cheatham,T.E., Debolt,S., Ferguson,D.M., Seibel,G. and Kollman,P.A. (1995) AMBER, a package of computer programs for applying molecular mechanics, normal mode analysis, molecular dynamics and free energy calculations to simulate the structural and energetic properties of molecules. Comput. Phys. Commun., 91, 1–41. [Google Scholar]
- 22.Cornell W.D., Cieplak,P., Bayly,C.I., Gould,I.R., Merz,K.M.J., Ferguson,D.M., Spellmeyer,D.C., Fox,T., Caldwell,J.W. and Kollman,P.A. (1995) A second generation force field for the simulation of proteins and nucleic acids. J. Am. Chem. Soc., 117, 5179–5197. [Google Scholar]
- 23.Jorgensen W.L., Chandrasekhar,J. and Madura,J. (1983) Comparison of simple potential functions for simulating liquid water. J. Chem. Phys., 79, 926–935. [Google Scholar]
- 24.Essmann U., Perera,L., Berkowitz,M.L., Darden,T. and Pedersen,L.G. (1995) A smooth particle mesh Ewald method. J. Chem. Phys., 103, 8577–8593. [Google Scholar]
- 25.Berendsen H.J.C., Postma,J.P.M., vanGunsteren,W.F., DiNola,A. and Haak,J.R. (1984) Molecular dynamics with coupling to an external bath. J. Chem. Phys., 81, 3684–3690. [Google Scholar]
- 26.Ryckaert J.P., Ciccotti,G. and Berendsen,H.J.C. (1977) Numerical integration of the Cartesian equations of motion of a system with restraints: molecular dynamics of n-alkanes. J. Comput. Phys., 23, 327–342. [Google Scholar]
- 27.Varani G., Cheong,C. and Tinoco,I.,Jr (1991) Structure of an unusually stable RNA hairpin. Biochemistry, 30, 3280–3289. [DOI] [PubMed] [Google Scholar]
- 28.Macke T. and Case,D.A. (1998) Modeling unusual nucleic acid structures. In Leontes,N.B. and SantaLucia,J.,Jr (eds), Molecular Modeling of Nucleic Acids. American Chemical Society, Washington, DC, pp. 379–393. [Google Scholar]
- 29.Cheong C., Varani,G. and Tinoco,I.,Jr (1990) Solution structure of an unusually stable RNA hairpin, 5′GGAC(UUCG)GUCC. Nature, 346, 680–682. [DOI] [PubMed] [Google Scholar]
- 30.Puglisi E.V., Puglisi,J.D., Williamson,J.R. and RajBhandary,U.L. (1994) NMR analysis of tRNA acceptor stem microhelices: discriminator base change affects tRNA conformation at the 3′ end. Proc. Natl Acad. Sci. USA, 91, 11467–11471. [DOI] [PMC free article] [PubMed] [Google Scholar]
- 31.Hou Y.-M., Zhang,X., Holland,J.A. and Davis,D.R. (2001) An important 2′-OH group for an RNA–protein interaction. Nucleic Acids Res., 29, 976–985. [DOI] [PMC free article] [PubMed] [Google Scholar]
- 32.Ramos A. and Varani,G. (1997) Structure of the acceptor stem of Escherichia coli tRNAAla: role of the G3(U70 base pair in synthetase recognition. Nucleic Acids Res., 25, 2083–2090. [DOI] [PMC free article] [PubMed] [Google Scholar]
- 33.Cusack S., Yaremchuk,A. and Tukalo,M. (1996) The crystal structure of T.thermophilus lysyl-tRNA synthetase complexed with E.coli tRNA(Lys) and a T.thermophilus tRNA(Lys) transcript: anticodon recognition and conformational changes upon binding of a lysyl-adenylate analogue. EMBO J., 15, 6321–6334. [PMC free article] [PubMed] [Google Scholar]
- 34.Cavarelli J., Rees,B., Ruff,M., Thierry,J.C. and Moras,D. (1993) Yeast tRNA(Asp) recognition by its cognate class II aminoacyl-tRNA synthetase. Nature, 362, 181–184. [DOI] [PubMed] [Google Scholar]
- 35.Comarmond M.B., Giegé,R., Thierry,J.C., Moras,D. and Fischer,J. (1986) Three-dimensional structure of yeast tRNA-Asp. I. Structure determination. Acta Crystallogr. B, 42, 272–280. [Google Scholar]
- 36.Quigley G.J. and Rich,A. (1976) Structural domains of transfer RNA molecules. Science, 194, 796–806. [DOI] [PubMed] [Google Scholar]
- 37.Metzger A.U., Heckl,M., Willbold,D., Breitschopf,K., RajBhandary,U.L., Rosch,P. and Gross,H.J. (1997) Structural studies on tRNA acceptor stem microhelices: exchange of the discriminator base A73 for G in human tRNALeu switches the acceptor specificity from leucine to serine possibly by decreasing the stability of the terminal G1-C72 base pair. Nucleic Acids Res., 25, 4551–4556. [DOI] [PMC free article] [PubMed] [Google Scholar]
Associated Data
This section collects any data citations, data availability statements, or supplementary materials included in this article.


