

Summary
Eukaryotic cell proliferation is controlled by growth factors and essential nutrients, in the absence of which cells may enter into a quiescent (G0) state. In yeast, nitrogen and/or carbon limitation causes downregulation of the conserved TORC1 and PKA signaling pathways and consequently activation of the PAS kinase Rim15, which orchestrates G0 program initiation and ensures proper life span by controlling distal readouts including the expression of specific genes. Here, we report that Rim15 coordinates transcription with posttranscriptional mRNA protection by phosphorylating the paralogous Igo1 and Igo2 proteins. This event, which stimulates Igo proteins to associate with the mRNA decapping activator Dhh1, shelters newly expressed mRNAs from degradation via the 5′-3′ mRNA decay pathway thereby enabling their proper translation during initiation of the G0 program. These results delineate a likely conserved mechanism by which nutrient limitation leads to stabilization of specific mRNAs that are critical for cell differentiation and life span.
Introduction
Regulation of cell proliferation and growth in response to extracellular cues like growth factors, hormones and/or nutrients critically affects development and life span in virtually every biological system examined (Gray et al., 2004; Kolter et al., 1993; Malumbres and Barbacid, 2001). In the absence of stimulatory signals, cells may enter into a reversible quiescence (or G0) state that is typically characterized by low metabolic activity, including low rates of protein synthesis and transcription. While in metazoans quiescence is induced following limitation of growth factors and hormones, in simpler, unicellular organisms quiescence is primarily triggered by nutrient limitation to ensure maximal long-term survival (also referred to as chronological life span [CLS]). Despite the universal importance of the quiescent state, the mechanisms regulating entry into, survival in, and exit from quiescence remain poorly understood.
Initiation of the quiescence program in yeast includes a general downregulation of protein synthesis, specifically at the level of ribosome biogenesis, mRNA stability, and translation initiation factor activities (De Virgilio and Loewith, 2006). In parallel, activation of autophagy serves to recycle surplus cytoplasmic mass and to turn over ribosomes and mitochondria, thereby contributing to both reduction of cellular energy consumption and cell growth arrest upon G0 entry (Abeliovich and Klionsky, 2001). Distinct additional hallmarks of quiescent yeast cells include high levels of both the storage carbohydrate glycogen and the stress protectant trehalose and increased expression of specific genes whose products are likely involved in different aspects of stress tolerance and CLS (Gray et al., 2004).
Initiation of the yeast quiescence program requires downregulation of conserved nutrient-responsive signal transduction pathways. Specifically, inhibiting the kinase activities of the Target Of Rapamycin Complex 1 (TORC1) or the protein kinase A (PKA) drive cells into a quiescent-like state and significantly extend CLS (Kaeberlein et al., 2007; Powers et al., 2006). In contrast, reducing the kinase activity of Rim15 precludes access to quiescence and decreases CLS (Fabrizio et al., 2001; Reinders et al., 1998; Wei et al., 2008). While TORC1 (via its substrate Sch9) and PKA signal in parallel pathways to positively regulate ribosome biogenesis and growth (Jorgensen et al., 2004; Urban et al., 2007), they negatively regulate quiescence and CLS by maintaining Rim15 in an inactive state in the cytoplasm (Pedruzzi et al., 2003; Wanke et al., 2008; Wanke et al., 2005). The molecular elements linking Rim15 to distal readouts including the expression of specific nutrient-regulated genes, trehalose and glycogen accumulation, extension of CLS, and induction of autophagy are only partially characterized, but involve the stress-response and post-diauxic shift transcription factors Msn2/4 and Gis1, respectively (Cameroni et al., 2004; Pedruzzi et al., 2000; Wei et al., 2008; Yorimitsu et al., 2007). Rim15 appears to be conserved amongst eukaryotes as it shares homology with the mammalian serine/threonine kinase large tumor suppressor (LATS) (Cameroni et al., 2004; Pedruzzi et al., 2003); PKA, TORC1, and Sch9 have clear orthologs in mammals - mammalian PKA, mTORC1, and S6K, respectively (Powers, 2007).
A recently discovered facet of the yeast quiescence program is that translating mRNAs on polysomes broadly dissociate from certain translation factors, associate with translational repressors, and accumulate as repressed messenger ribonucleoprotein (mRNP) complexes within cytoplasmic granules, also termed processing bodies (P-bodies or PBs) (Brengues et al., 2005; Sheth and Parker, 2003). The possible fate of these mRNAs includes their degradation, repression and/or storage, or dispatch to translation via a transitory stopover in eIF4E-, eIF4G-, and Pab1-containing bodies (EGPBs), which likely correspond to yeast stress granules (SGs) (Buchan et al., 2008; Hoyle et al., 2007; Parker and Sheth, 2007). PBs from yeast to mammals contain a conserved core of proteins consisting of the mRNA decapping machinery, including the decapping enzyme Dcp1/Dcp2, the activators of decapping Dhh1/RCK/DDX6/p54, Pat1, Scd6/RAP55, Edc3, and the heptameric Lsm1-7 complex, and the 5′-3′-exonuclease Xrn1 (Eulalio et al., 2007; Parker and Sheth, 2007). PBs also contain the conserved Ccr4/Pop2/Not1-5 complex that initiates deadenylation of the 3′-poly(A) tail of mRNAs, which, besides allowing 3′ to 5′ degradation of mRNAs by the exosome complex, primarily induces Dcp1/Dcp2-mediated removal of the 5′ end cap structure followed by 5′ to 3′ transcript degradation (Anderson and Kedersha, 2006; Parker and Sheth, 2007). This core of conserved PB components, also coined repression or 5′-3′ mRNA decay machinery, functions in both translation repression and mRNA degradation and competes with the assembly of translational factors (Eulalio et al., 2007; Parker and Sheth, 2007). How nutrient limitation impinges on and regulates this competition remains largely elusive. Moreover, it remains unexplained how specific transcripts can, despite the gradient towards mRNP storage/decay, evade degradation to be translated into proteins during initiation of the G0 program.
Here, we describe the discovery of the paralogous Igo1 and Igo2 proteins and demonstrate that they play an essential role in ensuring proper initiation of the G0 (G-zero) program, hence their name Igo. We show that inhibition of TORC1 induces Igo1 to associate with the decapping activator Dhh1 and additional proteins that are typically assembled on the 3′ untranslated region (UTR) of mRNAs. Notably, the interaction between Dhh1 and Igo1 requires phosphorylation of Igo1 by Rim15 and is key to prevent degradation of newly expressed mRNAs by the 5′-3′ mRNA decay pathway. In all, our data indicate that protection of specific mRNAs represents a conserved aspect of the cellular response to nutrient deprivation, which critically affects cell differentiation and life span.
Results
Igo1 and Igo2 are Direct Targets of the TORC1 Downstream Effector Kinase Rim15
To elucidate how Rim15 regulates initiation of the quiescence program, we identified Rim15 target proteins using the proteome chip array technology (Ptacek et al., 2005). The best hit on these arrays was Igo1, which shares 58% identity over its entire length with the putative paralog Igo2. Both proteins have no assigned function at present, but share significant homology with small (16-20 kDa) proteins of the α-endosulfine family in higher eukaryotes (e.g., ENSA and ARPP-16/19; Dulubova et al., 2001; Figure 1A), which have been implicated in diverse biological processes including insulin secretion (Bataille et al., 1999), oocyte meiotic maturation (Von Stetina et al., 2008), neurodegeneration (Woods et al., 2007), and axon growth (Irwin et al., 2002). The molecular function of these proteins, however, remains poorly understood.
Figure 1. The Protein Kinase Rim15 Directly Phosphorylates Igo1 Both in vitro and in vivo.
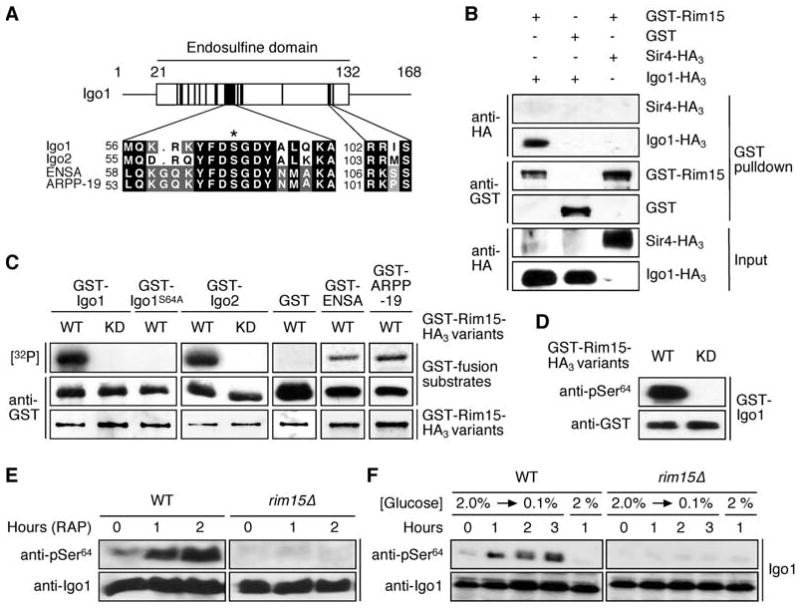
(A) S. cerevisiae Igo1 and Igo2 belong to the conserved family of α-endosulfine proteins. The diagram shows the position of the endosulfine domain within Igo1 with highly conserved subdomains indicated by black boxes. Amino acid sequence alignments of yeast Igo1 and Igo2, and of human ENSA (Swiss-Prot: O43768) and ARPP-19 (Swiss-Prot: P56211) are shown for two of these subdomains. The position of the serine targeted by Rim15 (i.e. Ser64 and Ser63 in Igo1 and Igo2, respectively) is indicated with an asterisk. A conserved PKA consensus phosphorylation site (RR/KXS) is present in the second subdomain.
(B) Rim15 and Igo1 physically interact. GST-Rim15 or GST were pulled down from lysates of wild-type cells coexpressing Igo1-HA3 or, as negative control, Sir4-HA3. Cell lysates (Input) and GST pulldown samples were subjected to SDS-PAGE and immunoblots were probed using anti-HA or anti-GST antibodies.
(C) Rim15 phosphorylates in vitro GST-Igo1, GST-Igo2, GST-ENSA, and GST-ARPP-19, but not GST-Igo1S64A or GST alone. In control experiments, kinase-inactive Rim15KD neither phosphorylated Igo1 nor Igo2. Levels of indicated GST-fusion substrates (purified from E. coli) and of GST-fusion protein kinase variants (GST-Rim15-HA3 [WT] or GST-Rim15KD-HA3 [KD]; purified from yeast) were determined by immunoblot analyses using anti-GST antibodies. [32P] denotes the autoradiograph.
(D) Rim15 specifically phosphorylates Ser64 in Igo1 in vitro. Phosphospecific antibodies directed towards pSer64 in Igo1 recognized bacterially expressed GST-Igo1 following in vitro phosphorylation by active GST-Rim15-HA3 (WT), but not kinase-inactive Rim15KD (KD).
(E, F) In vivo phosphorylation of Ser64 in Igo1 requires the presence of Rim15 and is induced by rapamycin (0.2 μg ml-1) treatment (E) and glucose limitation (F). Levels of Igo1 protein and of Ser64 phosphorylation in Igo1 were determined by immunoblot analyses using polyclonal anti-Igo1 and anti-pSer64 antibodies, respectively.
In line with and extending our proteome chip data, we found that Rim15 physically and specifically interacted with Igo1 in classical pull-down experiments (Figure 1B), and that Rim15, but not kinase-inactive Rim15K823Y (Rim15KD), phosphorylated bacterially expressed Igo1 and Igo2, as well as human ENSA and ARPP-19, in vitro (Figure 1C). Using a combination of mass spectroscopy (MS) and tandem MS analyses on GST-Igo1 samples that had been subjected to in vitro protein kinase assays with Rim15 or Rim15KD, we then identified an evolutionary conserved serine residue (i.e. Ser64) in Igo1, which is phosphorylated by Rim15. A mutant version of Igo1 that had Ser64 replaced by Ala was no longer phosphorylated by Rim15 (Figure 1C), indicating that Ser64 is the only amino acid in Igo1 that is directly phosphorylated by Rim15. To determine whether Ser64 is also a target of Rim15 in vivo, we raised antibodies that were highly specific for a pSer64-containing peptide, as indicated by their ability to recognize bacterially expressed GST-Igo1 that was phosphorylated in vitro by Rim15, but not GST-Igo1 treated with Rim15KD (Figure 1D). Using these phosphospecific anti-pSer64 antibodies, we found that phosphorylation of Ser64 in Igo1 within cells largely depended on the presence of Rim15, and was strongly induced following rapamycin-mediated TORC1 inactivation or a shift of cells to low glucose-containing medium (Figures 1E and 1F), both conditions that expectedly cause Rim15 activation (Pedruzzi et al., 2003; Reinders et al., 1998). Together, these results show that Igo1 is a bona fide Rim15 target and suggest that the corresponding phosphorylation event is evolutionarily conserved.
Igo1 and Igo2 are Critical for Initiation of the G0 Program
Rim15 orchestrates various physiological processes associated with the quiescence program including the accumulation of the storage carbohydrate glycogen, synthesis of trehalose, proper setup of CLS, and the expression of specific nutrient-regulated genes. We therefore evaluated these readouts in cells lacking Igo1 and/or Igo2. Quiescent rim15Δ and igo1Δ igo2Δ double mutants, but not igo1Δ and igo2Δ single mutants, had very low glycogen and trehalose levels (both < 10% of wild-type levels; data not shown) and were equally dramatically reduced for CLS (Figure 2A). To investigate whether Igo1/2, like Rim15, are also implicated in gene expression control, we compared the rapamycin response of wild-type with that of rim15Δ and igo1Δ igo2Δ mutant cells using global transcription analysis. After 180 min of rapamycin treatment, the expression of 478 genes was increased more than 2.8-fold in wild-type cells. Among these, the upregulation of 54 and 103 genes was diminished more than 2-fold in rim15Δ and igo1Δ igo2Δ cells, respectively. Surprisingly, almost all of the Rim15-dependent genes (which are mainly implicated in stress responses, carbohydrate metabolism, and respiration) were comprised within the larger set of Igo1/2-dependent genes (Figure 2B). Thus, while Igo1/2 are important for expression of a small set of Rim15-independent genes, induction of the entire Rim15-dependent gene expression program requires Igo1/2. Corresponding global transcription analyses of glucose-limited cells (during and following the diauxic shift) essentially confirmed this conclusion (Figure 2B and data not shown). Taken together, the simultaneous loss of Igo1 and Igo2 appears to largely phenocopy the loss of Rim15.
Figure 2. Igo1 and Igo2, Like Rim15, are Required for TORC1 to Properly Control Gene Expression and Chronological Life Span.
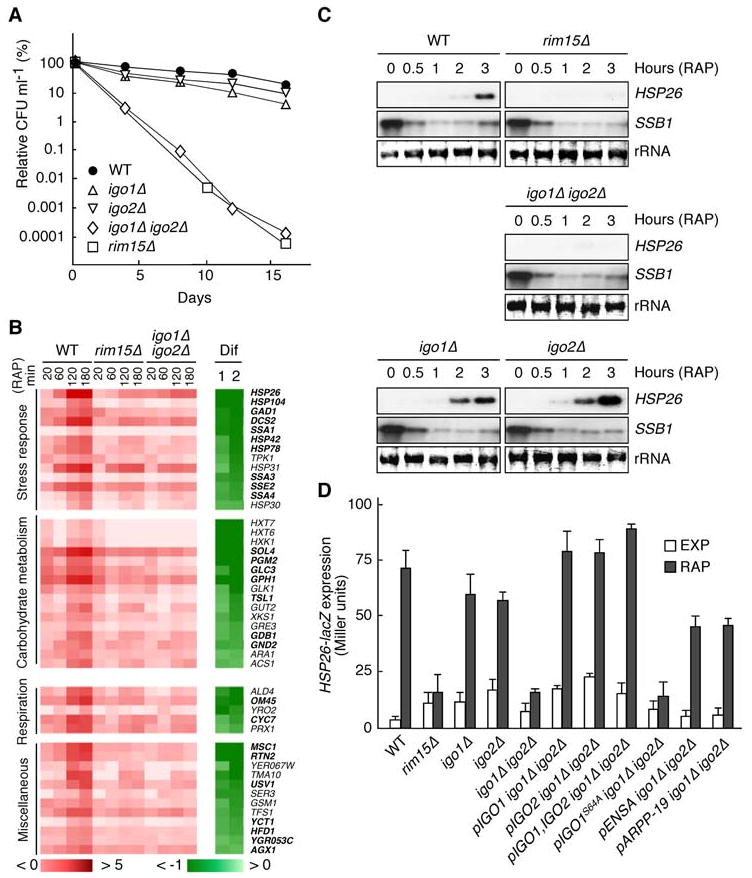
(A) Igo1 and Igo2 are redundant, key determinants of CLS. Survival data (CFU ml-1) are expressed as relative values compared to the values at day 0 (which corresponds to day 4 in early stationary phase cultures). Each data point represents the mean of three samples.
(B) Rim15 and Igo1/2 play a largely overlapping role in mediating the rapamycin-induced expression of a defined set of genes. Wild-type (WT), rim15Δ, and igo1Δ igo2Δ cells were treated with rapamycin (0.2 μg ml-1) for the times indicated and compared by microarray analyses. Genes showing (in wild-type cells) at least a 2.8-fold increase (log2 ratio > 1.5) in expression following rapamycin treatment (180 min) were classified as rapamycin-induced genes and sorted according to the maximal Igo1/2 dependence of their response (Dif 1 = log2 [igo1Δ igo2Δ180/igo1Δ igo2Δ0] - log2 [WT180/WT0]; Dif 2 = log2 [rim15Δ180/rim15Δ0] - log2 [WT180/WT0]). Color codes show the log2 of the expression change relative to untreated cells (red-white) and the corresponding Dif value (green-white). Rim15- and Igo1/2-dependent genes that were (using the same criteria as above) also retrieved in global transcription analyses in glucose-limited (diauxic and postdiauxic) cells are indicated in bold face letters. Northern blot analyses of selected genes confirmed our microarray data (not shown).
(C) Rapamycin-induced expression of HSP26 mRNA depends on Rim15 and Igo1/2. Northern analyses of HSP26 and SSB1 mRNAs were done with exponentially growing WT, rim15Δ, igo1Δ, igo2Δ, and igo1Δ igo2Δ cells prior to and following treatment with rapamycin (0.2 μg ml-1) for the times indicated. All samples were run on the same gel (identical film exposure time). The decrease in SSB1 transcript levels was used as internal control for rapamycin function.
(D) Both rim15Δ and igo1Δ igo2Δ mutants are defective in HSP26-lacZ expression. β-galactosidase activities (expressed in Miller units) were measured to monitor the expression of an HSP26-lacZ fusion gene in exponentially growing cells prior to (EXP) or following rapamycin treatment (RAP; 0.2 μg ml-1; 6 hr). Data are reported as averages (n = 3), with standard deviations (SDs) indicated by the lines above each bar. Relevant genotypes are indicated.
We next assessed quantitatively the role of Igo1/2 in gene expression by studying the induction of HSP26, which is most strongly dependent on Rim15 and Igo1/2 for its expression following rapamycin treatment (Figures 2B and 2C), using an HSP26-lacZ reporter gene that expresses the bacterial β-galactosidase-encoding lacZ gene under the control of the yeast HSP26 promoter. As expected, rapamycin-induced HSP26-lacZ expression was largely defective in both rim15Δ and igo1Δ igo2Δ cells. This defect could be cured in igo1Δ igo2Δ cells by expression of either plasmid-encoded wild-type Igo1 or Igo2, but not by expression of mutant Igo1S64A (Figure 2D), indicating that phosphorylation by Rim15 triggers Igo1 and Igo2, in a redundant manner, to ensure proper expression of a specific set of nutrient-regulated genes. Since both human ENSA and ARPP-19 were able to partially replace Igo1/2 function in yeast (Figure 2D), proteins of this family are likely to share an evolutionary conserved role in gene expression.
TORC1 Regulates the Association of Igo1 with Lsm12 and Dhh1 via Rim15
To further elucidate the molecular function of Igo1/2, we purified in parallel experiments Igo1-TAP and Igo1-myc13 from rapamycin-treated yeast cells and identified co-precipitating proteins via tandem MS. Proteins that specifically bound both Igo1-TAP and Igo1-myc13 included members of the Hsp70 family of proteins (i.e. Ssa1/2 and Ssb1/2) as well as Pbp1, Pbp4, and Lsm12 (Table S3). Interestingly, the latter three proteins have previously been identified as partners within a ribosome-associated protein complex (Fleischer et al., 2006). Pbp1 has originally been characterized as a poly(A)-binding protein Pab1-interactor that is involved in mRNA poly(A)-tail length regulation (Mangus et al., 1998). Like its human homolog ataxin-2 (Ralser et al., 2005), Pbp1 is a member of the Lsm (Like Sm) proteins, which are predicted to function as mRNA-binding proteins that modulate biogenesis, translation, and/or degradation of mRNAs (He and Parker, 2000). Pbp4, which has no clear homolog in higher eukaryotes, was originally identified as Pbp1-interacting protein, but its function remains presently unknown (Mangus et al., 2004). Finally, Lsm12 is an evolutionarily conserved protein of also unknown function, which, like Pbp1, contains an N-terminal Lsm domain (Albrecht and Lengauer, 2004).
We next tried to confirm the interactions between Igo1 and Pbp1, Pbp4, or Lsm12 in pulldown experiments. Since yeast interactome studies indicated that Pbp1 and Lsm12 may share an additional partner, namely the DEAD/H-box RNA helicase Dhh1 (Tarassov et al., 2008), and since the association between Pbp1/ataxin-2 and Dhh1/DDX6 appears to be evolutionary conserved (Nonhoff et al., 2007), we also included Dhh1 in these experiments. In extracts from exponentially growing wild-type cells, Igo1-myc interacted weakly with GST-Pbp1, GST-Pbp4, GST-Lsm12, and GST-Dhh1, but not with GST alone (Figure 3A). Rapamycin treatment strongly increased (by factors of 6.2 - 10.8) the affinity of Igo1-myc for GST-Pbp1, GST-Pbp4, GST-Lsm12, and GST-Dhh1. Notably, while none of these interactions appeared to be sensitive to RNAse treatment (Figure S1), the rapamycin-induced Igo1-myc - GST-Lsm12/-Dhh1 interactions, but not the corresponding Igo1-myc - GST-Pbp1/-Pbp4 interactions, were strongly reduced in the absence of Rim15 or if Igo1-myc harbored the S64A mutation (Figures 3A and 3B). Thus, TORC1 inactivation likely results in the recruitment of Igo1 to Pbp1-/Pbp4-containing mRNA-protein complexes where it may, following phosphorylation by Rim15, associate with Lsm12 and Dhh1.
Figure 3. TORC1 regulates the association of Igo1 with Pbp1, Pbp4, Lsm12, and Dhh1.
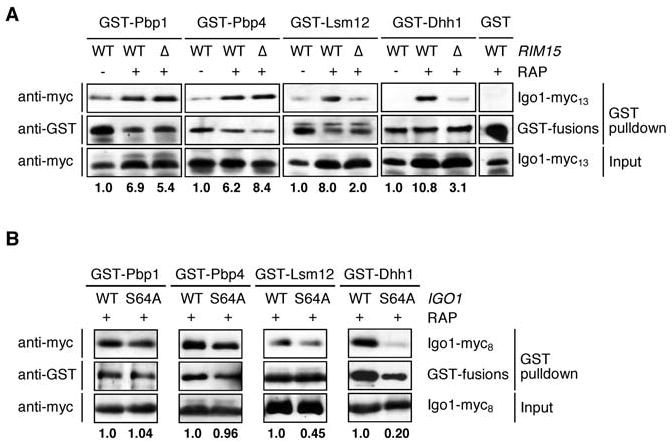
(A) Rapamycin-induced Igo1-Lsm12/-Dhh1 interactions, but not rapamycin-induced Igo1-Pbp1/-Pbp4 interactions, require Rim15. GST-Pbp1, GST-Pbp4, GST-Lsm12, GST-Dhh1, and GST were pulled down from cell lysates of wild-type (WT) or rim15Δ (Δ) strains co-expressing Igo1-myc13. Exponentially growing cells were harvested prior to (-) or following (+) rapamycin treatment (RAP; 0.2 μg ml-1; 2 hr). Cell lysates (Input) and GST pulldown samples were subjected to SDS-PAGE and immunoblots were probed using anti-myc or anti-GST antibodies. Bold numbers below the graph denote the relative level of Igo1-myc13 co-precipitating per corresponding GST-fusion protein (arbitrarily set to 1.0 for each sample derived from exponentially growing cells). For similar experiments with RNAse A treated lysates see Figure S1.
(B) Mutation of Ser64 to Ala in Igo1 strongly reduces the rapamycin-induced Igo1-Lsm12/-Dhh1 interactions, but not the rapamycin-induced Igo1-Pbp1/-Pbp4 interactions. GST-Pbp1, GST-Pbp4, GST-Lsm12, and GST-Dhh1 were pulled down from lysates obtained from rapamycin-treated (RAP; 0.2 μg ml-1; 2 hr) wild-type strains co-expressing either Igo1-myc8 (WT) or Igo1S64A-myc8 (S64A). Cell lysates and GST pulldown samples were treated as in (A). Bold numbers below the graph denote the relative level of Igo1-myc8 or Igo1S64A-myc8 co-precipitating per corresponding GST-fusion protein (arbitrarily set to 1.0 for each sample derived from rapamycin-treated Igo1-myc8-expressing cells).
TORC1 Regulates mRNA Stability via Igo1 and Igo2
Since both Pbp1, by controlling mRNA polyadenylation (Mangus et al., 1998), and Dhh1, by promoting mRNA decapping (Parker and Sheth, 2007), are implicated in regulation of mRNA stability, we hypothesized that Igo1/2 may play a role in stabilizing the substantial subset of rapamycin-induced, Igo1/2-dependent mRNA species (Figure 2B). In line with this assumption, loss of Igo1/2 reduced, on average by 35%, the half-lives of newly transcribed poly(A)+ RNAs in rapamycin-treated, but not in exponentially growing cells (Figure 4). Considering the fact that the bulk of poly(A)+ RNAs isolated from rapamycin-treated cells contained both Igo1/2-dependent and Igo1/2-independent mRNA species, this calculated average mRNA half-live reduction likely underestimates the actual effect of Igo proteins on specific mRNAs. In support of this notion, loss of Igo1/2 reduced the half-live of a specific HSP26-lacZ mRNA by 65% in rapamycin-treated cells (Figure S2).
Figure 4. Igo1 and Igo2 Stabilize mRNAs Following Inactivation of TORC1.
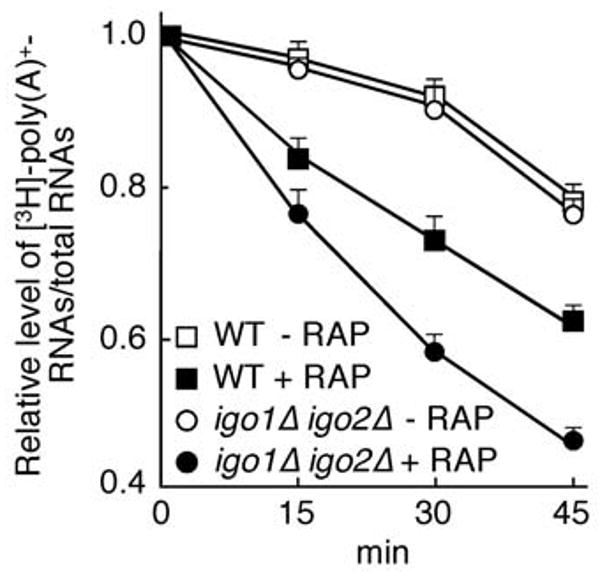
The half-live of total poly(A)+ RNAs was determined in exponentially growing (open symbols) and rapamycin-treated (solid symbols) wild-type (□, ■) and igo1Δ igo2Δ (○, ●) cells using a classical [3H]-uracil pulse-chase labeling protocol. Exponentially growing cells were either treated, or not, with 0.2 μg ml-1 rapamycin for 90 min, subjected to a 30-min [3H]-uracil pulse (in the continuous presence, or absence, of rapamycin), and chased with an excess of cold uracil at time 0. The radioactivity in poly(A)+-RNAs, isolated in each case from 100 μg of [3H]-uracil pulse-labeled total RNAs, was determined by liquid scintillation counting, normalized by the counts in the corresponding total RNA sample, and expressed as relative level of total [3H]-poly(A)+-RNAs/total RNAs (arbitrarily set to 1.0 for each sample at the beginning of the chase period). Data are reported as averages (n = 3), with SDs indicated by the lines above each data point. A non-linear least squares model was fit to determine the half life of total poly(A)+-RNAs. The calculated average half live of total poly(A)+-RNAs was 103 min (± 8 SD) and 98 min (± 7 SD) in exponentially growing wild-type and igo1Δ igo2Δ cells, respectively, and 60 min (± 1 SD) and 39 min (± 1 SD) in rapamycin-treated wild-type and igo1Δ igo2Δ cells, respectively. Igo1/2 also stabilize a specific HSP26-lacZ mRNA following TORC1 inactivation (Figure S2).
Igo1 and Igo2 Shelter HSP26 mRNAs from Degradation via the 5′-3′ mRNA Decay Pathway
To explore the possibility that Igo1/2 may prevent degradation of mRNAs via the 5′-3′ mRNA decay pathway, we determined whether loss of Dhh1 or Ccr4, which prevents mRNA turnover at early steps of PB formation and traps mRNAs in polysomes (Parker and Sheth, 2007), may suppress the defect of igo1Δ igo2Δ and rim15Δ cells in HSP26 expression. Following rapamycin treatment, Dhh1- or Ccr4-deficient cells expressed HSP26 (both at the mRNA and protein levels) to higher levels than wild-type cells, indicating the existence of a futile cycle in which mRNA turnover operates to some extent on newly synthesized mRNAs (Figures 5A and 5B). Remarkably, loss of either Dhh1 or Ccr4 suppressed the defect of igo1Δ igo2Δ cells, but not that of rim15Δ cells, in rapamycin-induced HSP26 expression (again both at the mRNA and protein levels; Figures 5A and 5B). From these results, we infer that Rim15 likely has a dual role in controlling gene expression by (i) activating transcription (via a still partially understood mechanism) and (ii) protecting the corresponding transcripts from degradation via an Igo1/2-dependent mechanism. In line with such a model, loss of the 5′-3′-exonuclease Xrn1, which, in contrast to loss of Dhh1 or Ccr4, causes PBs to increase in number and size due to the entrapping of non-degraded mRNAs (Parker and Sheth, 2007), allowed igo1Δ igo2Δ cells, but not rim15Δ cells, to accumulate HSP26 mRNAs, which then failed to be translated into proteins (Figures 5A and 5B). We confirmed these results independently by using the chimeric HSP26-LacZ gene, the expression pattern of which (measured by northern blot and β-galactosidase activity assays) was comparable to that of the endogenous HSP26 gene in various strains (Figures S3B and 5C). Taken together, our data indicate that Igo1/2 are required to prevent degradation of HSP26 mRNAs via the 5′-3′ mRNA decay pathway, but - as also supported by standard polysome analyses (Figure S4) - are dispensable for translation per se.
Figure 5. The 5′-3′ mRNA Decay Pathway Targets HSP26 mRNAs in igo1Δ igo2Δ Mutants.
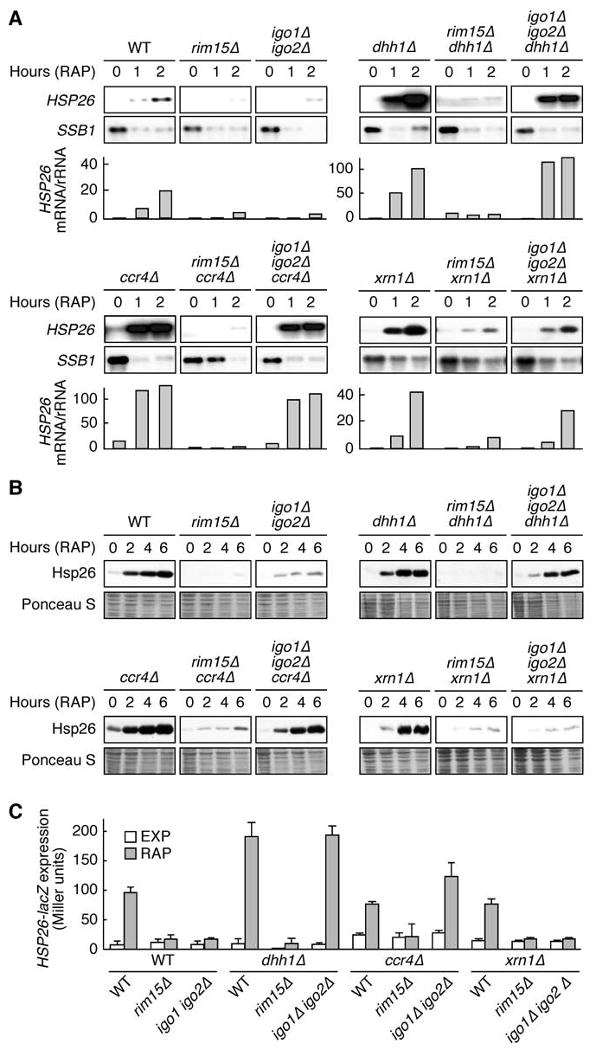
(A) Loss of Dhh1, Ccr4, or Xrn1 suppresses the defect of igo1Δ igo2Δ, but not that of rim15Δ cells, in rapamycin-induced HSP26 mRNA expression. Northern analyses of HSP26 and of rapamycin-repressible SSB1 were done with wild-type and indicated mutant strains prior to (0) and following a rapamycin treatment (RAP; 0.2 μg ml-1) of 1 hr or 2 hr. Bar graphs show the relative level of HSP26 mRNA per rRNA (quantified by PhosphorImager analysis and arbitrarily set to 1.0 for exponentially growing wild-type cells). All samples were run on the same gel (identical film exposure time). Similar results were obtained for other genes (e.g., SOL4 and DCS2; Figure S3A).
(B, C) Loss of Dhh1 or Ccr4, but not loss of Xrn1, suppresses the defect of igo1Δ igo2 in rapamycin-induced Hsp26 protein expression. (B) Cell extracts from the same strains as in (A), treated (2 hr, 4 hr, and 6 hr) or not (0 hr) with rapamycin, were analyzed by SDS-PAGE and immunoblots were probed with specific anti-Hsp26 antibodies. Ponceau S staining of the membranes prior to Immunoblot analysis served as loading control. (C) HSP26-lacZ expression was monitored (as in Figure 2D) in exponentially growing cells prior to (EXP) and following a 6-hr rapamycin treatment (RAP). Data are reported as averages (n = 3), with SDs indicated by the lines above each bar. Strains were as in (A). Please see Figure S3B for northern blot analyses.
Igo1 may escort HSP26 mRNAs during their transit through PBs to reach EGPBs/SGs
To study whether Igo proteins may co-localize with HSP26 mRNAs, we used a strategy that enables specific mRNAs to be followed in live cells (Brodsky and Silver, 2000). Accordingly, we constructed a modified HSP26 gene that encodes an mRNA harboring multiple U1A-binding sites in its 3′ UTR. Binding of plasmid-expressed U1A-GFP allows visualization of this specific mRNA by fluorescence microscopy (Figure 6A). In control northern blot experiments, HSP26-U1A expression mirrored the expression of the endogenous HSP26 gene in all the conditions and strains tested. Using this system, we found HSP26 mRNAs to form distinct cytoplasmic GFP foci in rapamycin-treated wild-type cells or, more abundantly, in cells subjected to glucose limitation (following growth in batch cultures for 48 hr), which also induced HSP26 expression in a strongly Rim15- and Igo1/2-dependent manner (Figures 6A, 6B, and 6C). Up to 60% of these cytoplasmic foci precisely colocalized with the PB-marker Dcp2-RFP indicating that a fraction of HSP26 mRNAs, instead of being translated at ribosomes, is targeted to PBs following rapamycin treatment or glucose limitation. During glucose-limitation, the relative number of HSP26 mRNA-containing, Dcp2-RFP-positive foci steadily increased in wild-type cells, while corresponding foci were almost entirely absent in rim15Δ cells, which was expected given the low level of HSP26 expression in these cells (Figure 6D). Intriguingly, igo1Δ igo2Δ cells contained a slightly elevated relative number of HSP26 mRNA-containing, Dcp2-RFP-positive foci during an early phase of glucose-limitation, which, in contrast to wild-type cells, decreased considerably during later phases of glucose limitation. Given the particular concentration of the 5′-3′ mRNA decay machinery in PBs, these results can be most simply interpreted with a primary role of Igo1/2 in preventing degradation of mRNAs within PBs. In line with such a model, we also observed that loss of Xrn1 enabled glucose-limited igo1Δ igo2Δ cells, but not rim15Δ cells, to regain their ability to normally accumulate HSP26 mRNAs and to form HSP26 mRNA containing foci that colocalized with PBs (Figures 6B and 6D).
Figure 6. Stable Presence of HSP26 mRNAs Within PBs Requires Igo1 and Igo2.
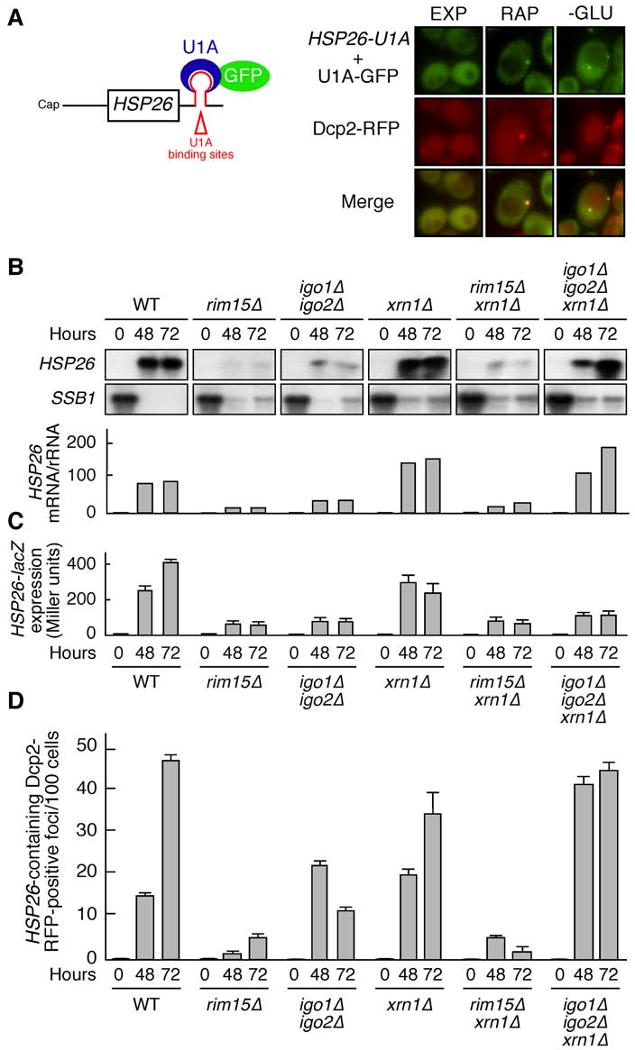
(A) HSP26 mRNA co-localizes with the PB marker Dcp2-RFP. Binding of U1A-GFP to an HSP26 mRNA harboring multiple (16 in total) U1A binding sites in its 3′ UTR allows analysis of HSP26 mRNA localization. Wild-type cells co-expressing Dcp2-RFP, as well as HSP26-U1A mRNA and U1A-GFP were harvested prior to (EXP), or following rapamycin treatment (RAP; 0.2 μg ml-1; 2 hr), or glucose limitation (i.e. following growth for 24 hr in batch cultures; -GLU) and analyzed by fluorescence microscopy. GFP foci were absent in control cells expressing either the HSP26 reporter or the U1A-GFP fusion plasmid solely (Hoyle et al., 2007); and data not shown).
(B) Loss of Xrn1 suppresses the defect of igo1Δ igo2Δ, but not that of rim15Δ cells, in HSP26 mRNA expression following glucose limitation. Northern analyses of HSP26 and SSB1 in wild-type and indicated mutant strains harvested in exponential growth phase (0) and following glucose limitation (i.e. following growth for 48 hr or 72 hr in batch cultures). All samples were run on the same gel (identical film exposure time). Bar graphs show the relative levels of HSP26 mRNA per rRNA (arbitrarily set to 1.0 for exponentially growing wild-type cells).
(C) Loss of Xrn1 does not suppress the defect of igo1Δ igo2Δ in HSP26-lacZ expression following glucose limitation. HSP26-lacZ expression was monitored (as in Figure 2D) in wild-type and indicated mutant strains that were grown as in (B). In control experiments, HSP26-lacZ mRNA accumulation patterns were found to be comparable to the ones of the endogenous HSP26 gene for all strains studied (data not shown).
(D) Igo1/2 ensure survival of HSP26 mRNAs within PBs. The number of HSP26 mRNA-containing, Dcp2-RFP-positive cytoplasmic foci per 100 cells was determined (as in [A]) in wild-type and indicated mutant strains that were harvested in exponential growth phase (0) and following glucose limitation (i.e. following growth for 48 hr or 72 hr in batch cultures). Data are reported as averages (n = 3), with SDs indicated by the lines above the bars. Please note that Igo1/2 are dispensable for translation per se (Figure S4).
To test if Igo1 is also present in PBs, we analyzed the subcellular localization of a functional Igo1-GFP fusion protein prior to and following glucose limitation. During exponential growth, Igo1-GFP had a diffuse appearance in both the cytoplasm and the nucleus (Figure 7A). Remarkably, Igo1-GFP, like GFP-Rim15 (Pedruzzi et al., 2003), started to accumulate in the nuclei of cells when approximately 50% of the initial amount of glucose in the culture had been consumed. While Igo1-GFP started to fade away from nuclei following glucose exhaustion, we observed a transient increase of Igo1-GFP foci that colocalized with the PB marker protein Dcp2-RFP and, in parallel, an increase of Igo1-GFP foci colocalizing with RFP-tagged Pab1 (Figures 7A and 7B), which, albeit also present in some PBs, represents a key constituent of EGPBs/SGs in yeast (Buchan et al., 2008; Hoyle et al., 2007). Since EGPBs/SGs assemble on pre-existing PBs in glucose-deprived yeast cells (Buchan et al., 2008), our data suggest that Igo1 may escort mRNAs to primarily prevent their degradation via the 5′-3′ mRNA decay pathway to ultimately ensure their presence in EGPBs/SGs from where they may return to translation. In support of this model, a significant fraction of HSP26 mRNA-containing foci co-localized with Igo1-RFP as well as with Pab1-RFP-containing EGPBs/SGs in glucose limited cells (Figures 7C and 7D). Moreover, loss of Igo1/2 strongly shifted, in a Dhh1-dependent manner, the relative distribution of HSP26 mRNAs among cytoplasmic foci towards Dcp2-RFP-positive PBs (Figures S5A and S5B).
Figure 7. Igo1 Co-Localizes with PBs, EGPBs, and HSP26 mRNAs in Glucose-Limited Cells.
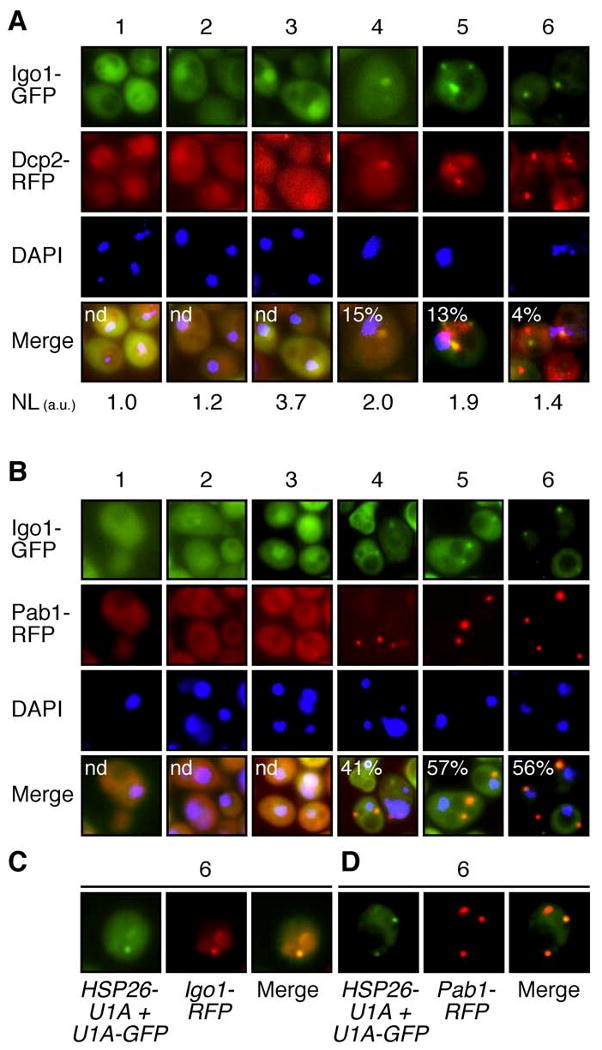
(A, B) Igo1 dynamically co-localizes with PBs and EGPBs. Wild-type cells co-expressing Igo1-GFP and the PB marker Dcp2-RFP (A) or the EGPB/SG marker Pab1-RFP (B) were grown in batch cultures and visualized by fluorescence microscopy at the following stages of the growth curve: exponential growth phase (1), time point where 50% of the initial glucose was consumed (2), time point of glucose exhaustion (3), and 2 hr (4), 5 hr (5), and 8 hr (6) following glucose exhaustion. Relative levels of nuclear Igo1-GFP were quantified (in (A)) by comparison of the fluorescence intensity per unit area in the nucleus versus cytoplasm, expressed in arbitrary units (a.u.), and indicated at the bottom of the images (NL). DNA was stained with 4′,6-diamidino-2-phenylindole (DAPI). The percentage of cytoplasmic Igo1-GFP foci colocalizing with Dcp2-RFP (A) or Pab1-RFP (B) was assessed and indicated (in %) in the corresponding merged pictures.
(C, D) HSP26 mRNA colocalizes with Igo1 and EGPBs. Wild-type cells expressing HSP26-U1A mRNA and U1A-GFP together with Igo1-RFP (C) or Pab1-RFP (D) were harvested 8hr (6) following glucose exhaustion and analyzed by fluorescence microscopy. For the assessment of the relative distribution of HSP26 mRNAs between PBs and EGPBs/SG see also Figure S5.
Discussion
Previous work has documented that the conserved TORC1 and PKA nutrient signaling pathways converge on Rim15 to inhibit initiation of the G0 program, CLS, and, as recently reported, autophagy (Pedruzzi et al., 2003; Reinders et al., 1998; Wanke et al., 2008; Yorimitsu et al., 2007). Here, we describe the discovery of the first bona fide Rim15 targets, namely the paralogous Igo1 and Igo2 proteins. We also provide evidence that these proteins play an essential role in initiation of the G0 program by preventing the degradation of specific nutrient-regulated mRNAs via the 5′-3′ mRNA decay pathway. Thus, our data not only identify a new key aspect of the cellular response to nutrient deprivation (i.e. posttranscriptional stabilization of specific mRNAs), but also provide a molecular mechanism, which supports the idea that untranslating mRNAs assemble into mRNPs, the fate of which (i.e. translation or decay) is critically regulated by the nature of associated proteins.
How may Igo1/2 protect mRNAs from degradation? TORC1 inhibition broadly shifts translating mRNAs on polysomes towards a repressing mRNP state within PBs and accelerates the deadenylation-dependent decapping pathway (Albig and Decker, 2001), which is normally stimulated by Dhh1 and the Lsm-Pat1 complex (Parker and Sheth, 2007). Interestingly, studies of yeast Dhh1 and the orthologous DDX6-like RNA helicases in higher eukaryotes revealed a general role for these proteins in remodeling of mRNP complexes for entry into translation, storage or decay pathways (Weston and Sommerville, 2006). As recently proposed, DDX6-like helicases may execute their function by assembling specific repressors or activators of translation into different mRNP complexes, which may be structurally re-organized due to ATPase/helicase-driven displacement of regulatory proteins from the core mRNAs (Minshall et al., 2009; Weston and Sommerville, 2006). An attractive model to be addressed in future studies therefore posits that activated Igo1, by interacting with Dhh1, interferes with the ability of Dhh1 to assemble translational repressors and/or with its role in remodeling translationally active mRNP complexes into a repression/decay state.
Diverse processes such as degradation of mRNAs with aberrant translation termination codons by a quality control process termed nonsense-mediated decay (NMD), rapid turnover of mRNAs containing AU-rich destabilizing elements (AREs) in their 3′ UTRs, or micro-RNA (miRNA)-mediated translation repression in mammalian cells, all implicate mRNA-specific regulators, which deliver mRNAs to the repression/decay machinery (Eulalio et al., 2007). Although it is in principle possible that Igo1/2 may exert their specificity through binding of particular sequence signatures within target mRNAs, the fact that the Igo1/2-controlled mRNAs do not contain a readily identifiable common sequence motif argues against such a mechanism. More likely, specificity of Igo1/2 is brought about, at least in part, by their temporal activation via Rim15 during initiation of the G0 program. In this context, it is worth noting that RNA polymerase II transcription units can influence the posttranscriptional fate of mRNAs by affecting the composition of mRNP particles (Jensen et al., 2003). Future studies should therefore also address the intriguing possibility that Rim15 may be recruited to specific promoter regions, which could ensure timely co-transcriptional activation of the Igo1-Dhh1/-Lsm12 associations within newly forming mRNP complexes. Such a scenario, in which Igo1/2 may serve as a “molecular memory” of a gene's transcriptional activity by assembling into corresponding mRNP complexes, could also provide a mechanistic basis for the previously observed homodirectional changes in transcriptome composition and mRNA translation in rapamycin-treated cells (Preiss et al., 2003).
Igo1 as well as its interacting partners Dhh1, Lsm12, and Pbp1 have clear orthologs in mammals - mammalian ENSA/ARPP-16/19, RCK/p54, Q3MHD2, and ataxin-2, respectively (Albrecht and Lengauer, 2004; Dulubova et al., 2001; Ralser et al., 2005; Weston and Sommerville, 2006). Of these, both RCK/p54 and ataxin-2 have been described to occur within SGs and proposed to be involved in mRNA metabolism. Thus, together with our finding that human ENSA/ARPP-19 partially complement the gene expression defect in an igo1Δ igo2Δ mutant, these observations indicate that Igo1/2 may have an evolutionarily conserved role in mRNA stability control. Intriguingly, ARPP-19 has previously been suggested to control axon growth and synaptic plasticity specifically by stabilizing the growth-associated protein-43 (GAP-43) mRNA in response to nerve growth factor treatment (Irwin et al., 2002). Our study, which identifies a hitherto unknown biological function of Igo1/2, may therefore have far-reaching implications for understanding how extracellular, growth-related cues impinge on post-transcriptional gene expression to control eukaryotic differentiation programs.
Experimental Procedures
Cloning and Yeast Experiments
Yeast strains and plasmids used in this study are listed in Tables S1 and S2. Strains were grown at 30°C in standard rich medium with 2% glucose (YPD) or synthetic defined medium with 2% glucose complemented with the appropriate nutrients for plasmid maintenance. PCR-based gene deletions, tagging of chromosomal IGO1, and standard experimental procedures for cloning were as described (Amberg et al., 2005).
Mass Spectrometry and Phospho-Specific Antibodies
To identify phosphorylation sites in Igo1, purified, bacterially expressed GST-Igo1 was subjected to protein kinase assays using non-radioactive ATP and wild-type or kinase-inactive Rim15KD as described (Wanke et al., 2005). Following separation of the reaction mixtures by SDS-PAGE, the bands corresponding to GST-Igo1 were excised, digested with trypsin, loaded onto a microcapillary liquid chromatography system (OD-SAQ, C18, 5μm 300 Å, 75μm ID × 10 cm), and eluted directly into a tandem mass spectrometer (Voyager Super STR) with electrospray ionisation. A 1306.6-D peptide (corresponding to the theoretical peptide Y-F-D-S-G-D-Y-A-L-Q-K) appeared to be phosphorylated at the serine residue (which corresponds to Ser64 in Igo1) specifically in the GST-Igo1 sample that was treated with wild-type Rim15. Phosphospecific antibodies were raised against the phosphorylated synthetic peptide K-R-K-Y-F-D-pS-G-D-Y-A-L-Q-C (where pS represents phospho-Ser64 of Igo1). The serum was pre-adsorbed with the non-phosphorylated form of the peptide and affinity-purified with the phosphorylated peptide by Eurogentec.
Tandem Affinity Purification (TAP) and Immunoprecipitation (IP) Experiments
Igo1-TAP was purified, using a standard TAP-tag purification protocol (Gelperin et al., 2005), from wild-type (BY4741) cells harboring plasmid BG1805-IGO1-TAP (that drives expression of Igo1-TAP from the galactose-inducible GAL1 promoter). Prior to protein extraction, cells were pre-grown on 2% raffinose-containing medium, grown for 4 hr on galactose-containing medium, and treated for 1 hr with 0.2 μg ml-1 rapamycin. In parallel, Igo1-myc13 was purified using a classical IP protocol from exponentially growing LC54 cells (expressing a chromosomally tagged Igo1-myc13 under the control of the endogenous IGO1 promoter) that were also treated for 1 hr with 0.2 μg ml-1 rapamycin. Purified Igo1-TAP and Igo1-myc13 preparations were analyzed for co-precipitating partner proteins using standard MS.
Miscellaneous
Analyses of global transcription changes (including RNA extraction, cRNA synthesis, microarray hybridization and data analyses) were carried out as published (Urban et al., 2007). Northern blot analyses, β-galactosidase measurements, and ageing assays were also performed as described (Reinders et al., 1998; Wanke et al., 2008). Cells were imaged using an Olympus BX54 microscope equipped with a piezo-positioner (Olympus). Z-sections (7-10 each 0.5 μm apart) were projected to two-dimensional images and analyzed with the CellM software (Olympus). Details of proteome chip and polysome analyses are described in Supplemental Data. The microarray data set is available at http://puma.princeton.edu/cgi-bin/publication/viewPublication.pl?pub_no=531.
Highlights
Initiation of the TORC1-regulated G0 program requires Igo1 and Igo2
TORC1 inhibition triggers phosphorylation of Igo1/2 by the protein kinase Rim15
Activated Igo1/2 shelter specific mRNAs from entry into the 5′-3′ mRNA decay pathway
The likely conserved function of Igo1/2 is key for cell differentiation and life span
Supplementary Material
Acknowledgments
We thank Pam Silver, Roy Parker and Mark Ashe for strains and plasmids, Manfredo Quadroni for MS analyses, Johannes Buchner and Mick Tuite for antibodies, Patrick Linder and Monique Doere for help with polysome analyses, and Marie-Pierre Péli-Gulli for critical comments on the manuscript. This research was supported by the Canton of Fribourg and grants from the Swiss National Science Foundation (laboratory of C.D.V) and NIH (laboratories of M.S. and J.R.B.).
Footnotes
Supplemental Data: Supplemental Data include Supplemental Experimental Procedures, three tables and five figures and are available at http://www.molecule.org/cgi/content/full
Publisher's Disclaimer: This is a PDF file of an unedited manuscript that has been accepted for publication. As a service to our customers we are providing this early version of the manuscript. The manuscript will undergo copyediting, typesetting, and review of the resulting proof before it is published in its final citable form. Please note that during the production process errors may be discovered which could affect the content, and all legal disclaimers that apply to the journal pertain.
References
- Abeliovich H, Klionsky DJ. Autophagy in yeast: mechanistic insights and physiological function. Microbiol Mol Biol Rev. 2001;65:463–479. doi: 10.1128/MMBR.65.3.463-479.2001. [DOI] [PMC free article] [PubMed] [Google Scholar]
- Albig AR, Decker CJ. The target of rapamycin signaling pathway regulates mRNA turnover in the yeast Saccharomyces cerevisiae. Mol Biol Cell. 2001;12:3428–3438. doi: 10.1091/mbc.12.11.3428. [DOI] [PMC free article] [PubMed] [Google Scholar]
- Albrecht M, Lengauer T. Novel Sm-like proteins with long C-terminal tails and associated methyltransferases. FEBS Lett. 2004;569:18–26. doi: 10.1016/j.febslet.2004.03.126. [DOI] [PubMed] [Google Scholar]
- Amberg DC, Burke DJ, Strathern JN. Methods in Yeast Genetics. Cold Spring Harbor: Cold Spring Harbor Laboratory Press; 2005. [Google Scholar]
- Anderson P, Kedersha N. RNA granules. J Cell Biol. 2006;172:803–808. doi: 10.1083/jcb.200512082. [DOI] [PMC free article] [PubMed] [Google Scholar]
- Bataille D, Heron L, Virsolvy A, Peyrollier K, LeCam A, Gros L, Blache P. α-Endosulfine, a new entity in the control of insulin secretion. Cell Mol Life Sci. 1999;56:78–84. doi: 10.1007/s000180050008. [DOI] [PMC free article] [PubMed] [Google Scholar]
- Brengues M, Teixeira D, Parker R. Movement of eukaryotic mRNAs between polysomes and cytoplasmic processing bodies. Science. 2005;310:486–489. doi: 10.1126/science.1115791. [DOI] [PMC free article] [PubMed] [Google Scholar]
- Brodsky AS, Silver PA. Pre-mRNA processing factors are required for nuclear export. RNA. 2000;6:1737–1749. doi: 10.1017/s1355838200001059. [DOI] [PMC free article] [PubMed] [Google Scholar]
- Buchan JR, Muhlrad D, Parker R. P bodies promote stress granule assembly in Saccharomyces cerevisiae. J Cell Biol. 2008;183:441–455. doi: 10.1083/jcb.200807043. [DOI] [PMC free article] [PubMed] [Google Scholar]
- Cameroni E, Hulo N, Roosen J, Winderickx J, De Virgilio C. The novel yeast PAS kinase Rim15 orchestrates G0-associated antioxidant defense mechanisms. Cell Cycle. 2004;3:462–468. [PubMed] [Google Scholar]
- De Virgilio C, Loewith R. The TOR signalling network from yeast to man. Int J Biochem Cell Biol. 2006;38:1476–1481. doi: 10.1016/j.biocel.2006.02.013. [DOI] [PubMed] [Google Scholar]
- Dulubova I, Horiuchi A, Snyder GL, Girault JA, Czernik AJ, Shao L, Ramabhadran R, Greengard P, Nairn AC. ARPP-16/ARPP-19: a highly conserved family of cAMP-regulated phosphoproteins. J Neurochem. 2001;77:229–238. doi: 10.1046/j.1471-4159.2001.t01-1-00191.x. [DOI] [PubMed] [Google Scholar]
- Eulalio A, Behm-Ansmant I, Izaurralde E. P bodies: at the crossroads of post-transcriptional pathways. Nat Rev Mol Cell Biol. 2007;8:9–22. doi: 10.1038/nrm2080. [DOI] [PubMed] [Google Scholar]
- Fabrizio P, Pozza F, Pletcher SD, Gendron CM, Longo VD. Regulation of longevity and stress resistance by Sch9 in yeast. Science. 2001;292:288–290. doi: 10.1126/science.1059497. [DOI] [PubMed] [Google Scholar]
- Fleischer TC, Weaver CM, McAfee KJ, Jennings JL, Link AJ. Systematic identification and functional screens of uncharacterized proteins associated with eukaryotic ribosomal complexes. Genes Dev. 2006;20:1294–1307. doi: 10.1101/gad.1422006. [DOI] [PMC free article] [PubMed] [Google Scholar]
- Gelperin DM, White MA, Wilkinson ML, Kon Y, Kung LA, Wise KJ, Lopez-Hoyo N, Jiang L, Piccirillo S, Yu H, et al. Biochemical and genetic analysis of the yeast proteome with a movable ORF collection. Genes Dev. 2005;19:2816–2826. doi: 10.1101/gad.1362105. [DOI] [PMC free article] [PubMed] [Google Scholar]
- Gray JV, Petsko GA, Johnston GC, Ringe D, Singer RA, Werner-Washburne M. “Sleeping beauty”: quiescence in Saccharomyces cerevisiae. Microbiol Mol Biol Rev. 2004;68:187–206. doi: 10.1128/MMBR.68.2.187-206.2004. [DOI] [PMC free article] [PubMed] [Google Scholar]
- He W, Parker R. Functions of Lsm proteins in mRNA degradation and splicing. Curr Opin Cell Biol. 2000;12:346–350. doi: 10.1016/s0955-0674(00)00098-3. [DOI] [PubMed] [Google Scholar]
- Hoyle NP, Castelli LM, Campbell SG, Holmes LE, Ashe MP. Stress-dependent relocalization of translationally primed mRNPs to cytoplasmic granules that are kinetically and spatially distinct from P-bodies. J Cell Biol. 2007;179:65–74. doi: 10.1083/jcb.200707010. [DOI] [PMC free article] [PubMed] [Google Scholar]
- Irwin N, Chao S, Goritchenko L, Horiuchi A, Greengard P, Nairn AC, Benowitz LI. Nerve growth factor controls GAP-43 mRNA stability via the phosphoprotein ARPP-19. Proc Natl Acad Sci USA. 2002;99:12427–12431. doi: 10.1073/pnas.152457399. [DOI] [PMC free article] [PubMed] [Google Scholar]
- Jensen TH, Dower K, Libri D, Rosbash M. Early formation of mRNP: license for export or quality control? Mol Cell. 2003;11:1129–1138. doi: 10.1016/s1097-2765(03)00191-6. [DOI] [PubMed] [Google Scholar]
- Jorgensen P, Rupes I, Sharom JR, Schneper L, Broach JR, Tyers M. A dynamic transcriptional network communicates growth potential to ribosome synthesis and critical cell size. Genes Dev. 2004;18:2491–2505. doi: 10.1101/gad.1228804. [DOI] [PMC free article] [PubMed] [Google Scholar]
- Kaeberlein M, Burtner CR, Kennedy BK. Recent developments in yeast aging. PLoS Genet. 2007;3:e84. doi: 10.1371/journal.pgen.0030084. [DOI] [PMC free article] [PubMed] [Google Scholar]
- Kolter R, Siegele DA, Tormo A. The stationary phase of the bacterial life cycle. Annu Rev Microbiol. 1993;47:855–874. doi: 10.1146/annurev.mi.47.100193.004231. [DOI] [PubMed] [Google Scholar]
- Malumbres M, Barbacid M. To cycle or not to cycle: a critical decision in cancer. Nat Rev Cancer. 2001;1:222–231. doi: 10.1038/35106065. [DOI] [PubMed] [Google Scholar]
- Mangus DA, Amrani N, Jacobson A. Pbp1p, a factor interacting with Saccharomyces cerevisiae poly(A)-binding protein, regulates polyadenylation. Mol Cell Biol. 1998;18:7383–7396. doi: 10.1128/mcb.18.12.7383. [DOI] [PMC free article] [PubMed] [Google Scholar]
- Mangus DA, Smith MM, McSweeney JM, Jacobson A. Identification of factors regulating poly(A) tail synthesis and maturation. Mol Cell Biol. 2004;24:4196–4206. doi: 10.1128/MCB.24.10.4196-4206.2004. [DOI] [PMC free article] [PubMed] [Google Scholar]
- Minshall N, Kress M, Weil D, Standart N. Role of p54 RNA helicase activity and its C-terminal domain in translational repression, P-body localization and assembly. Mol Biol Cell. 2009;20:2464–2472. doi: 10.1091/mbc.E09-01-0035. [DOI] [PMC free article] [PubMed] [Google Scholar]
- Nonhoff U, Ralser M, Welzel F, Piccini I, Balzereit D, Yaspo ML, Lehrach H, Krobitsch S. Ataxin-2 interacts with the DEAD/H-box RNA helicase DDX6 and interferes with P-bodies and stress granules. Mol Biol Cell. 2007;18:1385–1396. doi: 10.1091/mbc.E06-12-1120. [DOI] [PMC free article] [PubMed] [Google Scholar]
- Parker R, Sheth U. P bodies and the control of mRNA translation and degradation. Mol Cell. 2007;25:635–646. doi: 10.1016/j.molcel.2007.02.011. [DOI] [PubMed] [Google Scholar]
- Pedruzzi I, Bürckert N, Egger P, De Virgilio C. Saccharomyces cerevisiae Ras/cAMP pathway controls post-diauxic shift element-dependent transcription through the zinc finger protein Gis1. EMBO J. 2000;19:2569–2579. doi: 10.1093/emboj/19.11.2569. [DOI] [PMC free article] [PubMed] [Google Scholar]
- Pedruzzi I, Dubouloz F, Cameroni E, Wanke V, Roosen J, Winderickx J, De Virgilio C. TOR and PKA signaling pathways converge on the protein kinase Rim15 to control entry into G0. Mol Cell. 2003;12:1607–1613. doi: 10.1016/s1097-2765(03)00485-4. [DOI] [PubMed] [Google Scholar]
- Powers RW, 3rd, Kaeberlein M, Caldwell SD, Kennedy BK, Fields S. Extension of chronological life span in yeast by decreased TOR pathway signaling. Genes Dev. 2006;20:174–184. doi: 10.1101/gad.1381406. [DOI] [PMC free article] [PubMed] [Google Scholar]
- Powers T. TOR signaling and S6 kinase 1: Yeast catches up. Cell Metab. 2007;6:1–2. doi: 10.1016/j.cmet.2007.06.009. [DOI] [PubMed] [Google Scholar]
- Preiss T, Baron-Benhamou J, Ansorge W, Hentze MW. Homodirectional changes in transcriptome composition and mRNA translation induced by rapamycin and heat shock. Nat Struct Biol. 2003;10:1039–1047. doi: 10.1038/nsb1015. [DOI] [PubMed] [Google Scholar]
- Ptacek J, Devgan G, Michaud G, Zhu H, Zhu X, Fasolo J, Guo H, Jona G, Breitkreutz A, Sopko R, et al. Global analysis of protein phosphorylation in yeast. Nature. 2005;438:679–684. doi: 10.1038/nature04187. [DOI] [PubMed] [Google Scholar]
- Ralser M, Albrecht M, Nonhoff U, Lengauer T, Lehrach H, Krobitsch S. An integrative approach to gain insights into the cellular function of human ataxin-2. J Mol Biol. 2005;346:203–214. doi: 10.1016/j.jmb.2004.11.024. [DOI] [PubMed] [Google Scholar]
- Reinders A, Bürckert N, Boller T, Wiemken A, De Virgilio C. Saccharomyces cerevisiae cAMP-dependent protein kinase controls entry into stationary phase through the Rim15p protein kinase. Genes Dev. 1998;12:2943–2955. doi: 10.1101/gad.12.18.2943. [DOI] [PMC free article] [PubMed] [Google Scholar]
- Sheth U, Parker R. Decapping and decay of messenger RNA occur in cytoplasmic processing bodies. Science. 2003;300:805–808. doi: 10.1126/science.1082320. [DOI] [PMC free article] [PubMed] [Google Scholar]
- Tarassov K, Messier V, Landry CR, Radinovic S, Serna Molina MM, Shames I, Malitskaya Y, Vogel J, Bussey H, Michnick SW. An in vivo map of the yeast protein interactome. Science. 2008;320:1465–1470. doi: 10.1126/science.1153878. [DOI] [PubMed] [Google Scholar]
- Urban J, Soulard A, Huber A, Lippman S, Mukhopadhyay D, Deloche O, Wanke V, Anrather D, Ammerer G, Riezman H, et al. Sch9 is a major target of TORC1 in Saccharomyces cerevisiae. Mol Cell. 2007;26:663–674. doi: 10.1016/j.molcel.2007.04.020. [DOI] [PubMed] [Google Scholar]
- Von Stetina JR, Tranguch S, Dey SK, Lee LA, Cha B, Drummond-Barbosa D. α–Endosulfine is a conserved protein required for oocyte meiotic maturation in Drosophila. Development. 2008;135:3697–3706. doi: 10.1242/dev.025114. [DOI] [PMC free article] [PubMed] [Google Scholar]
- Wanke V, Cameroni E, Uotila A, Piccolis M, Urban J, Loewith R, De Virgilio C. Caffeine extends yeast lifespan by targeting TORC1. Mol Microbiol. 2008;69:277–285. doi: 10.1111/j.1365-2958.2008.06292.x. [DOI] [PubMed] [Google Scholar]
- Wanke V, Pedruzzi I, Cameroni E, Dubouloz F, De Virgilio C. Regulation of G0 entry by the Pho80-Pho85 cyclin-CDK complex. EMBO J. 2005;24:4271–4278. doi: 10.1038/sj.emboj.7600889. [DOI] [PMC free article] [PubMed] [Google Scholar]
- Wei M, Fabrizio P, Hu J, Ge H, Cheng C, Li L, Longo VD. Life span extension by calorie restriction depends on Rim15 and transcription factors downstream of Ras/PKA, Tor, and Sch9. PLoS Genet. 2008;4:e13. doi: 10.1371/journal.pgen.0040013. [DOI] [PMC free article] [PubMed] [Google Scholar]
- Weston A, Sommerville J. Xp54 and related (DDX6-like) RNA helicases: roles in messenger RNP assembly, translation regulation and RNA degradation. Nucleic Acids Res. 2006;34:3082–3094. doi: 10.1093/nar/gkl409. [DOI] [PMC free article] [PubMed] [Google Scholar]
- Woods WS, Boettcher JM, Zhou DH, Kloepper KD, Hartman KL, Ladror DT, Qi Z, Rienstra CM, George JM. Conformation-specific binding of α-synuclein to novel protein partners detected by phage display and NMR spectroscopy. J Biol Chem. 2007;282:34555–34567. doi: 10.1074/jbc.M705283200. [DOI] [PubMed] [Google Scholar]
- Yorimitsu T, Zaman S, Broach JR, Klionsky DJ. Protein kinase A and Sch9 cooperatively regulate induction of autophagy in Saccharomyces cerevisiae. Mol Biol Cell. 2007;18:4180–4189. doi: 10.1091/mbc.E07-05-0485. [DOI] [PMC free article] [PubMed] [Google Scholar]
Associated Data
This section collects any data citations, data availability statements, or supplementary materials included in this article.