

Abstract
Although in situ hybridization studies have revealed the presence of kainate receptor (KAR) mRNA in neurons of the rat medial entorhinal cortex (mEC), the functional presence and roles of these receptors are only beginning to be examined. To address this deficiency, whole cell voltage clamp recordings of locally evoked EPSCs were made from mEC layer II and III neurons in combined entorhinal cortex -hippocampal brain slices. Three types of neurons were identified by their electroresponsive membrane properties, locations, and morphologies: stellate-like “Sag” neurons in layer II (S), pyramidal-like “No Sag” neurons in layer III (NS), and “Intermediate Sag” neurons with varied morphologies and locations (IS). Non-NMDA EPSCs in these neurons were composed of two components, and the slow decay component in NS neurons had larger amplitudes and contributed more to the combined EPSC than did those observed in S and IS neurons. This slow component was mediated by KARs and was characterized by its resistance to either GYKI 52466 (100 μM) or NBQX (1 μM), relatively slow decay kinetics, and sensitivity to CNQX (10–50 μM). KAR mediated EPSCs in pyramidal-like NS neurons contributed significantly more to the combined non-NMDA EPSC than did those from S and IS neurons. Layer III neurons of the mEC are selectively susceptible to degeneration in human temporal lobe epilepsy (TLE) and animal models of TLE such as kainate-induced status epilepticus. Characterizing differences in the complement of postsynaptic receptors expressed in injury prone versus injury resistant mEC neurons represents an important step toward understanding the vulnerability of layer III neurons seen in TLE.
INTRODUCTION
Kainate receptors (KARs) are one of the three classes of ionotropic glutamate receptors and are composed of tetrameric assemblies of the GluR5-7 and KA1-2 subunits. These receptors have been shown to both mediate and modulate synaptic transmission in both the central and peripheral nervous system (for reviews see (Chittajallu et al., 1999, Frerking and Nicoll, 2000, Lerma et al., 2001, Lerma, 2003, Lerma, 2006, Pinheiro and Mulle, 2006)). Regarding the mediation of synaptic transmission, functional postsynaptic KARs have been demonstrated in a variety of cell types (Castillo et al., 1997, Vignes and Collingridge, 1997, Cossart et al., 1998, Frerking et al., 1998, DeVries and Schwartz, 1999, Kidd and Isaac, 1999, Li et al., 1999, Bureau et al., 2000, Cossart et al., 2002, Ali, 2003, Eder et al., 2003, Gryder and Rogawski, 2003, Vitten et al., 2004, Wu et al., 2005, Jin et al., 2006) and may impose unique integrative properties to neurons (Frerking and Ohliger-Frerking, 2002). Furthermore, the expression of postsynaptic KARs has been shown to be restricted in a cellular and subcellular manner. For instance, CA3 pyramidal neurons of the hippocampus have been shown to have postsynaptic KARs that mediate a substantial portion of the synaptic response, specifically at their mossy fiber synapse, while CA1 neurons do not have postsynaptic KAR mediated EPSCs (Castillo et al., 1997, Frerking et al., 1998, Bureau et al., 1999, Lerma et al., 2001). Additionally, KARs in hippocampal CA3 neurons have been shown to underlie the kainate-induced gamma oscillations observed in these neurons (Fisahn et al., 2004).
Systemic or intracerebral injection of kainate has long been used to model temporal lobe epilepsy (TLE) (for review, see (Ben-Ari and Cossart, 2000)). These injections cause status epilepticus and ultimately result in chronic epilepsy and a pattern of cell loss similar to that found in patients with TLE. CA3 pyramidal neurons of the hippocampus are particularly sensitive since these neurons degenerate following injection of kainate (Nadler et al., 1978). Other models of TLE that lead to excessive activation of mossy fibers and a sustained release of glutamate can cause similar damage to CA3 neurons (for example see (Sloviter and Damiano, 1981)), and it is clear that KARs are involved in this excitotoxicity since GluR6-deficient mice have been shown to be less susceptible to kainate-induced degeneration of these neurons (Mulle et al., 1998).
Like the hippocampus, the medial entorhinal cortex (mEC) is susceptible to injury in TLE and animal models of this disease. In fact, one of the first reports of kainate-induced damage to hippocampal CA3 neurons notes that degenerating cells were also found in layer III of the entorhinal cortex (Nadler et al., 1978). Later reports clearly demonstrated that, while stellate cells in Layer II become hyperexcitable, pyramidal neurons residing in Layer III of the mEC selectively degenerate in TLE and animal models of this disease such as kainate-induced status epilepticus (Du et al., 1993, Du et al., 1995, Bear et al., 1996, Scharfman et al., 1998, Schwarcz et al., 2000, Kobayashi et al., 2003, Tolner et al., 2005, Kumar and Buckmaster, 2006).
Also like the hippocampus, the mEC can generate oscillations at a variety of frequencies (Dickson et al., 2000a). Such oscillations may be an important underlying substrate for information transfer and pathological processes such as epileptogenesis (Bragin et al., 2000). As in the hippocampus (Fisahn et al., 2004), the mEC can generate gamma frequency oscillations in response to agonists of KARs (Cunningham et al., 2003). Additionally, Cunningham et al. have recently demonstrated that activation of postsynaptic KARs in layer III pyramidal neurons of the mEC may underlie slow wave oscillations in this brain region (Cunningham et al., 2006).
Although KAR mRNA has been shown to be highly expressed in neurons of the mEC (Wisden and Seeburg, 1993, Bahn et al., 1994), functional expression of postsynaptic KARs in this brain region has not been examined in detail. Thus, the aim of this study was to determine if the injury prone Layer III pyramidal neurons, like CA3 pyramidal neurons of the hippocampus, differentially exhibit KAR mediated synaptic currents compared to the injury resistant layer II neurons of the mEC. To assess differences in the functional expression of KARs across these cell types, we evaluated locally evoked KAR EPSCs under a variety of pharmacological conditions in brain slices containing the mEC. Our results indicate that there is a significantly greater contribution of KARs to EPSCs recorded in pyramidal neurons of layer III when compared to neurons found in layer II of the mEC. Given the similarity between layer III pyramidal neurons of the mEC and CA3 pyramidal neurons of the hippocampus, we speculate that activation of these postsynaptic KARs may contribute to the generation of both normal and pathological oscillations and may also contribute to excitotoxic cell death of Layer III neurons during status epilepticus and/or TLE.
MATERIALS AND METHODS
Combined Entorhinal Cortex – Hippocampal Brain Slice Preparation
All experiments were performed in accordance with the National Institutes of Health Guide for the Care and Use of Laboratory Animals and were approved by the University of Utah Institutional Animal Care and Use Committee (IACUC). Unless otherwise noted, all chemicals were purchased from Sigma (St. Louis, MO). Male Sprague Dawley rats (100–200 g, approx. 30–50 days old) (Charles River, Raleigh, NC) were deeply anesthetized with sodium pentobarbital (25 mg/kg, i.p.) and brains were rapidly removed and placed in ice-cold (4 °C) oxygenated Ringer’s solution (95% O2/5% CO2) containing (in mM): Sucrose (125.0), KCl (3.0), Na2PO4 (1.2), MgSO4 (2.0), NaHCO3 (26.0), glucose (10.0), and CaCl2 (2.0) (Barton et al., 2004, Otto et al., 2006). Brains were then blocked and glued (cortex down) to the stage of a motorized Vibroslicer (Camden Instruments, Lafayette, IN). Horizontal brain slices (400 μm) containing both the mEC and hippocampus were cut and then incubated in oxygenated Ringer’s solution for ≥ 1 hour prior to recording. The oxygenated Ringer’s solution used in the incubation chamber, as well as for recordings, contained NaCl (126.0 mM) in place of sucrose. The pH (7.30–7.40) and osmolarity (290–300 mOsm) of the recording Ringer’s solution were verified prior to each experiment.
Whole cell patch-clamp recordings in adult mEC slices
Slices were transferred to an immersion recording chamber (Warner Instruments, Hamden, CT) and perfused with oxygenated, room temperature, Ringer’s solution at a rate of 2.5 – 3.0 mL/min. Borosilicate glass capillaries (World Precision Instruments, Sarasota, FL; 1.5 mm OD) were pulled to 2–3 MΩ resistance using a micropipette electrode puller (Sutter Instruments, Novato, CA). Biocytin (2.0%) was included in the patch pipette to assess the morphology and location of individual recorded neurons following the experiments. The internal solution for patch pipettes included (in mM): K-gluconate (140), HEPES (10.0), EGTA (1.0), CaCl2 (0.5), and glucose (10.0). The osmolarity of the internal solution was 275–285 mOsm, and the pH was adjusted to 7.28 with KOH.
The whole-cell patch clamp technique was used to record “blindly” from neurons in the superficial layers of the mEC (Layers II and III). Whole cell patch-clamp recordings were acquired in current-clamp and voltage-clamp mode using an Axopatch 1D or 200B amplifier and the CLAMPEX 9 software package interfaced to a Digidata 1322A data acquisition board (Axon Instruments, Union City, CA). Neurons were initially recorded in current-clamp mode (Vm = −70 mV) and neuron identity was determined by electroresponsive membrane properties (Alonso and Klink, 1993, Jones, 1994, Dickson et al., 1997, Gloveli et al., 1997, van der Linden and Lopes da Silva, 1998). In current clamp mode, series resistance was compensated by ≥ 80%. Electroresponsive membrane properties were measured as follows: Hyperpolarization induced sag potential was calculated as the voltage deflection at the end of a 250 ms square current injection of −300 pA divided by the peak voltage deflection and represented as a percentage. Membrane resistance was calculated by using measurements of the voltage deflection either at its peak (RPEAK) or at the end of a 250 ms square current injection of −300 pA from rest (RSS). The time constant (τ) was taken as the time to reach 63% of the peak voltage deflection in response to a −300 pA hyperpolarizing current pulse. The amplitudes of the action potential, depolarizing afterpotential (DAP), and afterhyperpolarization (AHP) were measured relative to the action potential threshold. Action potential duration was measured at half amplitude values (half duration).
Identified neurons were then held at −70 mV in voltage-clamp mode, and only recordings from neurons whose access resistances did not dramatically change during the recording period were used for data analysis. Signals were filtered at 2 kHz and acquired at 10 kHz. EPSCs were evoked at several stimulus strengths by a concentric bipolar stimulating electrode placed near the recording electrode (~200 μm) on the boundary of layers II and III of the mEC. Evoked EPSCs were recorded until the amplitudes of the responses were stable for a minimum of 10 minutes before control and experimental drug application responses were obtained for analysis. KAR EPSCs were pharmacologically isolated by adding 50 μM D(-)-2-Amino-5-phosphonopentanoic acid (APV), 50 μM picrotoxin (PTX), 200–400 nM CGP 54626 (Tocris, Ellisville, MO), and 100 μM 1-(4-Aminophenyl)-4-methyl-7,8-methylenedioxy-5H-2,3-benzodiazepine hydrochloride (GYKI 52466) to inhibit NMDA, GABA-A, GABA-B, and AMPA receptors, respectively. In some experiments, AMPA EPSCs were preferentially blocked by adding 1 μM 1,2,3,4-tetrahydro-6-nitro-2,3-dioxo-benzo[f]quinoxaline-7-sulfonamide (NBQX). GYKI- and NBQX-resistant EPSCs were inhibited by adding 10–50 μM 6-cyano-7-nitroquinoxaline-2,3-dione (CNQX). A minimum of 15 responses were recorded under each condition (before and after addition of either GYKI 52466 or NBQX) and averaged for analysis. Evoked EPSC amplitudes were calculated as the difference between either the averaged peak response or the average response 90 ms after the peak, and the average of a 2 ms baseline region preceding the stimulus. The contribution of the GYKI- or NBQX-resistant EPSC to the control non-NMDA EPSC was calculated by dividing the amplitude of the GYKI- or NBQX-resistant EPSC, either at the peak or 90 ms after the peak, by the peak of the control EPSC. When the amplitudes of GYKI- or NBQX-resistant EPSC traces were scaled to reflect their relative contributions to the non-NMDA EPSC, this was done by dividing the trace by a scale factor sufficient to adjust the amplitude at 90 ms after the peak to a value equal to its % contribution to the control EPSC. Time constants for EPSCs were obtained by fitting either two (for control EPSCs) or one (for GYKI-resistant EPSCs) exponential function to the decay phase of the current.
Processing of biocytin-labeled neurons
Following recording, brain slices were fixed with 4% paraformaldehyde in 100 mM phosphate buffered saline (PBS) overnight. After a minimum of 24 hours, slices were processed for biocytin according to published techniques (Kita and Armstrong, 1991, Aaron et al., 2003, Smeal et al., 2006). Briefly, slices were rinsed in PBS and subsequently washed in 1% H2O2 (in 10% methanol and 90% PBS) for 15 min. Following this step, the slices were rinsed in PBS again and then permeabilized in 2% TritonX-100 (TritonX) in PBS for a minimum of 2 hrs. An ABC Elite Kit (Vector Laboratories, CA) was used to visualize the biocytin signal. The slices were left in this solution also containing 1% TritonX in PBS overnight. After a series of washes in PBS, the slices were incubated in diaminobenzidine (2.5 mg/ml) for 10 min or until clear staining was observed. Slices were rinsed again and mounted in a glycerol solution containing MOWIOL 488 (Calbiochem, CA), a polyvinyl alcohol that helps to clear thick tissue slices.
Statistical Analysis
All values are presented as mean ± SEM, and all error bars on all graphs represent SEM. N values are the number of recordings from individual slice preparations (i.e., slices were not used for more than a single experiment). Analyses were performed using GraphPad Prism version 4.0b for Macintosh (GraphPad Software, San Diego California USA, www.graphpad.com). Statistical comparisons between groups were performed with an unpaired, two-tailed, Student’s t test. Results were considered significant at p < 0.05 (*), and considered increasingly significant at p < 0.01 (**), p < 0.001 (***), and p < 0.0001 (****).
RESULTS
Electrophysiological and Histological Characterization of mEC Superficial Layer Neurons
In order to identify the type of neuron being recorded from before examining its postsynaptic kainate receptor mediated EPSCs, intrinsic electrophysiological properties were observed in current-clamp mode. Representative voltage traces from the three primary neuronal types found in Layers II and III of the mEC are shown in Figure 1, panels Aa–Ac. As has been reported previously, these neuronal subtypes can be differentiated by the degree of “sag” in their membrane potential in response to hyperpolarizing current injection (Alonso and Klink, 1993, Jones, 1994, Dickson et al., 1997, Gloveli et al., 1997, van der Linden and Lopes da Silva, 1998). Neurons either showed a large sag potential (Sag, Aa.), an intermediate sag potential (Intermediate Sag, Ab.), or no sag potential (No Sag, Ac.) with correspondingly sized rebound potentials upon cessation of the current injection. Sag potentials were averaged across several cells in each class and found to be significantly different from one another (Table 1).
Figure 1. Electroresponsive Membrane Properties and Morphologies of mEC Neurons.
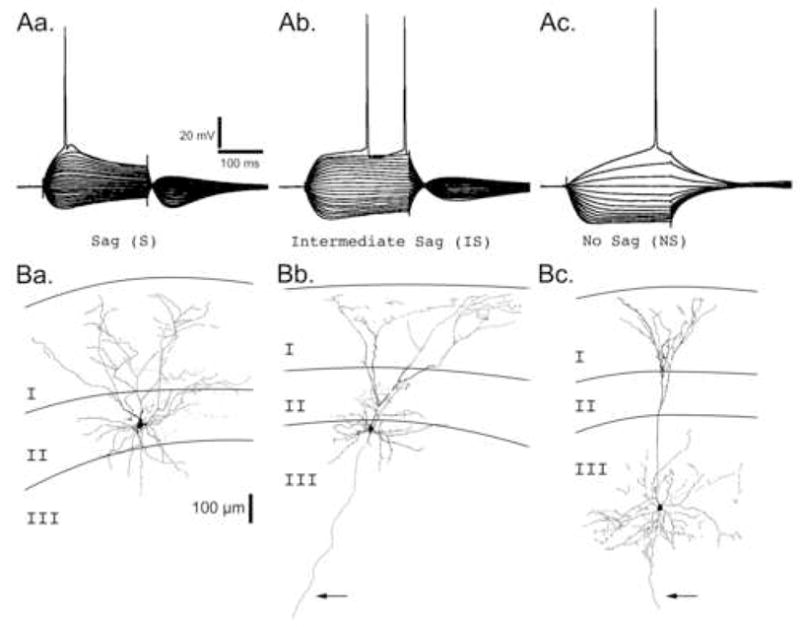
ARepresentative voltage traces from the three primary neuronal types found in Layers II and III. Neurons were recorded in current clamp mode and injected with a holding current sufficient to maintain the membrane potential at −70 mV. Neurons were then hyperpolarized or depolarized by square current steps ranging from −300 pA to > +300 pA in 30 pA intervals. Neuronal types are primarily classified by the degree of “sag” in their membrane potential in response to a sustained hyperpolarizing current injection: Aa. Sag (S), Ab. Intermediate Sag (IS), and Ac. No Sag (NS). Scale bars associated with Sag (S) neuron apply to all voltage traces. B. Camera lucida reconstructions of representative biocytin filled neurons for each neuron class in the superficial layers of the mEC. Layers I, II, and III are indicated. Arrows point to axons extending into the deep layers of the mEC. Ba. A Sag neuron with a stellate morphology whose cell body was located in layer II. Bb. An Intermediate Sag neuron with a pyramidal-like morphology whose cell body was located on the border of layers II and III. Bc. A No Sag neuron with a pyramidal morphology whose cell body was located in layer III. Scale bar (100 μm) associated with the layer II stellate neuron applies to all neurons.
Table 1.
Electroresponsive Membrane Properties of Superficial Layer Neurons in the mEC
| Action Potential |
|||||||||
|---|---|---|---|---|---|---|---|---|---|
| Sag (%) | RMP (mV) | RPEAK (MΩ) | RSS (MΩ) | τ (ms) | Threshold (mV) | Amplitude (mV) | Half Duration (ms) | DAP or AHP Amplitude (mV) | |
| S | 44.2±3.3 | −55.1±0.6‡ | 50.1±4.4 | 28.2±3.3¶ | 16.7±0.8 | −44.5±0.6 | 71.5±4.9 | 1.8±0.1 | 2.0±0.7 |
| IS | 27.8±4.2* | −58.8±0.3 | 55.1±5.0 | 39.1±2.8* | 19.8±2.5 | −38.2±0.5^ | 75.1±5.8 | 1.8±0.1 | −5.9±0.8 |
| NS | 4.3±0.2† | −60.9±1.3 | 109.2±13.6§ | 103.4±12.9⋄ | 18.2±1.9 | −40.3±1.1* | 73.7±4.6 | 2.0±0.1 | |
Values represent mean ± SEM. N=5 for all values. mEC, medial entorhinal cortex; RMP, resting membrane potential; RPEAK, membrane resistance measured at the peak of the voltage deflection; RSS, membrane resistance measured at the steady state voltage deflection; τ, membrane time constant; DAP, depolarizing afterpotential; AHP,
afterhyperpolarization. All statistics were performed using the Student’s t test:
p<0.05 vs. S;
p<0.001 vs. S or IS;
p<0.01 vs. IS or NS;
p<0.01 vs. S or IS;
p<0.001 vs. NS;
p<0.01 vs. IS;
p<0.001 vs. S.
Furthermore, the electroresponsive membrane properties of superficial layer neurons differed from one another in several other ways (Table 1). S neurons had a more depolarized resting membrane potential than IS or NS neurons. When membrane resistance was calculated using measurements of the voltage deflection at either the peak (RPEAK) or the steady state level at the end of the hyperpolarizing current step (RSS), significant differences were found between S and NS neurons and between IS and NS neurons. When resistance was measured at the steady state voltage deflection, differences were found between S and IS neurons as well. Finally, action potential threshold was more hyperpolarized in S neurons, and action potentials in S neurons commonly had depolarizing afterpotentials (DAPs), while those from IS neurons had large afterhyperpolarizations (AHPs).
As in previous studies (Alonso and Klink, 1993, Klink and Alonso, 1993, Jones, 1994, Dickson et al., 1997, Gloveli et al., 1997, van der Linden and Lopes da Silva, 1998), slices were processed for biocytin in order to assess the location and morphology of these neurons, and labeled neurons were correlated with their electrophysiology (Fig. 1Ba–Bc). When examined in this manner, S neurons invariably had a stellate morphology characterized by a broad dendritic arborization in Layer I and a cell body commonly found in Layer II (12 of 13 neurons). An example of an S neuron located in layer II with a stellate morphology can be seen in Figure 1Ba. In contrast, NS neurons largely had one (but with up to three) apical dendrite that bifurcated in Layer II and produced a narrow arborization in Layer I, and had pyramidal cell bodies that were largely found in Layer III (18 of 20 neurons). An example of a NS neuron located in layer III with a pyramidal cell body and morphology can be seen in Figure 1Bc. The cell bodies of IS neurons were found both in Layer II (8 of 25 neurons) and Layer III (7 of 25 neurons), while some were found on the boundary between Layers II and III and could not be clearly assigned to either layer (10 of 25 neurons). Likewise, IS neurons also showed a variety of morphologies; while some had a stellate-like appearance indistinguishable from S neurons in Layer II, others had pyramidal cell bodies and prominent apical dendrites similar to the NS neurons found in Layer III. An example of an IS neuron located on the boundary of layers II and III with a pyramidal-like morphology can be seen in Figure 1Bb.
Characterization of non-NMDA EPSCs in Neurons of the Superficial mEC
Upon establishing the electrophysiological category of the mEC neuron being recorded from, non-NMDA receptor mediated EPSCs were recorded in response to single low frequency stimuli (0.1–0.2 Hz). These EPSCs were pharmacologically isolated by adding 50 μM APV, 50 μM PTX, and 200–400 nM CGP 54626 to inhibit NMDA, GABA-A, and GABA-B receptors, respectively. In most cases, the minimum stimulus strength required to elicit an EPSC was determined, and EPSCs were recorded at this stimulus strength as well as at incrementally greater strengths. Ultimately, a maximal stimulus strength was determined where stimuli in excess of this threshold value caused action currents in the recorded neuron, recurrent excitation, and/or epileptiform network activity in the brain slice. A total of 23 S, 16 IS, and 24 NS neurons were recorded from in this manner.
Representative traces of maximal stimulation strength evoked non-NMDA EPSCs are illustrated in Figure 2A. Although not evident in the representative S neuron trace, non-NMDA EPSCs often had both fast and slow components to their falling phase that were fit well by two exponential functions (Fig. 2B). The corresponding time constants for the fast components were 14.0±1.0 ms (N=14), 13.0±1.4 ms (N=16), and 15.8±1.3 ms (N=14) for S, IS, and NS neurons, respectively (Fig. 2Ca). Likewise, the corresponding time constants for the slow components were 121.2±11.7 ms (N=11), 114.4±17.6 ms (N=8), and 128.4±10.3 ms (N=11) for S, IS, and NS neurons, respectively (Fig. 2Cb). Differences between cell types for either component of the EPSC decay were not significant.
Figure 2. Characterization of non-NMDA EPSCs in mEC Superficial Layer Neurons.
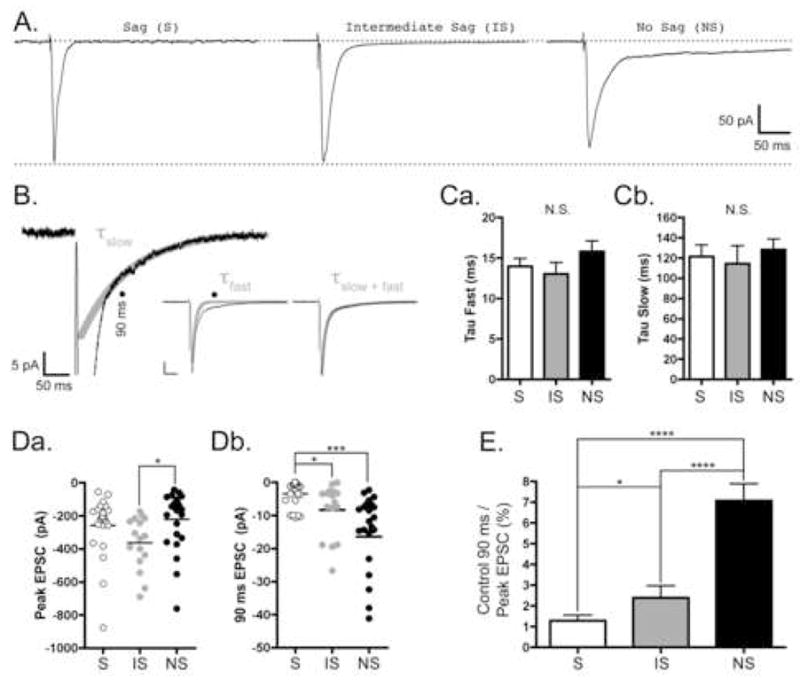
Neurons were voltage clamped at −70 mV, and low frequency (0.1–0.2 Hz) stimuli were used to evoked EPSCs as described in Materials and Methods. All traces were recorded in the presence of 50 μM APV, 50 μM PTX, and 200–400 nM CGP 54626 and are the average of 15–30 responses. A, Representative traces from Sag (S), Intermediate Sag (IS), and No Sag (NS) Neurons. Scale bars located at far right apply to all traces. Upper dashed line represents baseline current before stimulation, and lower dashed line represents the amplitude of the peak non-NMDA EPSC from the S neuron. In contrast to the S and IS neurons, there is a large slow-decay component to the EPSC in the NS neuron. B, Representative trace from a NS neuron illustrating the kinetics of the fast and slow phases of the EPSC decay. Only the first 20 pA of the EPSC are shown. The black line represent the trace and the thick grey line represent the slow phase of the fitted data (τslow). Black lines in the Insets show the entire EPSC and thick grey lines show either the fast phase of the EPSC (τfast) or the two phase exponential fit (τfast+slow). Scale bar in inset represents 50 pA and 50 ms. Solid circles indicate the 90 ms time point after the peak of the EPSC used in later calculations. C, Bar graphs representing the average time constants (τ ± SE) for the fast phase, Ca, and the slow phase, Cb, of the EPSC decay for each of the cell types in the superficial mEC. S, IS, and NS data are represented by white, grey, and black bars, respectively. Differences between the cell types were not significant (N.S.) for either measure. The fast time constants (ms) for S, IS, and NS neurons were 14.0±1.0 (N=14), 13.0±1.4 (N=16), and 15.8±1.3 (N=14), respectively. The slow time constants (ms) for S, IS, and NS neurons were 121.2±11.7 (N=11), 114.4±17.6 (N=8), and 128.4±10.3 (N=11), respectively. D, Scatter plots showing the EPSC amplitudes at the peak, Da, and 90 ms after the peak, Db, for each cell type in the superficial mEC. S, IS, and NS data are represented by white, grey, and black circles, respectively. Mean peak amplitudes (pA) are represented by horizontal lines and are −258.9±38.2 (N=23), −363.1±39.7 (N=16), and −221.9±35.9 (N=24) for S, IS, and NS neurons, respectively. The difference between IS and NS neurons was significant (*, p<0.05). Mean amplitudes at 90 ms after the peak (pA) are represented by horizontal lines and are −3.5±0.8 (N=23), −8.3±2.0 (N=16), and −14.1±2.3 (N=24) for S, IS, and NS neurons, respectively. The difference between S and IS neurons (*, p<0.05), as well as S and NS neurons (***, p<0.001), was significant. E, Bar graph representing the relative amplitude of the EPSC at 90 ms as a percentage of the peak. S, IS, and NS data are represented by white, grey, and black bars, respectively. On a neuron-by-neuron basis, the amplitude of the EPSC at 90 ms was 1.2±0.2% (N=23), 2.4±0.6% (N=16), and 7.1±0.8% (N=24) of the peak for S, IS, and NS neurons, respectively. The differences between S and NS neurons, as well as between IS and NS neurons, was significant (****, p<0.0001). Additionally, the difference between S and IS neurons was significant (p < 0.05).
The slow component of EPSCs in NS, pyramidal-like neurons often had strikingly larger amplitudes than those observed in S and IS neurons (as in Fig. 2A). To evaluate this more carefully, we first sought to determine if the peak amplitudes of the maximal stimulation evoked EPSCs differed across cell types. The amplitudes of these EPSCs varied over a large range for all cell types (−54 to −876 pA), and the mean amplitudes were as follows (pA ± SE): −258.9±38.2 (N=23), −363.1±39.7 (N=16), and −221.9±35.9 (N=24) for S, IS, and NS neurons, respectively (Fig. 2Da). While the mean amplitude of the IS neuron EPSC was significantly larger than the NS neuron’s (p < 0.05), the difference between S and NS neurons was not significant.
Likewise, we sought to measure the amplitude of the slow component of the control EPSC. Using the fast and slow time constants (Fig. 2Ca–Cb), it was determined that the fast component of the EPSC decays to ~0.3–0.1%, while the slow component decays to ~45–50%, of its initial value at 90 ms. Thus, 90 ms after the peak was chosen as the time point to measure the amplitude of the slow component (as indicated in Fig. 2B, solid circles). The mean amplitudes of the non-NMDA EPSCs at 90 ms were (pA ± SE): −3.5±0.8 (N=23), −8.3±2.0 (N=16), and −14.1±2.3 (N=24) for S, IS, and NS neurons, respectively (Fig. 2Db). In contrast to what was observed for their peak amplitudes (Fig. 2Da), the mean amplitude of the non-NMDA EPSC at 90 ms in S neurons was significantly smaller than that from both the IS neurons (p < 0.05) and the NS neurons (p < 0.001).
Finally, we calculated the percent contribution of the non-NMDA EPSC at 90 ms to the EPSC peak on an experiment-by-experiment basis (Fig. 2E). The amplitude of the EPSC at 90 ms was 1.2±0.2% (N=23), 2.4±0.6% (N=16), and 7.1±0.8% (N=24) of the peak for S, IS, and NS neurons, respectively. The differences between S and NS neurons, as well as between IS and NS neurons, was significant (p < 0.0001). Additionally, the difference between S and IS neurons was significant (p < 0.05). When measured in this way, it was concluded that the slow component contributes significantly more to combined non-NMDA EPSC in NS, pyramidal-like neurons of Layer III than in either S or IS neurons.
Postsynaptic KARs in Neurons of the Superficial mEC
In order to determine if neurons of the superficial mEC possessed postsynaptic KARs that could be activated by the synaptic release of glutamate, KAR mediated EPSCs were pharmacologically isolated by adding the AMPA receptor antagonist GYKI 52466 (GYKI) (100 μM) to the perfusion solution. In addition to being resistant to GYKI, KAR-mediated EPSCs have decay kinetics slower than their AMPA receptor mediated counterparts, and are inhibited by CNQX (For reviews, see (Chittajallu et al., 1999, Frerking and Nicoll, 2000, Lerma et al., 2001, Lerma, 2003, Lerma, 2006)). Thus, we used these additional criteria to establish that the GYKI-resistant EPSCs in mEC neurons were indeed mediated by postsynaptic KARs. Representative traces of responses both before and after adding GYKI can be seen in Figure 3A. In all neuronal types, GYKI-resistant EPSCs were observed, although the amplitudes and decay kinetics of these GYKI-resistant currents were different between cell types.
Figure 3. Characterization of GYKI-resistant EPSCs in mEC Superficial Layer Neurons.
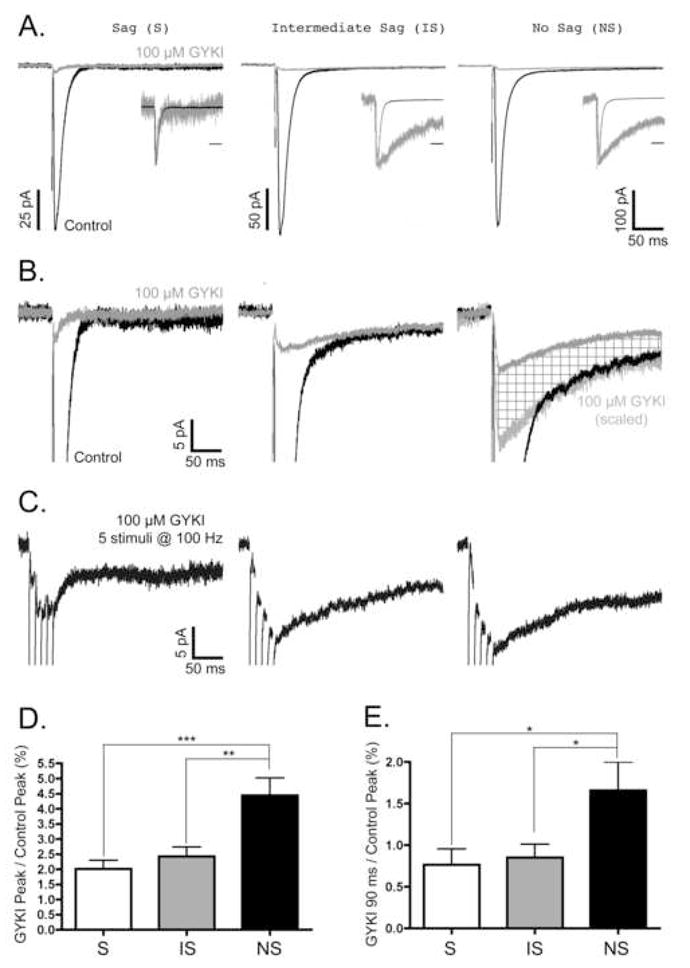
Neurons were voltage clamped at −70 mV, and low frequency (0.1–0.2 Hz) or high frequency (5 at 100 Hz) stimuli were used to evoke EPSCs as described in Materials and Methods. All EPSCs in each column of panels A–C were recorded from the same S, IS, and NS neurons. All traces are the average of 15–30 responses under each condition. A, Representative traces of Control EPSCs (black) and EPSCs resistant to 100 μM GYKI 52466 (grey). Insets illustrate control and GYKI-resistant EPSCs normalized to their peak amplitude; time scale bars in insets are 50 ms. Note that while the GYKI-resistant EPSCs from IS and NS neurons have decay kinetics dramatically slower than the control EPSC, the GYKI-resistant EPSC from the S neuron had kinetics that closely matched the control EPSC. B, Magnification of the first 20 pA of the EPSCs illustrated in panel A. Again, control (black) and GYKI-resistant (grey) EPSCs are shown. In the NS neuron, note the additional trace representing the GYKI-resistant EPSC when its amplitude is scaled to match the amplitude of the slow phase of the control EPSC (light grey EPSC). The difference between the GYKI-resistant EPSC and the scaled GYKI-resistant EPSC is indicated by cross-hatched fill. Scale bars associated with S neuron traces also apply to IS and NS neuron traces. C, Summation of GYKI-resistant EPSCs in response to high frequency stimulation. All EPSCs were evoked by a train of 5 stimuli at 100 Hz. Scale bars associated with S neuron traces also apply to IS and NS neuron traces. D,E, The contribution of GYKI-resistant EPSCs to the control non-NMDA EPSCs in mEC neurons. The amplitude of the GYKI-resistant EPSC at its peak, D, or at 90 ms after the peak, E, was divided by the peak amplitude of the control EPSC (% ± SE). In both graphs, S, IS, and NS data are represented by white, grey, and black bars, respectively. The % contributions of the GYKI-resistant EPSCs at their peak for S, IS, and NS neurons were 2.0±0.3% (N=14), 2.4±0.3% (N=16), and 4.4±0.6% (N=14), respectively. The % contributions of the GYKI-resistant EPSCs at 90 ms after the peak for S, IS, and NS neurons were 0.8±0.2% (N=14), 0.9±0.2% (N=16), and 1.7±0.3% (N=14), respectively. For the peak GYKI-resistant EPSCs, significant differences were found between S and NS (***, p<0.001), as well as between IS and NS neurons (**, p<0.01). For GYKI-resistant EPSCs 90 ms after the peak, significant differences were found between S and NS (*, p<0.05), as well as between IS and NS neurons (*, p<0.05).
To examine the decay kinetics of the GYKI-resistant currents, the peaks of the control and GYKI-resistant EPSCs were normalized (Fig. 3A, insets). In most neurons, the majority of the GYKI-resistant EPSC had decay kinetics far slower than the control EPSC (Fig. 3A, IS and NS neuron insets). However, in some cases, the GYKI-resistant EPSC had decay kinetics nearly identical to the control EPSC (Fig. 3A, S inset). Based on the kinetics of the residual EPSC in these cells, it was concluded that these GYKI-resistant EPSCs were likely being mediated by a small fraction of AMPA receptors that were not inhibited by 100 μM GYKI 52466. This was most common in S neurons, where 7 of 14 neurons had a small residual AMPA receptor mediated component, and 4 of those 7 did not have a clearly detectable slow KAR mediated component to the GYKI-resistant EPSC (as in Fig. 3A, S neuron). This is in contrast to IS and NS neurons, where all had a clearly detectable slow, KAR mediated component to the GYKI-resistant EPSC, and only 4/16 and 5/14 neurons, respectively, had a small residual AMPA receptor mediated component. The decay of these slow GYKI-resistant EPSCs were fit with a single exponential function, and the corresponding mean time constants (ms ± SE) for S, IS, and NS neurons were 139.8±13.8 (N=10), 143.9±10.1 (N=12), and 141.8±16.3 (N=12), respectively. These time constants were not significantly different from one another. When summed, the mean time constant for the GYKI-resistant EPSC was 142.9±7.7 ms (N=34). This was not significantly different than the mean time constant for the slow decay phase of the control EPSC (122.0±7.2 ms, N=30).
Next, we examined if the slow decay component of the control EPSC matched the amplitude of the GYKI-resistant EPSC (Fig. 3B). In some cases, both the decay kinetics and amplitude of the GYKI-resistant EPSC closely matched the slow phase of the control EPSC (Fig. 3B, IS neuron). However, it was most often the case that the GYKI-resistant EPSCs had significantly smaller amplitudes than the slow components of the control EPSCs (as in Fig. 3B, NS neuron). The GYKI-resistant EPSCs precisely match the control only when scaled to compensate for their decreased amplitude (Fig. 3B, NS neuron, light grey trace with cross-hatched fill). As has been shown previously (Paternain et al., 1995, Wilding and Huettner, 1995, Bleakman et al., 1996), this suggests that the concentration of GYKI used (100 μM) was sufficient to partially block the slowly decaying KAR EPSC. To estimate the sensitivity of the KAR EPSC to 100 μM GYKI, we quantified the relative amplitude of the GYKI-resistant EPSC at 90 ms to the control EPSC at 90 ms. Differences between the cell types were not significant (N.S.) although GYKI significantly reduced the currents within cell types. The GYKI-resistant EPSC amplitude relative to the control EPSC at 90 ms was 43.9±11.5% (N=6), 37.5±6.8% (N=12), and 28.9±3.8% (N=14) for S, IS, and NS neurons, respectively.
It has long been appreciated that KAR mediated EPSCs at other synapses summate with short trains of high-frequency stimuli (Castillo et al., 1997, Vignes and Collingridge, 1997). To determine if this was the case for the slowly decaying KAR EPSCs in the mEC, trains of 5 stimuli at 100 Hz were applied to the extracellular stimulating electrode. Not surprisingly, these short tetanic stimulations generated slowly decaying EPSCs with potentiating amplitudes in the majority of neurons (Fig. 3C, IS and NS neurons). However, in neurons that did not have a clear KAR EPSC in response to a single stimulus (Fig. 3A–B, S neuron), the EPSC in response to the high frequency stimulation did not have a decay time constant in the range expected for the KAR mediated EPSCs (~100–150 ms); instead, either no prolonged inward current was observed or a very small amplitude, very slowly decaying current was observed (Fig. 3C, S neuron).
As previously mentioned, a GYKI-resistant EPSC was observed in all neuronal types of the superficial mEC. However, the relative amplitudes of these GYKI-resistant currents (and the likelihood of a slow KAR mediated component even occurring) were significantly different between cell types. The GYKI-resistant fraction of the peak non-NMDA EPSC (GYKI Peak/Control Peak) was 2.0±0.3% (N=14), 2.4±0.3% (N=16), and 4.4±0.6% (N=14) for S, IS, and NS neurons, respectively (Fig. 3D). The difference between the S and NS, as well as between the IS and NS neurons, was significant (p < 0.001 and p < 0.01, respectively). However, quantifying the relative amplitude of the KAR mediated EPSC by measuring the peak amplitude was complicated by the fact that there was an incomplete block of the AMPA receptor mediated EPSC (as in Fig. 3A–B, S neuron). Overestimation of the KAR component due to incomplete block of the AMPA receptor mediated EPSC was therefore avoided by measuring the percent of the GYKI-resistant EPSC at 90 ms relative to the control EPSC peak. When measured in this way, it was found that the KAR EPSC’s contribution to the non-NMDA EPSC was 0.8±0.2% (N=14), 0.9±0.2% (N=16), and 1.7±0.3% (N=14) for S, IS, and NS neurons, respectively (Fig. 3E). Significant differences were found between S and NS neurons, as well as between IS and NS neurons (p < 0.05). Thus, KARs mediate a larger portion of the combined non-NMDA EPSC in Layer III NS neurons than in Layer II S or Layer II/III IS neurons.
To confirm that the slowly decaying GYKI-resistant EPSCs were mediated by postsynaptic KARs, these current responses were tested for their sensitivity to 10 μM CNQX (Fig. 4). EPSCs in response to both single low frequency stimulation (Fig. 4A) and to short trains of high frequency stimulation (Fig. 4B) were tested in all three principle cell types of the superficial mEC. As can be seen, GYKI-resistant EPSCs from all cell types, and in response to both stimulation paradigms, were inhibited by CNQX.
Figure 4. GYKI-resistant EPSCs are inhibited by 10 μM CNQX.
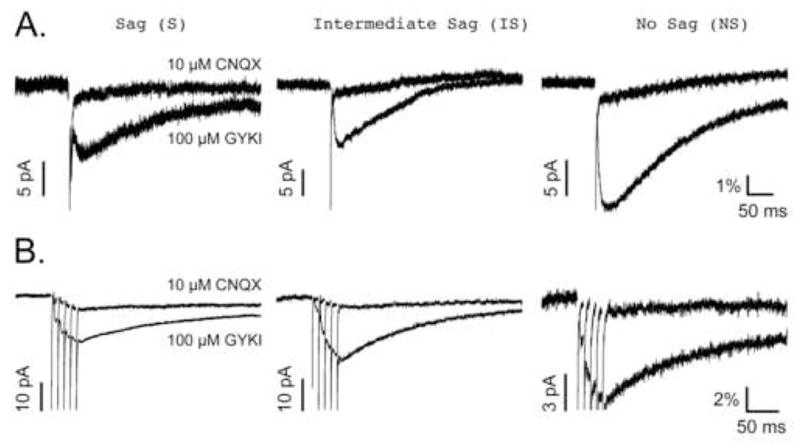
All traces are the average of 15–30 responses under each condition. A, GYKI-resistant and CNQX-resistant EPSCs evoked by low frequency (0.1–0.2 Hz) stimulation. B, GYKI-resistant and CNQX-resistant EPSCs evoked by high frequency (5 stimuli at 100 Hz) stimulation. The amplitudes of the EPSCs share a common scale bar associated with the NS neuron traces in both panels. These scale bars represent the relative contribution of the GYKI-resistant EPSCs to the control EPSC (% of control) as described in Materials and Methods. An additional scale bar representing the varying amplitudes (pA) of each set of traces is shown to the left of the GYKI-resistant EPSC peaks in all cases. Note that regardless of the stimulation protocol used, the NS neuron’s GYKI-resistant EPSC contributes more to the control non-NMDA EPSC than do those from either S or IS neurons.
Finally, we sought to confirm these findings using another agent to pharmacologically isolate the KAR EPSCs in these neurons. In this case, we used 1 μM NBQX, which has been reported to have a higher affinity at this concentration for AMPA receptors over KAR receptors (Wilding and Huettner, 1996, Bureau et al., 1999, Cossart et al., 2002, Epsztein et al., 2005). Representative recordings of non-NMDA EPSCs, both before and after adding 1 μM NBQX, from S an NS neurons, are shown in Figure 5A. Again, there is no slow component to the control EPSC in the representative S neuron, while the NS neuron has a prominent slow EPSC despite having a peak amplitude slightly smaller than the S neuron (Fig. 5A; similar to Fig. 2A). When 1 μM NBQX is added, there is a resistant EPSC in the NS neuron whose amplitude and kinetics closely match the slow component of the control EPSC. However, the small NBQX resistant EPSC in the S neuron is kinetically similar to the fast component of the control EPSC. This is more clearly illustrated when the peaks of these EPSCs are normalized (Fig. 5A, insets). Furthermore, all of these NBQX-resistant currents were sensitive to 10–50 μM CNQX (Fig. 5B). The contribution of these KAR mediated currents to the combined non-NMDA EPSC was determined by comparing the amplitude of the NBQX-resistant EPSC at 90 ms to the peak of the control EPSC. When measured in this way, it was found that the KAR mediated EPSC in NS was 2.2±0.6% (N=10) of the non-NMDA EPSC, while the KAR EPSC in S neurons was 0.6±0.1% (N=9) of the non-NMDA EPSC. Again, the KAR contribution to the non-NMDA EPSC in NS neurons was significantly greater than those in S neurons (p < 0.05).
Figure 5. Characterization of NBQX-resistant EPSCs in mEC Superficial Layer Neurons.
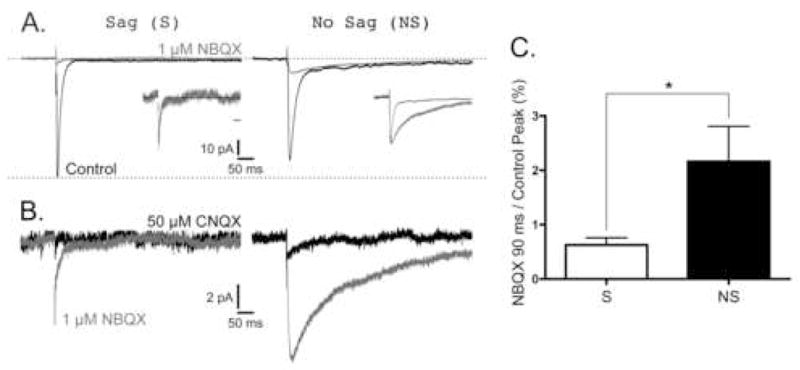
Neurons were voltage clamped at −70 mV, and low frequency (0.1–0.2 Hz) stimuli were used to evoked EPSCs as described in Materials and Methods. All EPSCs in each column of panels A–B were recorded from the same S and NS neurons. All traces are the average of 15–30 responses under each condition. A, Representative traces of Control EPSCs (black) and EPSCs resistant to 1 μM NBQX (grey). Scale bars located center apply to all traces. Upper dashed line represents baseline current before stimulation, and lower dashed line represents the amplitude of the peak non-NMDA EPSC from the S neuron. Insets illustrate control and GYKI-resistant EPSCs normalized to their peak amplitude; time scale bars in insets are 50 ms. Note that while the NBQX-resistant EPSCs from the NS neuron has decay kinetics dramatically slower than the control EPSC, the NBQX-resistant EPSC from the S neuron had kinetics that closely matched the control EPSC. B, Magnification of the first 12 pA of the NBQX-resistant EPSCs illustrated in panel A (grey) before and after adding 50 μM CNQX (black). Scale bars located center apply to all traces. C, The contribution of NBQX-resistant EPSCs to the control non-NMDA EPSCs. S and NS data are represented by white and black bars, respectively. The amplitude of the NBQX-resistant EPSC at 90 ms after the peak was divided by the peak amplitude of the control EPSC (% ± SE) and was 2.2±0.6% (N=10) of the non-NMDA EPSC for the NS neuron, while the KAR EPSC in S neurons was 0.6±0.1% (N=9) of the non-NMDA EPSC. Again, the KAR contribution to the non-NMDA EPSC in NS neurons was significantly greater than those in S neurons (p < 0.05).
DISCUSSION
The present report is the first to examine in detail the functional presence of postsynaptic KARs in the superficial layer neurons of the mEC. In doing so, we demonstrate in a number of ways that KAR EPSCs recorded from the “No Sag”, pyramidal neurons in Layer III contributed significantly more to the non-NMDA EPSC than did those recorded from either “Sag” stellate neurons in Layer II or “Intermediate Sag” neurons in Layers II/III. This is intriguing due to the recent observation that KAR activation in Layer III pyramidal neurons, as in the hippocampus (Fisahn et al., 2004), may contribute to slow wave and gamma frequency oscillations in this brain region (Cunningham et al., 2003, Cunningham et al., 2006). Additionally, given the established roles of KARs in mediating excitotoxicity, particularly in CA3 neurons of the hippocampus, we speculate that the greater functional expression of KARs in layer III pyramidal neurons of the mEC may contribute to their selective vulnerability in TLE and animal models of TLE.
Superficial Layer Neurons of the Rat Medial Entorhinal Cortex
Although the electroresponsive membrane properties and morphologies of neurons in the superficial layers of the mEC have been previously characterized by others (Alonso and Klink, 1993, Klink and Alonso, 1993, Jones, 1994, Dickson et al., 1997, Gloveli et al., 1997, van der Linden and Lopes da Silva, 1998, Heinemann et al., 2000), we performed these experiments in order to classify neurons before examination of the presence and contributions of their postsynaptic KARs. Consistent with numerous studies, we identified three primary neuronal classes. We adopted a naming convention from van der Linden and Lopes da Silva based on the presence or absence of a time-dependent inward rectification (sag) in response to hyperpolarizing current pulses (van der Linden and Lopes da Silva, 1998). We refer to these neuronal classes as Sag (S), Intermediate Sag (IS), and No Sag (NS) neurons. This sag potential has been attributed to the presence of Ih in these neurons (Dickson et al., 2000b). Biocytin labeling of recorded neurons revealed that NS neurons were localized to Layer III and exhibited pyramidal-like morphology. In contrast, S neurons had a stellate morphology and were predominantly located in Layer II of the mEC. Finally, IS neurons were found in both Layers II and III and varied between stellate-like and pyramidal-like morphologies. This is consistent with previous reports which found that the morphologies of mEC neurons with IS-like characteristics were in some cases pyramidal-like (Alonso and Klink, 1993), in other cases stellate-like (Jones, 1994), and in other cases referred to as “non-stellate” or “other” (Erchova et al., 2004).
Postsynaptic Kainate Receptors of the mEC
Although not universally present, functional postsynaptic KARs have been shown to be present in a variety of cell types such as cerebellar granule cells and Golgi cells (Bureau et al., 2000), retinal bipolar cells (DeVries and Schwartz, 1999), neurons of the superficial dorsal horn (Li et al., 1999), lateral superior olive (Vitten et al., 2004), motor & somatosensory cortex (Kidd and Isaac, 1999, Ali, 2003, Eder et al., 2003), the amygdala (Gryder and Rogawski, 2003, Rogawski et al., 2003), the anterior cingulate cortex (Wu et al., 2005), the globus pallidus (Jin et al., 2006), and a variety of neurons in the hippocampus (Castillo et al., 1997, Vignes and Collingridge, 1997, Cossart et al., 1998, Frerking et al., 1998, Frerking et al., 1999, Cossart et al., 2002). In accordance with these previous studies, KAR mediated EPSCs in the mEC were defined by their resistance to 100 μM GYKI 52466 or 1 μM NBQX, their small amplitude and slow kinetics, the ability to summate during high frequency stimulation, and their inhibition by 10–50 μM CNQX.
In the present set of experiments, we aimed to quantify the relative contribution of the KAR EPSC to the non-NMDA EPSC across three neuronal types in the superficial mEC. Interestingly, regardless of the way in which the contribution of KARs to the EPSC was evaluated, the results were always qualitatively the same: NS, pyramidal neurons of Layer III always had the greatest, statistically significant, contribution of KARs when compared to the other two cell types (Figs. 2E, 3D–E, and 5C).
One variable that affected the quantification of the KAR contribution to the EPSC was that, occasionally, a small residual EPSC with fast kinetics similar, or identical, to the control EPSC was resistant to 100 μM GYKI 52466 (Fig. 3A–B, S neuron) or 1 μM NBQX (Fig. 5A, S neuron). Based on their decay times, these fast EPSCs were interpreted to be due to postsynaptic AMPA receptors that were not fully blocked by GYKI or NBQX at these concentrations; this interpretation is consistent with the reported IC50 values for GYKI 52466 and NBQX inhibition of AMPA receptors (Paternain et al., 1995, Wilding and Huettner, 1995, Bleakman et al., 1996, Wilding and Huettner, 1996). Thus, using the GYKI- or NBQX-resistant EPSC peak as the amplitude of the KAR EPSC would generate inflated values and overestimates of the KAR contribution in these cases. To address this issue, we measured the amplitude of the GYKI- or NBQX-resistant EPSC at 90 ms after the peak (Fig. 2B). At this time point, the average AMPA EPSC has decayed to <1% of its peak value, while the slower KAR EPSC only decays to approximately 50% of its peak. Although these values (Fig. 3E, 5C) underestimate the actual contribution of the KAR EPSC to the combined non-NMDA EPSC by approximately 50%, any potential contamination by activation of residual AMPA receptors is mitigated and this measure should provide a better estimate of the relative contributions of KARs between neuron types in the superficial mEC.
A second issue that needs to be considered when trying to determine the extent to which KAR activation contributes to the non-NMDA EPSC is that, in most cases, the amplitude of the GYKI- or NBQX-resistant EPSC was notably smaller than during the slow phase of the control EPSC (as in Fig. 3B, NS neuron). In these cases, 100 μM GYKI or 1 μM NBQX partially inhibited the KAR EPSC; again this is consistent with the reported IC50 values for GYKI 52466 and NBQX inhibition of KARs (Paternain et al., 1995, Wilding and Huettner, 1995, Bleakman et al., 1996, Wilding and Huettner, 1996). Therefore, the values for the KAR EPSC contribution to the combined EPSC may be substantially underestimated due to partial inhibition of the KAR EPSC by GYKI or NBQX. Although there was a trend towards greater inhibition of the KAR EPSC by GYKI in NS neurons, the inhibition was not significantly different across neuronal classes. Therefore, this consideration should not affect the relative differences in contributions as reported in Figures 3E and 5C, although it would result in a substantial underestimation of the actual contribution.
Given these considerations, particularly those involving limitations in the pharmacological agents used, perhaps the most accurate means by which to measure the KAR EPSC contribution to the non-NMDA EPSC is by comparing the amplitudes of the peak and the slow component (measured at 90 ms after the peak) of the control EPSC (Fig. 2E). Based on the time constants for the decay of the slow component of the control and GYKI-resistant EPSCs, the peak of the KAR EPSC can be estimated to be ~2x the amplitude measured at 90 ms. Additionally, the peak of the slow component can also be estimated on an experiment-by-experiment basis by the “A” value of the exponential fit (Amplitude (pA) = A*e^(−t/τ) + C, where A is the span, C is the plateau, τ is the time constant, and t is the time). When these comparisons are examined for NS neurons, the Control 90 ms/Peak EPSC is 7.1±0.8% (N=24, Fig. 2E), ~2x of this value, which estimates the slow component’s peak as a fraction of the combined peak, is 14.2%, and the mean A value for the slow component of the control EPSC was 12.4±2.3% (N=8). Therefore, our results indicate that KARs mediate approximately 12–14% of the non-NMDA EPSC peak in NS neurons of Layer III. This estimated value is slightly larger than those reported for other neurons where KAR EPSCs have been shown (≤ 10% in response to a single stimulation) (Lerma, 2003, Marchal and Mulle, 2004, Pinheiro and Mulle, 2006).
Although it is not clear why the amplitude of KAR mediated EPSCs is small compared to those of AMPA receptors, it does not appear to be due to diffusion of glutamate out of the synaptic cleft to extrasynaptic KARs (Bureau et al., 2000). Despite their small amplitude, it is generally accepted that KARs play a significant role in synaptic transmission. For instance, the slow decay kinetics of KAR EPSCs results in a total charge transfer similar to that of AMPA EPSCs in CA1 interneurons (Frerking et al., 1998). Furthermore, the slow decay kinetics of KARs appear to mediate a large influence on membrane potential due to summation of EPSCs at physiologically relevant firing rates (Frerking and Ohliger-Frerking, 2002). This temporal summation of KAR mediated EPSCs may also play a role in the generation and maintenance of slow wave oscillations in layer III pyramidal neurons of the mEC (Cunningham et al., 2006).
Kainate receptors are involved in Excitotoxicity and Temporal Lobe Epilepsy
KARs have long been implicated in the pathophysiology of TLE (see review by (Ben-Ari and Cossart, 2000)). Systemic or intracerebral injection of KA is commonly used to model TLE since it causes status epilepticus and ultimately results in chronic epilepsy and a pattern of cell loss that is similar to that found in patients with TLE. It has been suggested that CA3 neurons of the hippocampus are among the most responsive neurons to KA since these neurons degenerate following local or distal KA injections (Nadler et al., 1978, Nadler et al., 1980). In support of this, a considerable amount of work has clearly demonstrated the presence of postsynaptic KARs at the mossy fiber-CA3 synapse, and GluR6-deficient mice are less susceptible to KA-induced seizures and excitotoxic neuronal death in the CA3 region of the hippocampus (Mulle et al., 1998, Fisahn et al., 2004). Furthermore, the intracerebroventricular injection of a peptide that disrupts GluR6-PSD95-MLK3 signaling can prevent kainate-induced neuronal loss in CA3 neurons (Liu et al., 2006). In contrast, enhanced expression of GluR6 leads to a excitotoxic degeneration in cultured fibroblasts as well as CA3 and CA1 neurons from hippocampal slice cultures (Bergold et al., 1993).
KARs are also implicated in seizure generation. Overexpression of GluR6 in rat hippocampus produces seizures (Telfeian et al., 2000), and mice deficient in GluR6 editing are more susceptible to KA-induced seizures (Vissel et al., 2001). Pharmacologically, the anticonvulsant topiramate can block GluR5-containing KARs and can protect against seizures induced by the GluR5-selective agonist ATPA (Gryder and Rogawski, 2003, Rogawski et al., 2003, Kaminski et al., 2004). Other GluR5 selective antagonists, such as LY377770 & LY382884, can prevent the induction and maintenance of pilocarpine-induced limbic seizures and epileptiform activity induced by electrical stimulation, both in vitro and in vivo (Smolders et al., 2002). Finally, KARs are aberrantly expressed on granule cells after mossy fiber sprouting in epileptic rats (Epsztein et al., 2005).
As discussed earlier, Layer III pyramidal neurons of the mEC, like CA3 neurons of the hippocampus, rapidly degenerate following an episode of status epilepticus in response to systemic injection of kainate. Although the roles that KARs play in the hippocampus have been extensively studied, this report is the first to examine in detail the contributions of postsynaptic KARs to synaptic transmission in the superficial layer neurons of the mEC. Since KARs contribute more to the non-NMDA EPSC in the Layer III pyramidal neurons than in neurons of Layers II, they may contribute to the vulnerability of these neurons in TLE. In any event, information gained from these experiments should provide a necessary first step towards understanding the selective vulnerability of Layer III neurons to KA and the role the mEC plays in the development and maintenance of TLE.
Acknowledgments
The authors thank the Anticonvulsant Drug Development program for the use of lab space and Dr. Roy Smeal for numerous helpful conversations.
GRANTS
This work was supported by NS544210 (KSW), an Epilepsy Foundation of America Junior Investigator Award (KSW), and an Epilepsy Foundation of America, Milken Family Foundation Post Doctoral Fellowship (PJW).
ABBREVIATIONS
- EPSC
Excitatory Postsynaptic Current
- KAR
Kainate Receptor
- mEC
Medial Entorhinal Cortex
- TLE
Temporal Lobe Epilepsy
- S
Sag
- IS
Intermediate Sag
- NS
No Sag
Footnotes
Publisher's Disclaimer: This is a PDF file of an unedited manuscript that has been accepted for publication. As a service to our customers we are providing this early version of the manuscript. The manuscript will undergo copyediting, typesetting, and review of the resulting proof before it is published in its final citable form. Please note that during the production process errors may be discovered which could affect the content, and all legal disclaimers that apply to the journal pertain.
References
- Aaron GB, Wilcox KS, Dichter MA. Different patterns of synaptic transmission revealed between hippocampal CA3 stratum oriens and stratum lucidum interneurons and their pyramidal cell targets. Neuroscience. 2003;117:169–181. doi: 10.1016/s0306-4522(02)00832-1. [DOI] [PubMed] [Google Scholar]
- Ali AB. Involvement of post-synaptic kainate receptors during synaptic transmission between unitary connections in rat neocortex. Eur J Neurosci. 2003;17:2344–2350. doi: 10.1046/j.1460-9568.2003.02677.x. [DOI] [PubMed] [Google Scholar]
- Alonso A, Klink R. Differential electroresponsiveness of stellate and pyramidal-like cells of medial entorhinal cortex layer II. J Neurophysiol. 1993;70:128–143. doi: 10.1152/jn.1993.70.1.128. [DOI] [PubMed] [Google Scholar]
- Bahn S, Volk B, Wisden W. Kainate receptor gene expression in the developing rat brain. J Neurosci. 1994;14:5525–5547. doi: 10.1523/JNEUROSCI.14-09-05525.1994. [DOI] [PMC free article] [PubMed] [Google Scholar]
- Barton ME, White HS, Wilcox KS. The effect of CGX-1007 and CI-1041, novel NMDA receptor antagonists, on NMDA receptor-mediated EPSCs. Epilepsy Res. 2004;59:13–24. doi: 10.1016/j.eplepsyres.2003.12.011. [DOI] [PubMed] [Google Scholar]
- Bear J, Fountain NB, Lothman EW. Responses of the superficial entorhinal cortex in vitro in slices from naive and chronically epileptic rats. J Neurophysiol. 1996;76:2928–2940. doi: 10.1152/jn.1996.76.5.2928. [DOI] [PubMed] [Google Scholar]
- Ben-Ari Y, Cossart R. Kainate, a double agent that generates seizures: two decades of progress. Trends Neurosci. 2000;23:580–587. doi: 10.1016/s0166-2236(00)01659-3. [DOI] [PubMed] [Google Scholar]
- Bergold PJ, Casaccia-Bonnefil P, Zeng XL, Federoff HJ. Transsynaptic neuronal loss induced in hippocampal slice cultures by a herpes simplex virus vector expressing the GluR6 subunit of the kainate receptor. Proc Natl Acad Sci U S A. 1993;90:6165–6169. doi: 10.1073/pnas.90.13.6165. [DOI] [PMC free article] [PubMed] [Google Scholar]
- Bleakman D, Ballyk BA, Schoepp DD, Palmer AJ, Bath CP, Sharpe EF, Woolley ML, Bufton HR, Kamboj RK, Tarnawa I, Lodge D. Activity of 2,3-benzodiazepines at native rat and recombinant human glutamate receptors in vitro: stereospecificity and selectivity profiles. Neuropharmacology. 1996;35:1689–1702. doi: 10.1016/s0028-3908(96)00156-6. [DOI] [PubMed] [Google Scholar]
- Bragin A, Wilson CL, Engel J., Jr Chronic epileptogenesis requires development of a network of pathologically interconnected neuron clusters: a hypothesis. Epilepsia. 2000;41(Suppl 6):S144–152. doi: 10.1111/j.1528-1157.2000.tb01573.x. [DOI] [PubMed] [Google Scholar]
- Bureau I, Bischoff S, Heinemann SF, Mulle C. Kainate receptor-mediated responses in the CA1 field of wild-type and GluR6-deficient mice. J Neurosci. 1999;19:653–663. doi: 10.1523/JNEUROSCI.19-02-00653.1999. [DOI] [PMC free article] [PubMed] [Google Scholar]
- Bureau I, Dieudonne S, Coussen F, Mulle C. Kainate receptor-mediated synaptic currents in cerebellar Golgi cells are not shaped by diffusion of glutamate. Proc Natl Acad Sci U S A. 2000;97:6838–6843. doi: 10.1073/pnas.97.12.6838. [DOI] [PMC free article] [PubMed] [Google Scholar]
- Castillo PE, Malenka RC, Nicoll RA. Kainate receptors mediate a slow postsynaptic current in hippocampal CA3 neurons. Nature. 1997;388:182–186. doi: 10.1038/40645. [DOI] [PubMed] [Google Scholar]
- Chittajallu R, Braithwaite SP, Clarke VR, Henley JM. Kainate receptors: subunits, synaptic localization and function. Trends Pharmacol Sci. 1999;20:26–35. doi: 10.1016/s0165-6147(98)01286-3. [DOI] [PubMed] [Google Scholar]
- Cossart R, Epsztein J, Tyzio R, Becq H, Hirsch J, Ben-Ari Y, Crepel V. Quantal release of glutamate generates pure kainate and mixed AMPA/kainate EPSCs in hippocampal neurons. Neuron. 2002;35:147–159. doi: 10.1016/s0896-6273(02)00753-5. [DOI] [PubMed] [Google Scholar]
- Cossart R, Esclapez M, Hirsch JC, Bernard C, Ben-Ari Y. GluR5 kainate receptor activation in interneurons increases tonic inhibition of pyramidal cells. Nat Neurosci. 1998;1:470–478. doi: 10.1038/2185. [DOI] [PubMed] [Google Scholar]
- Cunningham MO, Davies CH, Buhl EH, Kopell N, Whittington MA. Gamma oscillations induced by kainate receptor activation in the entorhinal cortex in vitro. J Neurosci. 2003;23:9761–9769. doi: 10.1523/JNEUROSCI.23-30-09761.2003. [DOI] [PMC free article] [PubMed] [Google Scholar]
- Cunningham MO, Pervouchine DD, Racca C, Kopell NJ, Davies CH, Jones RS, Traub RD, Whittington MA. Neuronal metabolism governs cortical network response state. Proc Natl Acad Sci U S A. 2006;103:5597–5601. doi: 10.1073/pnas.0600604103. [DOI] [PMC free article] [PubMed] [Google Scholar]
- DeVries SH, Schwartz EA. Kainate receptors mediate synaptic transmission between cones and ‘Off’ bipolar cells in a mammalian retina. Nature. 1999;397:157–160. doi: 10.1038/16462. [DOI] [PubMed] [Google Scholar]
- Dickson CT, Magistretti J, Shalinsky M, Hamam B, Alonso A. Oscillatory activity in entorhinal neurons and circuits. Mechanisms and function. Ann N Y Acad Sci. 2000a;911:127–150. doi: 10.1111/j.1749-6632.2000.tb06723.x. [DOI] [PubMed] [Google Scholar]
- Dickson CT, Magistretti J, Shalinsky MH, Fransen E, Hasselmo ME, Alonso A. Properties and role of I(h) in the pacing of subthreshold oscillations in entorhinal cortex layer II neurons. J Neurophysiol. 2000b;83:2562–2579. doi: 10.1152/jn.2000.83.5.2562. [DOI] [PubMed] [Google Scholar]
- Dickson CT, Mena AR, Alonso A. Electroresponsiveness of medial entorhinal cortex layer III neurons in vitro. Neuroscience. 1997;81:937–950. doi: 10.1016/s0306-4522(97)00263-7. [DOI] [PubMed] [Google Scholar]
- Du F, Eid T, Lothman EW, Kohler C, Schwarcz R. Preferential neuronal loss in layer III of the medial entorhinal cortex in rat models of temporal lobe epilepsy. J Neurosci. 1995;15:6301–6313. doi: 10.1523/JNEUROSCI.15-10-06301.1995. [DOI] [PMC free article] [PubMed] [Google Scholar]
- Du F, Whetsell WO, Jr, Abou-Khalil B, Blumenkopf B, Lothman EW, Schwarcz R. Preferential neuronal loss in layer III of the entorhinal cortex in patients with temporal lobe epilepsy. Epilepsy Res. 1993;16:223–233. doi: 10.1016/0920-1211(93)90083-j. [DOI] [PubMed] [Google Scholar]
- Eder M, Becker K, Rammes G, Schierloh A, Azad SC, Zieglgansberger W, Dodt HU. Distribution and properties of functional postsynaptic kainate receptors on neocortical layer V pyramidal neurons. J Neurosci. 2003;23:6660–6670. doi: 10.1523/JNEUROSCI.23-16-06660.2003. [DOI] [PMC free article] [PubMed] [Google Scholar]
- Epsztein J, Represa A, Jorquera I, Ben-Ari Y, Crepel V. Recurrent mossy fibers establish aberrant kainate receptor-operated synapses on granule cells from epileptic rats. J Neurosci. 2005;25:8229–8239. doi: 10.1523/JNEUROSCI.1469-05.2005. [DOI] [PMC free article] [PubMed] [Google Scholar]
- Erchova I, Kreck G, Heinemann U, Herz AV. Dynamics of rat entorhinal cortex layer II and III cells: characteristics of membrane potential resonance at rest predict oscillation properties near threshold. J Physiol. 2004;560:89–110. doi: 10.1113/jphysiol.2004.069930. [DOI] [PMC free article] [PubMed] [Google Scholar]
- Fisahn A, Contractor A, Traub RD, Buhl EH, Heinemann SF, McBain CJ. Distinct roles for the kainate receptor subunits GluR5 and GluR6 in kainate-induced hippocampal gamma oscillations. J Neurosci. 2004;24:9658–9668. doi: 10.1523/JNEUROSCI.2973-04.2004. [DOI] [PMC free article] [PubMed] [Google Scholar]
- Frerking M, Malenka RC, Nicoll RA. Synaptic activation of kainate receptors on hippocampal interneurons. Nat Neurosci. 1998;1:479–486. doi: 10.1038/2194. [DOI] [PubMed] [Google Scholar]
- Frerking M, Nicoll RA. Synaptic kainate receptors. Curr Opin Neurobiol. 2000;10:342–351. doi: 10.1016/s0959-4388(00)00094-5. [DOI] [PubMed] [Google Scholar]
- Frerking M, Ohliger-Frerking P. AMPA receptors and kainate receptors encode different features of afferent activity. J Neurosci. 2002;22:7434–7443. doi: 10.1523/JNEUROSCI.22-17-07434.2002. [DOI] [PMC free article] [PubMed] [Google Scholar]
- Frerking M, Petersen CC, Nicoll RA. Mechanisms underlying kainate receptor-mediated disinhibition in the hippocampus. Proc Natl Acad Sci U S A. 1999;96:12917–12922. doi: 10.1073/pnas.96.22.12917. [DOI] [PMC free article] [PubMed] [Google Scholar]
- Gloveli T, Schmitz D, Empson RM, Dugladze T, Heinemann U. Morphological and electrophysiological characterization of layer III cells of the medial entorhinal cortex of the rat. Neuroscience. 1997;77:629–648. doi: 10.1016/s0306-4522(96)00494-0. [DOI] [PubMed] [Google Scholar]
- Gryder DS, Rogawski MA. Selective antagonism of GluR5 kainate-receptor-mediated synaptic currents by topiramate in rat basolateral amygdala neurons. J Neurosci. 2003;23:7069–7074. doi: 10.1523/JNEUROSCI.23-18-07069.2003. [DOI] [PMC free article] [PubMed] [Google Scholar]
- Heinemann U, Schmitz D, Eder C, Gloveli T. Properties of entorhinal cortex projection cells to the hippocampal formation. Ann N Y Acad Sci. 2000;911:112–126. doi: 10.1111/j.1749-6632.2000.tb06722.x. [DOI] [PubMed] [Google Scholar]
- Jin XT, Pare JF, Raju DV, Smith Y. Localization and function of pre-and postsynaptic kainate receptors in the rat globus pallidus. Eur J Neurosci. 2006;23:374–386. doi: 10.1111/j.1460-9568.2005.04574.x. [DOI] [PubMed] [Google Scholar]
- Jones RS. Synaptic and intrinsic properties of neurons of origin of the perforant path in layer II of the rat entorhinal cortex in vitro. Hippocampus. 1994;4:335–353. doi: 10.1002/hipo.450040317. [DOI] [PubMed] [Google Scholar]
- Kaminski RM, Banerjee M, Rogawski MA. Topiramate selectively protects against seizures induced by ATPA, a GluR5 kainate receptor agonist. Neuropharmacology. 2004;46:1097–1104. doi: 10.1016/j.neuropharm.2004.02.010. [DOI] [PubMed] [Google Scholar]
- Kidd FL, Isaac JT. Developmental and activity-dependent regulation of kainate receptors at thalamocortical synapses. Nature. 1999;400:569–573. doi: 10.1038/23040. [DOI] [PubMed] [Google Scholar]
- Kita H, Armstrong W. A biotin-containing compound N-(2-aminoethyl)biotinamide for intracellular labeling and neuronal tracing studies: comparison with biocytin. J Neurosci Methods. 1991;37:141–150. doi: 10.1016/0165-0270(91)90124-i. [DOI] [PubMed] [Google Scholar]
- Klink R, Alonso A. Ionic mechanisms for the subthreshold oscillations and differential electroresponsiveness of medial entorhinal cortex layer II neurons. J Neurophysiol. 1993;70:144–157. doi: 10.1152/jn.1993.70.1.144. [DOI] [PubMed] [Google Scholar]
- Kobayashi M, Wen X, Buckmaster PS. Reduced inhibition and increased output of layer II neurons in the medial entorhinal cortex in a model of temporal lobe epilepsy. J Neurosci. 2003;23:8471–8479. doi: 10.1523/JNEUROSCI.23-24-08471.2003. [DOI] [PMC free article] [PubMed] [Google Scholar]
- Kumar SS, Buckmaster PS. Hyperexcitability, interneurons, and loss of GABAergic synapses in entorhinal cortex in a model of temporal lobe epilepsy. J Neurosci. 2006;26:4613–4623. doi: 10.1523/JNEUROSCI.0064-06.2006. [DOI] [PMC free article] [PubMed] [Google Scholar]
- Lerma J. Roles and rules of kainate receptors in synaptic transmission. Nat Rev Neurosci. 2003;4:481–495. doi: 10.1038/nrn1118. [DOI] [PubMed] [Google Scholar]
- Lerma J. Kainate receptor physiology. Curr Opin Pharmacol. 2006;6:89–97. doi: 10.1016/j.coph.2005.08.004. [DOI] [PubMed] [Google Scholar]
- Lerma J, Paternain AV, Rodriguez-Moreno A, Lopez-Garcia JC. Molecular physiology of kainate receptors. Physiol Rev. 2001;81:971–998. doi: 10.1152/physrev.2001.81.3.971. [DOI] [PubMed] [Google Scholar]
- Li P, Wilding TJ, Kim SJ, Calejesan AA, Huettner JE, Zhuo M. Kainate-receptor-mediated sensory synaptic transmission in mammalian spinal cord. Nature. 1999;397:161–164. doi: 10.1038/16469. [DOI] [PubMed] [Google Scholar]
- Liu XM, Pei DS, Guan QH, Sun YF, Wang XT, Zhang QX, Zhang GY. Neuroprotection of Tat-GluR6-9c against neuronal death induced by kainate in rat hippocampus via nuclear and non-nuclear pathways. J Biol Chem. 2006;281:17432–17445. doi: 10.1074/jbc.M513490200. [DOI] [PubMed] [Google Scholar]
- Marchal C, Mulle C. Postnatal maturation of mossy fibre excitatory transmission in mouse CA3 pyramidal cells: a potential role for kainate receptors. J Physiol. 2004;561:27–37. doi: 10.1113/jphysiol.2004.069922. [DOI] [PMC free article] [PubMed] [Google Scholar]
- Mulle C, Sailer A, Perez-Otano I, Dickinson-Anson H, Castillo PE, Bureau I, Maron C, Gage FH, Mann JR, Bettler B, Heinemann SF. Altered synaptic physiology and reduced susceptibility to kainate-induced seizures in GluR6-deficient mice. Nature. 1998;392:601–605. doi: 10.1038/33408. [DOI] [PubMed] [Google Scholar]
- Nadler JV, Perry BW, Cotman CW. Intraventricular kainic acid preferentially destroys hippocampal pyramidal cells. Nature. 1978;271:676–677. doi: 10.1038/271676a0. [DOI] [PubMed] [Google Scholar]
- Nadler JV, Perry BW, Gentry C, Cotman CW. Degeneration of hippocampal CA3 pyramidal cells induced by intraventricular kainic acid. J Comp Neurol. 1980;192:333–359. doi: 10.1002/cne.901920209. [DOI] [PubMed] [Google Scholar]
- Otto JF, Yang Y, Frankel WN, White HS, Wilcox KS. A spontaneous mutation involving Kcnq2 (Kv7.2) reduces M-current density and spike frequency adaptation in mouse CA1 neurons. J Neurosci. 2006;26:2053–2059. doi: 10.1523/JNEUROSCI.1575-05.2006. [DOI] [PMC free article] [PubMed] [Google Scholar]
- Paternain AV, Morales M, Lerma J. Selective antagonism of AMPA receptors unmasks kainate receptor-mediated responses in hippocampal neurons. Neuron. 1995;14:185–189. doi: 10.1016/0896-6273(95)90253-8. [DOI] [PubMed] [Google Scholar]
- Pinheiro P, Mulle C. Kainate receptors. Cell Tissue Res. 2006;326:457–482. doi: 10.1007/s00441-006-0265-6. [DOI] [PubMed] [Google Scholar]
- Rogawski MA, Gryder D, Castaneda D, Yonekawa W, Banks MK, Lia H. GluR5 kainate receptors, seizures, and the amygdala. Ann N Y Acad Sci. 2003;985:150–162. doi: 10.1111/j.1749-6632.2003.tb07079.x. [DOI] [PubMed] [Google Scholar]
- Scharfman HE, Goodman JH, Du F, Schwarcz R. Chronic changes in synaptic responses of entorhinal and hippocampal neurons after amino-oxyacetic acid (AOAA)-induced entorhinal cortical neuron loss. J Neurophysiol. 1998;80:3031–3046. doi: 10.1152/jn.1998.80.6.3031. [DOI] [PubMed] [Google Scholar]
- Schwarcz R, Eid T, Du F. Neurons in layer III of the entorhinal cortex. A role in epileptogenesis and epilepsy? Ann N Y Acad Sci. 2000;911:328–342. doi: 10.1111/j.1749-6632.2000.tb06735.x. [DOI] [PubMed] [Google Scholar]
- Sloviter RS, Damiano BP. Sustained electrical stimulation of the perforant path duplicates kainate-induced electrophysiological effects and hippocampal damage in rats. Neurosci Lett. 1981;24:279–284. doi: 10.1016/0304-3940(81)90171-3. [DOI] [PubMed] [Google Scholar]
- Smeal RM, Gaspar RC, Keefe KA, Wilcox KS. A rat brain slice preparation for characterizing both thalamostriatal and corticostriatal afferents. J Neurosci Methods. 2006 doi: 10.1016/j.jneumeth.2006.07.007. [DOI] [PubMed] [Google Scholar]
- Smolders I, Bortolotto ZA, Clarke VR, Warre R, Khan GM, O’Neill MJ, Ornstein PL, Bleakman D, Ogden A, Weiss B, Stables JP, Ho KH, Ebinger G, Collingridge GL, Lodge D, Michotte Y. Antagonists of GLU(K5)-containing kainate receptors prevent pilocarpine-induced limbic seizures. Nat Neurosci. 2002;5:796–804. doi: 10.1038/nn880. [DOI] [PubMed] [Google Scholar]
- Telfeian AE, Federoff HJ, Leone P, During MJ, Williamson A. Overexpression of GluR6 in rat hippocampus produces seizures and spontaneous nonsynaptic bursting in vitro. Neurobiol Dis. 2000;7:362–374. doi: 10.1006/nbdi.2000.0294. [DOI] [PubMed] [Google Scholar]
- Tolner EA, Kloosterman F, Kalitzin SN, da Silva FH, Gorter JA. Physiological changes in chronic epileptic rats are prominent in superficial layers of the medial entorhinal area. Epilepsia. 2005;46(Suppl 5):72–81. doi: 10.1111/j.1528-1167.2005.01012.x. [DOI] [PubMed] [Google Scholar]
- van der Linden S, Lopes da Silva FH. Comparison of the electrophysiology and morphology of layers III and II neurons of the rat medial entorhinal cortex in vitro. Eur J Neurosci. 1998;10:1479–1489. doi: 10.1046/j.1460-9568.1998.00162.x. [DOI] [PubMed] [Google Scholar]
- Vignes M, Collingridge GL. The synaptic activation of kainate receptors. Nature. 1997;388:179–182. doi: 10.1038/40639. [DOI] [PubMed] [Google Scholar]
- Vissel B, Royle GA, Christie BR, Schiffer HH, Ghetti A, Tritto T, Perez-Otano I, Radcliffe RA, Seamans J, Sejnowski T, Wehner JM, Collins AC, O’Gorman S, Heinemann SF. The role of RNA editing of kainate receptors in synaptic plasticity and seizures. Neuron. 2001;29:217–227. doi: 10.1016/s0896-6273(01)00192-1. [DOI] [PubMed] [Google Scholar]
- Vitten H, Reusch M, Friauf E, Lohrke S. Expression of functional kainate and AMPA receptors in developing lateral superior olive neurons of the rat. J Neurobiol. 2004;59:272–288. doi: 10.1002/neu.10326. [DOI] [PubMed] [Google Scholar]
- Wilding TJ, Huettner JE. Differential antagonism of alpha-amino-3-hydroxy-5-methyl-4- isoxazolepropionic acid-preferring and kainate-preferring receptors by 2,3-benzodiazepines. Mol Pharmacol. 1995;47:582–587. [PubMed] [Google Scholar]
- Wilding TJ, Huettner JE. Antagonist pharmacology of kainate- and alpha-amino-3-hydroxy-5-methyl-4-isoxazolepropionic acid-preferring receptors. Mol Pharmacol. 1996;49:540–546. [PubMed] [Google Scholar]
- Wisden W, Seeburg PH. A complex mosaic of high-affinity kainate receptors in rat brain. J Neurosci. 1993;13:3582–3598. doi: 10.1523/JNEUROSCI.13-08-03582.1993. [DOI] [PMC free article] [PubMed] [Google Scholar]
- Wu LJ, Zhao MG, Toyoda H, Ko SW, Zhuo M. Kainate receptor-mediated synaptic transmission in the adult anterior cingulate cortex. J Neurophysiol. 2005;94:1805–1813. doi: 10.1152/jn.00091.2005. [DOI] [PubMed] [Google Scholar]