

Abstract
Background and Aims
The rising incidence of obesity and diabetes coincides with a marked increase in fructose consumption. Fructose consumption is higher in individuals with nonalcoholic fatty liver disease (NAFLD) than age- and BMI-matched controls. Because fructose elicits metabolic perturbations that may be hepatotoxic, we investigated the relationship between fructose consumption and disease severity in NAFLD.
Methods
We studied 341 adults enrolled in the NASH Clinical Research Network for whom Block food questionnaire data were collected within 3 months of a liver biopsy. Fructose consumption was estimated based on reporting (frequency × amount) of kool-aid, fruit juices, and non-dietary soda intake, expressed as servings per week, and classified into none, occasional (< 7 servings/week), and daily (> = 7 servings/week). The association of fructose intake with metabolic and histologic features of NAFLD was analyzed using multiple linear and logistic regression analyses with and without controlling for other confounding factors.
Results
Increased fructose consumption was univariately associated with decreased age (p < 0.0001), male gender (p < 0.0001), hypertriglyceridemia (p < 0.04), low HDL cholesterol (< 0.0001), decreased serum glucose (p < 0.001), increased calorie intake (p < 0.0001) and hyperuricemia (p < 0.0001). After controlling for age, gender, BMI, and total calorie intake, daily fructose consumption was associated with lower steatosis grade and higher fibrosis stage (p < 0.05 for each). In older adults (age > 48 years), daily fructose consumption was associated with increased hepatic inflammation (p < 0.05) and hepatocyte ballooning (p = 0.05).
Conclusions
In patients with NAFLD, daily fructose ingestion is associated with reduced hepatic steatosis but increased fibrosis. These results identify a readily modifiable environmental risk factor that may ameliorate disease progression in patients with NAFLD.
INTRODUCTION
The prevalence of obesity in the United States is rising, and with it, the frequency of fatty liver, nonalcoholic steatohepatitis (NASH), “cryptogenic” cirrhosis, hepatocellular carcinoma, and other end-organ complications of the metabolic syndrome (1, 2). The health-care burden and associated economic implication of the epidemic of obesity, diabetes, and the hepatic complications of the metabolic syndrome are tremendous (3). Unfortunately, no therapy for NAFLD currently exists. Therefore, a rigorous search for modifiable risk-factors and/or environmental exposures which may increase the risk of developing NASH or its transition to cirrhosis is essential.
The rapid rise in NAFLD supports a role for environmental factors in the pathogenesis of this condition. In this regard, recent studies suggest that overconsumption high fructose corn syrup (HFCS) primarily in the form of soft-drink consumption, is linked to weight gain and the rise in obesity, particularly in children and adolescents (4–6) and increases the risk for NAFLD. Table sugar (sucrose) and HFCS are the two major dietary sources of fructose. Intake of dietary fructose, either as a free monosaccharide or bound to glucose in the form of sucrose, has increased 1,000% during the past 40 years (5). First introduced into the human diet around 1970, HFCS consumption during the past decade accounts for 10% of caloric food intake (7).
Dietary fructose is a major candidate for causing NAFLD. Unlike glucose, fructose ingestion can rapidly cause fatty liver in animals, in association with the development of leptin resistance (8), microvascular disease, and vascular inflammation (9, 10). Recent data suggest that increased fructose consumption increases fat mass, de novo lipogenesis and inflammation and induces insulin resistance and post-prandial hypertriglyceridemia, particularly in overweight individuals (10–15). Further, studies have indicated that the development of NAFLD may be associated with excessive dietary fructose consumption (16, 17). Whether increased fructose consumption correlates merely with the development of NAFLD or promote the transition from NAFLD to NASH and more advanced stages of liver damage remains unclear. In view of the global increase in fructose consumption and its association with NAFLD, we sought to evaluate the influence of fructose consumption on liver histology in patients with NAFLD.
METHODS
Study design and population
We performed cross-sectional analyses using data from the NASH Clinical Research Network (NASH CRN) (18, 19) of patients diagnosed with NAFLD who were enrolled from September 2004 to March 2007. Patients enrolled in the NAFLD Database Study or in the PIVENS trial who met the following criteria were used for our analysis (N = 427): 1) age ≥18 years, 2) available liver histology data, 3) no significant alcohol consumption (> 14 drinks/week in men or > 7 drinks/week in women on average within the past 2 years) or other coexisting etiologies for chronic liver disease and 4) dietary information available from the Block food questionnaire (20) within 3 months of the liver biopsy. The NASH CRN studies were approved by the Institutional Review Boards at each participating center.
Liver histology
The primary outcome in this study was the impact of fructose consumption on liver histology in patients with NAFLD. All liver biopsies were stained with hematoxylin-eosin and Masson’s trichrome stains, and reviewed and scored centrally by the Pathology Committee according to the published NASH CRN scoring system (21). For the analyses, fibrosis stage 1a 1b, and 1c were combined and treated as stage 1.
Dietary information
Although sugar-sweetened beverages and fruit or fruit juices account for approximately 50% of total fructose consumption (22), we elected to remain conservative in our data acquisition by limiting our dietary assessment of fructose intake to beverage intake only. Dietary information was obtained via a validated dietary questionnaire (Block food questionnaire, version 1998) as self-reported usual eating habits over the prior year. For the calculation of fructose consumption, we first retrieved frequency (per week) and numbers of servings (per day) of fructose-containing beverages. The number of weekly servings of each drink were calculated as a product of frequency per week and number of servings per day and expressed as servings per week. The number of servings were then combined as total servings of fructose-containing drinks per week and used to estimate individual fructose consumption levels. For the analyses, total weekly servings of fructose-containing drinks were classified into three categories: ‘non-consumers’ (0 servings per week), ‘minimum to moderate consumers’ (> 0 and < 7 servings per week), and ‘daily consumers’ (≥7 servings per week) of fructose. The amount of fructose consumed was the primary predictor in this study. Estimates of total calories, carbohydrates, protein, and fat intake from the food frequency questionnaire were performed as previously published by Block et al (20).
Other study variables
Age, gender, ethnicity, race, body mass index (BMI), fasting lipid profiles (triglycerides, HDL-cholesterol, and LDL-cholesterol), serum uric acid, fasting serum glucose and insulin as well as data regarding the use of insulin and/or insulin sensitizing agents were collected at study enrollment. Homeostasis model assessment of insulin resistance (HOMA-IR) was calculated as [fasting glucose (g/dl) × fasting insulin (μU/ml)]/405.
Statistical analyses
Data are reported as mean ± standard deviation or number (proportion) of patients with a condition. The clinical characteristics between the three categories of fructose consumption were compared using ANOVA with Tukey’s Post Hoc Test or Chi-square tests. The associations between fructose consumption and metabolic features were assessed after adjusting for other potential confounders using multiple linear regression models with two dummy variables (‘no fructose consumers’ as a reference group) and other potential confounders. The associations between fructose consumption and histologic features of NAFLD were assessed using ordinal logistic regression models with and without adjusting for other potential confounders. In the models, four binary logistic curves with different cut-offs (stage 0 vs. 1–4, 0–1 vs. 2–4, 0–2 vs. 3–4, 0–3 vs. 4) were modeled and cumulative odds were computed by pooling a set of β estimates. Three multiple ordinal logistic regression models were developed to assess the associations between fructose consumption and each histologic features: 1) only dummy variables of fructose consumption (unadjusted), 2) the variables in 1) plus, age, gender, ethnicity, BMI, and total calorie intake (Model 1), and 3) the variables in 2) plus triglycerides, HDL-cholesterol, LDL-cholesterol, serum uric acid, and HOMA-IR (Model 2). Further, to investigate whether the influence of fructose consumption on liver histology in NAFLD differs depending on age, we assessed the associations between fructose consumption and histologic features of NAFLD in different age groups. The study population was divided into two age groups by using a median age value (48 years old). Multiple ordinal logistic regression models (Model 1 and 2) were then separately developed in each group. For the analyses in the age subgroups, fructose consumption was classified into two groups, ‘daily consumers’ vs. others. For analyses, we used JMP statistical software version 7.0 (SAS institute Inc.) and considered differences statistically significant when the p-value(s) were less than 0.05. Due to the preliminary nature of this subgroup analysis and small sample size, correction for multiple comparisons was not performed.
RESULTS
Clinical characteristics of the study population
The clinical characteristics associated with different levels of fructose consumption are summarized in Table 1. Median fructose consumption of the study population was one serving per week (first and the third quartiles 0 and 7, respectively). When the study population was classified into the following three fructose consumption categories: ‘no’, ‘minimum to moderate’ and ‘daily’ fructose consumers, it became apparent that a significant subpopulation (27.9%) consumed the equivalent of at least one fructose-containing beverage per day. The remaining patients consumed either no fructose-containing beverages (84 individuals, 19.7%), or between 1 and 6 servings/week (224 individuals, 52.5%). Higher fructose consumption was univariately associated with younger age, male gender, higher BMI, hypertriglyceridemia, lower HDL-cholesterol, hyperuricemia, and higher total calorie intake (as well as calorie intake of all three different nutrients). Fructose consumption was not associated with fasting serum insulin levels or HOMA-IR; however, ‘minimum to moderate fructose consumers’ were associated with lower fasting serum glucose compared to ‘no fructose consumers’. In the univariate analyses, no difference in histologic features was observed among the fructose consumption groups.
Table 1.
Associations between fructose consumption and clinical characteristics
| Fructose consumption (reported servings) per week |
P-value | |||
|---|---|---|---|---|
| 0 servings | > 0 and < 7 servings | ≥7 servings | ||
| N = 84 | N = 224 | N = 119 | ||
| Age | 53.9 ± 1.2 | 47.5 ± 0.8* | 41.4 ± 1.0*# | < 0.0001 |
| Gender (Male, %) | 22.6 | 38.4 | 56.3 | < 0.0001§ |
| Ethnicity (Hispanic, %) | 10.7 | 14.7 | 16.0 | 0.55§ |
| Race, (White, %) | 88.1 | 79.9 | 80.7 | 0.24§ |
| BMI, kg/m2 | 33.7 ± 0.7 | 33.6 ± 0.4 | 35.8 ± 0.6# | 0.008 |
| Triglycerides, mg/dl | 190.9 ± 15.7 | 162.9 ± 9.6 | 203.2 ± 13.2# | 0.03 |
| HDL-cholesterol, mg/dl | 47.8 ± 1.3 | 44.0 ± 0.8* | 39.4 ± 1.1*# | < 0.0001 |
| LDL-cholesterol, mg/dl | 120.0 ± 3.8 | 118.9 ± 2.3 | 122.0 ± 3.2 | 0.75 |
| Serum uric acid, mg/dl | 5.9 ± 0.2 | 6.1 ± 0.1 | 6.8 ± 0.1*# | < 0.0001 |
| Fasting serum glucose, g/dl | 111.9 ± 3.2 | 97.7 ± 2.0* | 101.6 ± 2.7 | 0.0009 |
| Fasting serum insulin, μU/ml | 26.4 ± 3.2 | 23.7 ± 2.0 | 25.7 ± 2.7 | 0.71 |
| HOMA-IR | 7.5 ± 0.8 | 5.8 ± 0.5 | 6.5 ± 0.7 | 0.19 |
| Total calorie intake, Cal/day | 1315 ± 94 | 1727 ± 58* | 2600 ± 79*# | < 0.0001 |
| Carbohydrate, Cal/day | 600 ± 45 | 786 ± 27* | 1310 ± 38*# | < 0.0001 |
| Protein, Cal/day | 224 ± 16 | 276 ± 10* | 366 ± 14*# | < 0.0001 |
| Fat, Cal/day | 513 ± 43 | 690 ± 26* | 951 ± 36*# | < 0.0001 |
| Liver histology | 0.27§ | |||
| Steatosis | ||||
| Grade 0 | 6.0 | 3.1 | 5.0 | |
| Grade 1 | 26.2 | 37.1 | 37.8 | |
| Grade 2 | 31.0 | 34.8 | 31.9 | |
| Grade 3 | 36.9 | 25.0 | 25.2 | |
| Lobular inflammation | 0.16§ | |||
| Grade 0 | 0 | 0 | 0 | |
| Grade 1 | 39.3 | 45.5 | 54.6 | |
| Grade 2 | 47.6 | 44.2 | 32.8 | |
| Grade 3 | 13.1 | 10.3 | 12.6 | |
| Ballooning | 0.44§ | |||
| Grade 0 | 23.8 | 29.0 | 31.1 | |
| Grade 1 | 29.8 | 34.8 | 28.6 | |
| Grade 2 | 46.4 | 36.2 | 40.3 | |
| Fibrosis | 0.23§ | |||
| Stage 0 | 20.5 | 28.6 | 22.2 | |
| Stage 1 | 26.5 | 32.6 | 33.3 | |
| Stage 2 | 21.7 | 19.2 | 24.8 | |
| Stage 3 | 21.7 | 14.7 | 11.1 | |
| Stage 4 | 9.6 | 4.9 | 8.6 | |
p-values from Chi-square test or ANOVA
Chi-square test.
p < 0.05 vs. “0 serving per week”;
p < 0.05 vs. “> 0 and < 7 serving per week”
Associations between fructose consumption and metabolic parameters
Since there were significant differences in age, gender, and BMI among the fructose consumption categories, we assessed the associations between fructose consumption and metabolic parameters after adjusting for these factors (Table 2a). After adjusting for age, gender, and BMI, daily fructose consumption was significantly associated with lower HDL-cholesterol and higher serum uric acid, compared to no fructose consumption; the estimated differences in mean values of these parameters between ‘no fructose consumers’ and ‘daily consumers’ (i.e., β ± SE) were −5.5 ± 1.8 mg/dl (p = 0.002) for HDL-cholesterol and 0.5 ± 0.2 mg/dl (p = 0.03) for uric acid. Compared to the no fructose consumer group, ‘minimum to moderate fructose consumers’ had lower fasting serum glucoses, triglycerides and HDL-cholesterol; the estimated differences in means between ‘no fructose consumers’ and ‘minimum to moderate consumers’ were −12.2 ± 3.9 g/dl (p = 0.002) for fasting serum glucose, −37.0 ± 18.8 mg/dl (p = 0.05) for triglycerides, and −2.7 ± 1.5 mg/dl (p = 0.07) for HDL-cholesterol. After adjustment for total calorie intake, the difference in serum uric acid between groups (‘no fructose consumers’ vs. ‘daily consumers’) was no longer significant. However, the differences in serum glucose and lipids persisted (data are not shown). We repeated the same analyses after excluding subjects who were on insulin or insulin sensitizing agents (n = 70). With the adjustment for age, gender, and BMI, the association between blood glucose levels and fructose consumption was diminished; however, daily fructose consumption remained associated with lower HDL-cholesterol (p < 0.001) compared to no fructose consumption (Table 2b)
Table 2a.
Associations between fructose consumption and metabolic features after adjusting for age, gender, and BMI in entire study population (n = 427)
| Fructose consumption (reported servings per week) |
|||||
|---|---|---|---|---|---|
| 0 servings | > 0 and < 7 servings | ≥ 7 servings | |||
| β ± SE | p-value | β ± SE | p-value | ||
| Triglycerides, mg/dl | - | −37.0 ± 18.8 | 0.05 | −1.4 ± 22.0 | 0.95 |
| HDL-cholesterol, mg/dl | - | −2.7 ± 1.5 | 0.07 | −5.5 ± 1.8 | 0.002 |
| LDL-cholesterol, mg/dl | - | −0.2 ± 4.6 | 0.97 | 4.6 ± 5.5 | 0.40 |
| Serum uric acid, mg/dl | - | 0.1 ± 0.2 | 0.60 | 0.5 ± 0.2 | 0.03 |
| Fasting serum glucose, g/dl | - | −12.2 + 3.9 | 0.002 | −6.7 + 4.6 | 0.15 |
| Fasting serum insulin, μU/ml | - | −2.5 + 3.9 | 0.52 | −1.2 + 4.6 | 0.79 |
| HOMA-IR | - | −1.5 ± 1.0 | 0.13 | −0.8 ± 1.2 | 0.51 |
Multiple lineal regression models were used to compute adjusted mean differences (vs. 0 servings). Adjusted means are presented as β-coefficient ± SE (p-value) in the table.
Table 2b.
Associations between fructose consumption and metabolic features after adjusting for age, gender, and BMI in subjects not on insulin or insulin sensitizing agents.
| Fructose consumption (reported servings per week) |
|||||
|---|---|---|---|---|---|
| 0 servings | > 0 and < 7 servings | ≥ 7 servings | |||
| β ± SE | p-value | β ± SE | p-value | ||
| Triglycerides, mg/dl | - | −20.6 ± 19.5 | 0.29 | 9.4 ± 22.7 | 0.68 |
| HDL-cholesterol, mg/dl | - | −3.6 ± 1.7 | 0.04 | −6.5 ± 2.0 | 0.001 |
| LDL-cholesterol, mg/dl | - | −1.4 ± 5.3 | 0.79 | 1.5 ± 6.2 | 0.81 |
| Serum uric acid, mg/dl | - | −0.06 ± 0.21 | 0.77 | 0.45 ± 0.24 | 0.06 |
| Fasting serum glucose, g/dl | - | −1.9 ± 2.8 | 0.50 | −0.8 ± 3.2 | 0.81 |
| Fasting serum insulin, μU/ml | - | 1.9 + 4.4 | 0.67 | 3.7 + 5.1 | 0.47 |
| HOMA-IR | - | 0.38 ± 1.01 | 0.71 | 0.96 ± 1.18 | 0.42 |
Multiple lineal regression models were used to compute adjusted mean differences (vs. 0 servings). Adjusted means are presented as β-coefficient ± SE (p-value) in the table.
Associations between fructose consumption and histologic severity of NAFLD
To investigate relationships between fructose consumption and histologic features of NAFLD, we first assessed the associations in the entire study population with and without adjustment for age, gender, Hispanic ethnicity, BMI, total calorie intake, and metabolic parameters. The cumulative odds ratios with 95% confidence intervals of the fructose consumption categories for steatosis, lobular inflammation, ballooning, and fibrosis are summarized in Table 3. Higher fructose consumption was less likely to be associated with higher histologic grades of steatosis; cumulative odds ratios with 95% confidence intervals of ‘minimum to moderate consumers’ and ‘daily consumers’ vs. ‘no fructose consumers’ were 0.7 [0.4, 1.1] (p = 0.10) and 0.4 [0.2, 0.9] (p = 0.02) respectively (in the full models/Model 2). On the other hand, daily fructose consumption was more likely associated with higher histologic stages of fibrosis; cumulative odds ratios with 95% confidence intervals of ‘daily consumption’ vs. ‘no fructose consumption’ were 2.6 [1.4, 5.0] (p = 0.004) (in the full models/Model 2).
Table 3.
Association between fructose consumption and histologic feature of NAFLD in the entire study population
| Unadjusted | Adjusted (Model 1) | Adjusted (Model 2) | ||||
|---|---|---|---|---|---|---|
| OR [95% CI] | p-value | OR [95% CI] | p-value | OR [95% CI] | p-value | |
| Steatosis | ||||||
| Fructose consumption | ||||||
| 0 serving | - | - | - | - | - | - |
| 0–7 servings | 0.7 [0.4, 1.1] | 0.09 | 0.6 [0.4, 0.9] | 0.02 | 0.7 [0.4, 1.1] | 0.10 |
| > = 7 servings | 0.6 [0.4, 1.0] | 0.06 | 0.4 [0.2, 0.8] | 0.007 | 0.4 [0.2, 0.9] | 0.02 |
| Lobular inflammation | ||||||
| Fructose consumption | ||||||
| 0 serving | - | - | - | - | - | - |
| 0–7 servings | 0.8 [0.5, 1.3] | 0.30 | 0.9 [0.5, 1.4] | 0.55 | 0.8 [0.5, 1.4] | 0.53 |
| > = 7 servings | 0.6 [0.4, 1.0] | 0.06 | 0.9 [0.5, 1.8] | 0.86 | 1.1 [0.6, 2.3] | 0.70 |
| Ballooning | ||||||
| Fructose consumption | ||||||
| 0 serving | - | - | - | - | - | - |
| 0–7 servings | 0.7 [0.4, 1.1] | 0.13 | 0.9 [0.5, 1.4] | 0.62 | 0.9 [0.5, 1.5] | 0.73 |
| > = 7 servings | 0.7 [0.4, 1.2] | 0.25 | 1.3 [0.7, 2.4] | 0.44 | 1.4 [0.7, 2.7] | 0.32 |
| Fibrosis | ||||||
| Fructose consumption | ||||||
| 0 serving | - | - | - | - | - | - |
| 0–7 servings | 0.6 [0.4, 0.9] | 0.01 | 0.8 [0.5, 1.3] | 0.44 | 0.9 [0.6, 1.5] | 0.78 |
| > = 7 servings | 0.7 [0.4, 1.2] | 0.19 | 1.7 [1.0, 3.2] | 0.07 | 2.6 [1.4, 5.0] | 0.004 |
Fructose consumption is expresses as reported servings per week. OR (cumulative odds ratio) and p-values were derived from ordinal logistic regression models (Model 1: adjusted for age, gender, BMI, Hispanic ethnicity, and total calorie intake; Model 2: adjusted for age, gender, BMI, Hispanic ethnicity, total calorie intake, triglycerides, HDL-cholesterol, LDL-cholesterol, uric acid, and HOMA-IR).
Associations between fructose consumption and histologic severity of NAFLD in different age groups
Age and/or aging-related mitochondrial dysfunction is associated with a decline in the intrinsic metabolic activity of the liver and fibrosis progression (23, 24). Therefore, we further evaluated the association between fructose consumption and histologic severity of NAFLD in different age groups to see whether the influence of fructose consumption on liver histology in NAFLD differs depending on age. The adjusted cumulative odds ratios with 95% confidence intervals of ‘daily consumption’ vs. higher levels of fructose consumption for steatosis, lobular inflammation, ballooning, and fibrosis are summarized in Table 4. Among older subjects, ‘daily consumers’ were less likely to have higher grades of steatosis (adjusted cumulative OR [95% CI] = 0.2 [0.1, 0.5], p = 0.0008 in Model 2) and were more likely to have higher grades of lobular inflammation (adjusted cumulative OR [95% CI] = 2.5 [1.0, 6.2], p < 0.05 in Model 2) and ballooning (adjusted cumulative OR [95% CI] = 2.5 [1.0, 6.0], p = 0.05 in Model 2). Compared to non-consumers of fructose beverages, both older and younger ‘daily fructose consumers’ were more likely to have higher stages of liver fibrosis; adjusted cumulative OR and 95% confidence intervals in Model 2 were 3.2 [1.7, 6.1], p = 0.0003 for the younger groups and 3.2 [1.4,7.4], p = 0.006 for the older groups.
Table 4.
Association between fructose consumption and liver histology of NAFLD in different age groups
| Younger group (< 48 years old) | Older group (> = 48 years old) | |||||||
|---|---|---|---|---|---|---|---|---|
| Adjusted (Model 1) | Adjusted (Model 2) | Adjusted (Model 1) | Adjusted (Model 2) | |||||
| OR [95% CI] | p-value | OR [95% CI] | p-value | OR [95% CI] | p-value | OR [95% CI] | p-value | |
| Steatosis | ||||||||
| Fructose consumption | ||||||||
| < 7 servings | - | - | - | - | - | - | - | - |
| > = 7 servings | 1.1 [0.6, 2.0] | 0.72 | 1.0 [0.6, 1.9] | 0.95 | 0.3 [0.1, 0.6] | 0.0009 | 0.2 [0.1, 0.5] | 0.0008 |
| Lobular inflammation | ||||||||
| Fructose consumption | ||||||||
| < 7 servings | - | - | - | - | - | - | - | - |
| > = 7 servings | 0.7 [0.4, 1.3] | 0.24 | 0.9 [0.5, 1.8] | 0.83 | 2.1 [1.0, 4.8] | 0.07 | 2.5 [1.0, 6.2] | 0.05 |
| Ballooning | ||||||||
| Fructose consumption | ||||||||
| < 7 servings | - | - | - | - | - | - | - | - |
| > = 7 servings | 1.3 [0.7, 2.3] | 0.40 | 1.5 [0.8, 2.8] | 0.19 | 2.1 [0.9, 4.5] | 0.07 | 2.5 [1.0, 6.0] | 0.05 |
| Fibrosis | ||||||||
| Fructose consumption | ||||||||
| < 7 servings | - | - | - | - | - | - | - | - |
| > = 7 servings | 2.5 [1.4, 4.4] | 0.003 | 3.2 [1.7, 6.1] | 0.0003 | 2.1 [0.1, 4.3] | 0.05 | 3.2 [1.4, 7.4] | 0.006 |
Fructose consumption is expresses as reported servings per week. OR (cumulative odds ratio) and p-values were derived from ordinal logistic regression models (Model 1: adjusted for age, gender, BMI, Hispanic ethnicity, and total calorie intake; Model 2: adjusted for age, gender, BMI, Hispanic ethnicity, total calorie intake, triglycerides, HDL-cholesterol, LDL-cholesterol, uric acid, and HOMA-IR.
DISCUSSION
Recent data suggest that intake of more simple carbohydrates and less saturated fat is higher in patients with NAFLD compared with the general population, suggesting that dietary imbalances play a role in the development and progression of NAFLD (25). The ideal diet for NAFLD should reduce fat mass and inflammation in the adipose tissue, restore insulin sensitivity, and provide low amounts of substrates for de-novo lipogenesis (26), but scientific evidence to recommend specific diets is currently lacking. Although prior studies suggest an association between increased fructose consumption with NAFLD, no study to date has implicated a dietary risk factor in NAFLD progression. Defining modifiable risk factor(s) for liver disease progression in NAFLD would have significant public health implications for the development of strategies which may decrease risk for liver fibrosis and associated health-related complications. Evidence that childhood obesity and pediatric NALFD are becoming epidemic, particularly in young boys who tend to consume soft drinks (27, 28), suggests that there is a significant opportunity to improve risk factors for progressive liver damage at early stages of life.
In this study we investigated the impact of increased fructose consumption on the metabolic syndrome and histologic features of NAFLD. In patients with established NAFLD, increased consumption of fructose was associated with younger age, male gender, increased BMI, increased serum triglycerides, lower HDL cholesterol, and higher uric acid levels. To our surprise, increased fructose consumption appeared to improve systemic insulin sensitivity (i.e. lowered fasting serum glucose, slight decrease in serum insulin and HOMA-IR). Although this observation was diminished when excluding all subjects requiring insulin or insulin-sensitizing agents, this finding is particularly notable as it was observed despite evidence that daily fructose ingestion was accompanied by a significant increase in daily consumption of total calories, carbohydrates, proteins, and fats, as well as increased BMI. Further, based on our extended analysis, such associations still appeared to exist among subjects who were on insulin or insulin sensitizing agents (data are not shown). The limited sample size in the subgroup and the cross-sectional nature of this analysis limits the ability to draw any conclusions regarding causality and/or the impact of increased fructose consumption on the natural history of NAFLD. Further studies are required to delineate potential differential influences of fructose consumption on insulin sensitivity. Also, from the time of diagnosis of NAFLD to the time of study participation, patients may have spontaneously initiated life-style modification (ie. decreased sugar consumption, dietary modification, and/or increased exercise) which led to improved insulin sensitivity. Although, we attempted to decrease the window between liver biopsy and study participation to only 3 months, even a modest dietary change or weight loss could improve insulin sensitivity. Although a dose response relationship between fructose and low HDL cholesterol was observed, the apparent lack of a dose-response relationship between fructose intake and insulin resistance may potentially be explained by other confounders (ie. use of insulin sensitizing agents or lipid lowering agents) which may alter peripheral and/or hepatic insulin sensitivity and decrease hepatic steatosis.
Despite our inability to link increased fructose consumption to worsened insulin resistance, daily fructose consumption was associated with metabolic abnormalities that typically accompany insulin resistance, including lower HDL-cholesterol and higher serum uric acid, even after adjusting for age, gender, and BMI. In this regard, our findings reproduce other reports that have linked such metabolic derangements with increased consumption of fructose (4, 5, 29–34). Moreover, after controlling for factors that have been shown to influence NAFLD (e.g., age, gender, BMI, Hispanic ethnicity, and total calorie intake), we found that increased fructose consumption was associated with decreased hepatic steatosis and increased fibrosis. When lipid parameters (triglycerides, HDL- and LDL cholesterol), uric acid, and HOMA-IR were incorporated into the analytical model, the association of increased fructose intake with decreased steatosis and increased fibrosis persisted. In addition, older subjects (age > 48 years old) with NAFLD who consumed increased amounts of fructose (> 7 servings/week) had increased lobular inflammation and ballooned hepatocytes. Other studies have also identified older age as an independent predictor of NAFLD severity (35). Together with those data, our results raise the possibility that habitual ingestion of fructose exacerbates liver injury and promotes fibrosis progression in NAFLD. However, the research tools utilized to collect dietary fructose consumption do not allow us to ascertain whether or not some other dietary constituent for which fructose is simply a “marker” accounts for our findings.
The concept that excessive consumption of fructose might promote progression of NAFLD is biologically plausible given experimental evidence that high fructose corn syrup-55 (HFCS-55) increases ER stress, promotes activation of the stress-related kinase, Jun N-terminal Kinase (JNK), induces mitochondrial dysfunction, and increases apoptotic activity (36–40) in liver cells. Further, a link between dietary fructose intake, gut-derived endotoxemia, toll-like receptor 4 and NAFLD has been suggested by the results of human and animal studies (17, 41). Mice fed water enriched with 30% fructose develop hepatic triglyceride accumulation, altered markers of insulin resistance, portal endotoxemia, and increased hepatic lipid peroxidation, MyD88, and TNF-alpha levels. Such data suggest that fructose-induced NAFLD or NASH associated with intestinal bacterial overgrowth and increased intestinal permeability, subsequently leading to an endotoxin-dependent activation of hepatic Kupffer cells (41). As discussed subsequently, habitual fructose consumption may also lead to an unfavorable energy balance in the liver which enhances the susceptibility of hepatocytes to injury (42).
The lipogenic and proinflammatory effects of fructose appear to be due to its unique metabolism, which involves a period of transient ATP depletion due to its rapid phosphorylation within the cell and from its unique ability among sugars to raise intracellular and serum uric acid. In experimental animals, lowering uric acid concentrations ameliorated features of the metabolic syndrome induced by fructose, including weight gain, hypertriglyceridemia, hyperinsulinemia and insulin resistance, and hypertension (34). These findings were surprising, because most authorities had considered uric acid to be either biologically inert or an important antioxidant in the plasma (43). However, uric acid was found to have numerous deleterious biologic functions. Uric acid stimulates both vascular smooth muscle cell proliferation and the release of chemotactic and inflammatory substances, induces monocyte chemotaxis, inhibits endothelial cell proliferation and migration and causes oxidative stress in adipocytes, which results in the impaired secretion of adiponectin (1, 44–48). Fructose-related reductions in hepatic ATP may also help to explain why we observed a relationship between chronic ingestion of fructose, hyperuricemia, and NAFLD severity in our patients. However, after adjusting for total calorie intake and other metabolic features, the association between increased fructose consumption and liver injury persisted suggesting that an alternative mechanism other than hyperuricemia may be involved.
During hepatic fructose metabolism, two molecules of ATP are consumed per each fructose molecule that is metabolized. The resultant ADP is then further degraded to AMP. The fate of this AMP, in turn, is dictated by the relative activities of two competing enzymes, AMP kinase (AMPK) and xanthine dehydrogenase. When AMPK is more active than xanthine dehydrogenase, AMP is “re-cycled” to restore hepatocyte ATP content. Conversely, when xanthine dehydrogenase is more active than AMPK, AMP is converted to uric acid, delaying recovery of hepatic ATP stores [Figure 1]. Intravenous administration of fructose to healthy subjects increases blood levels of uric acid, the urinary excretion of urate and xanthine, and acutely reduces hepatic ATP (49, 50). Further, obese patients with NASH were less efficient than healthy controls at recovering from fructose-induced depletion of hepatic ATP stores (51). Exercise, metformin, thiazolidinediones, and adiponectin (12, 52–54), all of which have been shown to improve NASH, activate AMPK. Together, these data support the concept that hepatic AMPK activity is relatively inhibited in NASH, rendering hepatocytes more vulnerable to ATP depletion when ATP is consumed during fructose metabolism. Hence, the presence of hyperuricemia may be a surrogate measure of chronic hepatic ATP depletion in habitual fructose consumers (55). In addition, hyperuricemia has long been recognized as a marker of advanced liver disease (49, 56). More recently, multivariate analysis demonstrated that hyperuricemia is also an independent risk factor for NASH (57). Thus, studies in animals and humans suggest a mechanism by which habitual fructose consumption promotes progression of liver damage by exacerbating underlying abnormalities in hepatic energy homeostasis. Impaired hepatic energy homeostasis (i.e., ATP depletion) may also explain the observed associations of increased fructose consumption with decreased steatosis and increased hepatic inflammation; inability to supply ATP for the triglyceride synthesis may fail to transform toxic free fatty acids to a safer form of lipids (i.e., triglycerides), constrain accumulated free fatty acids in the liver and exacerbate lipotoxicity.
Figure 1.
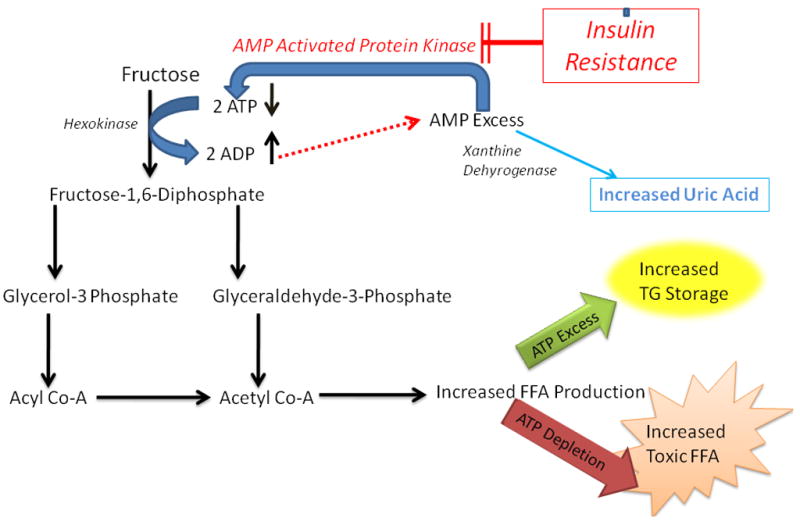
Fructose Associated Hepatic ATP Depletion
For each fructose molecule that is metabolized, two molecules of ATP are consumed.. The resultant ADP is then further degraded to AMP. The fate of this AMP is dictated by the relative activities of two competing enzymes, AMP kinase (AMPK) and xanthine dehydrogenase. When AMPK is more active than xanthine dehydrogenase, AMP is “re-cycled” to restore hepatocyte ATP content. Conversely, when xanthine dehydrogenase is more active than AMPK, AMP is converted to uric acid, delaying recovery of hepatic ATP stores. Insulin resistance, which decreases AMPK activity, further augments the effect of fructose metabolism, resulting in hepatic ATP depletion.
Although further research is necessary to confirm these results and evaluate this hypothesis directly, data from the current cross-sectional analysis are exciting because they not only lend credence to this concept, but suggest both a novel biomarker (serum uric acid) and a modifiable risk factor (dietary fructose) for liver fibrosis in patients with NAFLD. Given the latter, well-designed prospective controlled dietary intervention studies are necessary to evaluate whether a low-fructose diet improves the metabolic disturbances associated with NAFLD, but also alters the natural history of NAFLD in those at risk of disease progression.
Members of the Nonalcoholic Steatohepatitis Clinical Research Network
Clinical Centers
Baylor College of Medicine, Houston, TX: Stephanie Abrams, MD; Diana Arceo, MD, MS; Denise Espinosa; Leanel Angeli Fairly, RN
Case Western Reserve University Clinical Centers:
MetroHealth Medical Center, Cleveland, OH: Carol Hawkins, RN; Yao-Chang Liu, MD; Margaret Stager, MD
Cleveland Clinic Foundation, Cleveland, OH: Arthur McCullough, MD; Srinivasan Dasarathy, MD; Ruth Sargent, LPN
Seattle Children’s Hospital & Research Institute, WA: Melissa Coffey; Karen Murray, MD; Melissa Young
Children’s National Medical Center, Washington DC: Parvathi Mohan, MD; Kavita Nair
Duke University Medical Center, Durham, NC: Manal F. Abdelmalek, MD; Anna Mae Diehl, MD; Marcia Gottfried, MD (2004–2008); Cynthia Guy, MD; Paul Killenberg, MD (2004–2008); Samantha Kwan; Yi-Ping Pan; Dawn Piercy, FNP; Melissa Smith
Indiana University School of Medicine, Indianapolis, IN: Prajakta Bhimalli; Naga Chalasani, MD; Oscar W. Cummings, MD; Lydia Lee, Linda Ragozzino, Raj Vuppalanchi, MD
Riley Hospital for Children, Indianapolis, IN: Elizabeth Byam; Ann Klipsch, RN; Jean Molleston, MD; Girish Subbarao, MD
Johns Hopkins Hospital, Baltimore, MD: Kimberly Pfeifer; Ann Scheimann, MD; Michael Torbenson, MD
St Louis University, St Louis, MO: Sarah Barlow, MD (2002–2007); Jose Derdoy, MD (2007-); Joyce Hoffmann; Debra King, RN; Andrea Morris; Joan Siegner, RN; Susan Stewart, RN; Brent A. Tetri, MD; Judy Thompson, RN
University of California San Diego, San Diego, CA: Cynthia Behling, MD, PhD; Lisa Clark, PhD, MPH; Janis Durelle; Tarek Hassanein, MD; Joel E. Lavine, MD, PhD; Susana Mendoza; Jeffrey B. Schwimmer, MD; Claude Sirlin, MD; Tanya Stein, MD; Zobeida Palomares
University of California San Francisco, San Francisco, CA: Bradley Aouizerat, PhD; Kiran Bambha, MD; Nathan M. Bass, MD, PhD; Linda D. Ferrell, MD; Danuta Filipowski, MD; Raphael Merriman, MD (2002–2007); Mark Pabst; Monique Rosenthal; Philip Rosenthal, MD; Tessa Steel (2006–2008)
University of Washington Medical Center, Seattle, WA: Matthew Yeh, MD, PhD
Virginia Commonwealth University, Richmond, VA: Sherry Boyett, RN; Melissa J. Contos, MD; Michael Fuchs, MD; Amy Jones; Velimir AC Luketic, MD; Bimalijit Sandhu, MD; Arun J. Sanyal, MD; Carol Sargeant, RN, MPH; Kimberly Selph; Melanie White, RN
Virginia Mason Medical Center1, Seattle, WA: Kris V. Kowdley, MD; Jody Mooney, MS; James Nelson, PhD; Sarah Ackermann; Cheryl Saunders, MPH; Vy Trinh; Chia Wang, MD
Washington University, St. Louis, MO: Elizabeth M. Brunt, MD
Resource Centers
National Cancer Institute, Bethesda, MD: David Kleiner, MD, PhD
National Institute of Child Health and Human Development, Bethesda, MD: Gilman D. Grave, MD; Terry TK Huang, PhD, MPH
National Institute of Diabetes, Digestive and Kidney Diseases, Bethesda, MD: Edward Doo, MD; James Everhart, MD, MPH; Jay Hoofnagle, MD; Patricia R. Robuck, PhD, MPH (Project Scientist); Leonard Seeff, MD
Johns Hopkins University, Bloomberg School of Public Health (Data Coordinating Center), Baltimore, MD: Patricia Belt, BS; Frederick L. Brancati, MD, MHS; Jeanne M. Clark, MD, MPH; Ryan Colvin, MPH; Michele Donithan, MHS; Mika Green, MA; Rosemary Hollick (2003–2005); Milana Isaacson; Wana Kim; Alison Lydecker, MPH (2006–2008), Pamela Mann, MPH; Laura Miriel; Alice Sternberg, ScM; James Tonascia, PhD; Aynur Ünalp-Arida, MD, PhD; Mark Van Natta, MHS; Laura Wilson, ScM; Katherine Yates, ScM
Footnotes
original grant with University of Washington
References
- 1.Collison KS, Saleh SM, Bakheet RH, Al-Rabiah RK, Inglis AL, Makhoul NJ, Maqbool ZM, et al. Diabetes of the Liver: The Link Between Nonalcoholic Fatty Liver Disease and HFCS-55. Obesity (Silver Spring) 2009 doi: 10.1038/oby.2009.58. [DOI] [PubMed] [Google Scholar]
- 2.Clark JM, Brancati FL, Diehl AM. The prevalence and etiology of elevated aminotransferase levels in the United States. Am J Gastroenterol. 2003;98:960–967. doi: 10.1111/j.1572-0241.2003.07486.x. [DOI] [PubMed] [Google Scholar]
- 3.Lazo M, Clark JM. The epidemiology of nonalcoholic fatty liver disease: a global perspective. Semin Liver Dis. 2008;28:339–350. doi: 10.1055/s-0028-1091978. [DOI] [PubMed] [Google Scholar]
- 4.Elliott SS, Keim NL, Stern JS, Teff K, Havel PJ. Fructose, weight gain, and the insulin resistance syndrome. Am J Clin Nutr. 2002;76:911–922. doi: 10.1093/ajcn/76.5.911. [DOI] [PubMed] [Google Scholar]
- 5.Bray GA, Nielsen SJ, Popkin BM. Consumption of high-fructose corn syrup in beverages may play a role in the epidemic of obesity. Am J Clin Nutr. 2004;79:537–543. doi: 10.1093/ajcn/79.4.537. [DOI] [PubMed] [Google Scholar]
- 6.Harrington S. The role of sugar-sweetened beverage consumption in adolescent obesity: a review of the literature. J Sch Nurs. 2008;24:3–12. doi: 10.1177/10598405080240010201. [DOI] [PubMed] [Google Scholar]
- 7.Vos MBKJ, Gillespie C, Welsh J, Blanck HM. Dietary fructose consumption among US children and adults: the Third National Health and Nutrition Examination Survey. Medscape J Med. 2008;10:160. [PMC free article] [PubMed] [Google Scholar]
- 8.Shapiro A, Mu W, Roncal C, Cheng KY, Johnson RJ, Scarpace PJ. Fructose-induced leptin resistance exacerbates weight gain in response to subsequent high-fat feeding. Am J Physiol Regul Integr Comp Physiol. 2008;295:R1370–1375. doi: 10.1152/ajpregu.00195.2008. [DOI] [PMC free article] [PubMed] [Google Scholar]
- 9.Cirillo P, Sautin YY, Kanellis J, Kang DH, Gesualdo L, Nakagawa T, Johnson RJ. Systemic inflammation, metabolic syndrome and progressive renal disease. Nephrol Dial Transplant. 2009;24:1384–1387. doi: 10.1093/ndt/gfp038. [DOI] [PMC free article] [PubMed] [Google Scholar]
- 10.Glushakova O, Kosugi T, Roncal C, Mu W, Heinig M, Cirillo P, Sanchez-Lozada LG, et al. Fructose induces the inflammatory molecule ICAM-1 in endothelial cells. J Am Soc Nephrol. 2008;19:1712–1720. doi: 10.1681/ASN.2007121304. [DOI] [PMC free article] [PubMed] [Google Scholar]
- 11.Light HR, Tsanzi E, Gigliotti J, Morgan K, Tou JC. The type of caloric sweetener added to water influences weight gain, fat mass, and reproduction in growing Sprague-Dawley female rats. Exp Biol Med (Maywood) 2009;234:651–661. doi: 10.3181/0812-RM-368. [DOI] [PubMed] [Google Scholar]
- 12.Cirillo P, Gersch MS, Mu W, Scherer PM, Kim KM, Gesualdo L, Henderson GN, et al. Ketohexokinase-dependent metabolism of fructose induces proinflammatory mediators in proximal tubular cells. J Am Soc Nephrol. 2009;20:545–553. doi: 10.1681/ASN.2008060576. [DOI] [PMC free article] [PubMed] [Google Scholar]
- 13.Calafell R, Boada J, Santidrian AF, Gil J, Roig T, Perales JC, Bermudez J. Fructose 1,6-bisphosphate reduced TNF-alpha-induced apoptosis in galactosamine sensitized rat hepatocytes through activation of nitric oxide and cGMP production. Eur J Pharmacol. 2009;610:128–133. doi: 10.1016/j.ejphar.2009.03.044. [DOI] [PubMed] [Google Scholar]
- 14.Stanhope KL, Havel PJ. Fructose Consumption: Considerations for future research on its effects on adipose distribution, lipid metabolism, and insulin sensitivity in humans. J Nutr. 2009 doi: 10.3945/jn.109.106641. [DOI] [PMC free article] [PubMed] [Google Scholar]
- 15.Faeh D, Minehira K, Schwarz JM, Periasamy R, Park S, Tappy L. Effect of fructose overfeeding and fish oil administration on hepatic de novo lipogenesis and insulin sensitivity in healthy men. Diabetes. 2005;54:1907–1913. doi: 10.2337/diabetes.54.7.1907. [DOI] [PubMed] [Google Scholar]
- 16.Ouyang X, Cirillo P, Sautin Y, McCall S, Bruchette JL, Diehl AM, Johnson RJ, et al. Fructose consumption as a risk factor for non-alcoholic fatty liver disease. J Hepatol. 2008;48:993–999. doi: 10.1016/j.jhep.2008.02.011. [DOI] [PMC free article] [PubMed] [Google Scholar]
- 17.Thuy S, Ladurner R, Volynets V, Wagner S, Strahl S, Konigsrainer A, Maier KP, et al. Nonalcoholic fatty liver disease in humans is associated with increased plasma endotoxin and plasminogen activator inhibitor 1 concentrations and with fructose intake. J Nutr. 2008;138:1452–1455. doi: 10.1093/jn/138.8.1452. [DOI] [PubMed] [Google Scholar]
- 18.Nonalcoholic steatohepatitis clinical research network. Hepatology. 2003;37:244. doi: 10.1002/hep.510370203. [DOI] [PubMed] [Google Scholar]
- 19.Chalasani NP, Sanyal AJ, Kowdley KV, Robuck PR, Hoofnagle J, Kleiner DE, Unalp A, et al. Pioglitazone versus vitamin E versus placebo for the treatment of non-diabetic patients with non-alcoholic steatohepatitis: PIVENS trial design. Contemp Clin Trials. 2009;30:88–96. doi: 10.1016/j.cct.2008.09.003. [DOI] [PMC free article] [PubMed] [Google Scholar]
- 20.Block G, Subar AF. Estimates of nutrient intake from a food frequency questionnaire: the 1987 National Health Interview Survey. J Am Diet Assoc. 1992;92:969–977. [PubMed] [Google Scholar]
- 21.Kleiner DE, Brunt EM, Van Natta M, Behling C, Contos MJ, Cummings OW, Ferrell LD, et al. Design and validation of a histological scoring system for nonalcoholic fatty liver disease. Hepatology. 2005;41:1313–1321. doi: 10.1002/hep.20701. [DOI] [PubMed] [Google Scholar]
- 22.Vos MB, Kimmons JE, Gillespie C, Welsh J, Blanck HM. Dietary fructose consumption among US children and adults: the Third National Health and Nutrition Examination Survey. Medscape J Med. 2008;10:160. [PMC free article] [PubMed] [Google Scholar]
- 23.Caldwell SH, Chang CY, Nakamoto RK, Krugner-Higby L. Mitochondria in nonalcoholic fatty liver disease. Clin Liver Dis. 2004;8:595–617. x. doi: 10.1016/j.cld.2004.04.009. [DOI] [PubMed] [Google Scholar]
- 24.Serste T, Bourgeois N. Ageing and the liver. Acta Gastroenterol Belg. 2006;69:296–298. [PubMed] [Google Scholar]
- 25.Toshimitsu K, Matsuura B, Ohkubo I, Niiya T, Furukawa S, Hiasa Y, Kawamura M, et al. Dietary habits and nutrient intake in non-alcoholic steatohepatitis. Nutrition. 2007;23:46–52. doi: 10.1016/j.nut.2006.09.004. [DOI] [PubMed] [Google Scholar]
- 26.Leclercq IA, Horsmans Y. Nonalcoholic fatty liver disease: the potential role of nutritional management. Curr Opin Clin Nutr Metab Care. 2008;11:766–773. doi: 10.1097/MCO.0b013e328312c353. [DOI] [PubMed] [Google Scholar]
- 27.Schwimmer JB, Deutsch R, Rauch JB, Behling C, Newbury R, Lavine JE. Obesity, insulin resistance, and other clinicopathological correlates of pediatric nonalcoholic fatty liver disease. J Pediatr. 2003;143:500–505. doi: 10.1067/S0022-3476(03)00325-1. [DOI] [PubMed] [Google Scholar]
- 28.Forshee RA, Storey ML. Total beverage consumption and beverage choices among children and adolescents. Int J Food Sci Nutr. 2003;54:297–307. doi: 10.1080/09637480120092143. [DOI] [PubMed] [Google Scholar]
- 29.Basciano H, Federico L, Adeli K. Fructose, insulin resistance, and metabolic dyslipidemia. Nutr Metab (Lond) 2005;2:5. doi: 10.1186/1743-7075-2-5. [DOI] [PMC free article] [PubMed] [Google Scholar]
- 30.Blundell JE, King NA. Overconsumption as a cause of weight gain: behavioural-physiological interactions in the control of food intake (appetite) Ciba Found Symp. 1996;201:138–154. doi: 10.1002/9780470514962.ch9. discussion 154–138, 188–193. [DOI] [PubMed] [Google Scholar]
- 31.Cirillo P, Sato W, Reungjui S, Heinig M, Gersch M, Sautin Y, Nakagawa T, et al. Uric acid, the metabolic syndrome, and renal disease. J Am Soc Nephrol. 2006;17:S165–168. doi: 10.1681/ASN.2006080909. [DOI] [PubMed] [Google Scholar]
- 32.Couchepin C, Le KA, Bortolotti M, da Encarnacao JA, Oboni JB, Tran C, Schneiter P, et al. Markedly blunted metabolic effects of fructose in healthy young female subjects compared with male subjects. Diabetes Care. 2008;31:1254–1256. doi: 10.2337/dc07-2001. [DOI] [PubMed] [Google Scholar]
- 33.Johnson RJ, Segal MS, Sautin Y, Nakagawa T, Feig DI, Kang DH, Gersch MS, et al. Potential role of sugar (fructose) in the epidemic of hypertension, obesity and the metabolic syndrome, diabetes, kidney disease, and cardiovascular disease. Am J Clin Nutr. 2007;86:899–906. doi: 10.1093/ajcn/86.4.899. [DOI] [PubMed] [Google Scholar]
- 34.Nakagawa T, Hu H, Zharikov S, Tuttle KR, Short RA, Glushakova O, Ouyang X, et al. A causal role for uric acid in fructose-induced metabolic syndrome. Am J Physiol Renal Physiol. 2006;290:F625–631. doi: 10.1152/ajprenal.00140.2005. [DOI] [PubMed] [Google Scholar]
- 35.Dixon JB, Bhathal PS, O’Brien PE. Nonalcoholic fatty liver disease: predictors of nonalcoholic steatohepatitis and liver fibrosis in the severely obese. Gastroenterology. 2001;121:91–100. doi: 10.1053/gast.2001.25540. [DOI] [PubMed] [Google Scholar]
- 36.Yang S, Zhu H, Li Y, Lin H, Gabrielson K, Trush MA, Diehl AM. Mitochondrial adaptations to obesity-related oxidant stress. Arch Biochem Biophys. 2000;378:259–268. doi: 10.1006/abbi.2000.1829. [DOI] [PubMed] [Google Scholar]
- 37.Rashid A, Wu TC, Huang CC, Chen CH, Lin HZ, Yang SQ, Lee FY, et al. Mitochondrial proteins that regulate apoptosis and necrosis are induced in mouse fatty liver. Hepatology. 1999;29:1131–1138. doi: 10.1002/hep.510290428. [DOI] [PubMed] [Google Scholar]
- 38.Aguirre V, Uchida T, Yenush L, Davis R, White MF. The c-Jun NH(2)-terminal kinase promotes insulin resistance during association with insulin receptor substrate-1 and phosphorylation of Ser(307) J Biol Chem. 2000;275:9047–9054. doi: 10.1074/jbc.275.12.9047. [DOI] [PubMed] [Google Scholar]
- 39.Mantena SK, Vaughn DP, Andringa KK, Eccleston HB, King AL, Abrams GA, Doeller JE, et al. High fat diet induces dysregulation of hepatic oxygen gradients and mitochondrial function in vivo. Biochem J. 2009;417:183–193. doi: 10.1042/BJ20080868. [DOI] [PMC free article] [PubMed] [Google Scholar]
- 40.McClain CJ, Song Z, Barve SS, Hill DB, Deaciuc I. Recent advances in alcoholic liver disease. IV. Dysregulated cytokine metabolism in alcoholic liver disease. Am J Physiol Gastrointest Liver Physiol. 2004;287:G497–502. doi: 10.1152/ajpgi.00171.2004. [DOI] [PubMed] [Google Scholar]
- 41.Spruss A, Kanuri G, Wagnerberger S, Haub S, Bischoff SC, Bergheim I. Toll-like receptor 4 is involved in the development of fructose-induced hepatic steatosis in mice. Hepatology. 2009;50:1094–1104. doi: 10.1002/hep.23122. [DOI] [PubMed] [Google Scholar]
- 42.Chavin KD, Yang S, Lin HZ, Chatham J, Chacko VP, Hoek JB, Walajtys-Rode E, et al. Obesity induces expression of uncoupling protein-2 in hepatocytes and promotes liver ATP depletion. J Biol Chem. 1999;274:5692–5700. doi: 10.1074/jbc.274.9.5692. [DOI] [PubMed] [Google Scholar]
- 43.Ames BN, Cathcart R, Schwiers E, Hochstein P. Uric acid provides an antioxidant defense in humans against oxidant- and radical-caused aging and cancer: a hypothesis. Proc Natl Acad Sci U S A. 1981;78:6858–6862. doi: 10.1073/pnas.78.11.6858. [DOI] [PMC free article] [PubMed] [Google Scholar]
- 44.Mazzali M, Kanellis J, Han L, Feng L, Xia YY, Chen Q, Kang DH, et al. Hyperuricemia induces a primary renal arteriolopathy in rats by a blood pressure-independent mechanism. Am J Physiol Renal Physiol. 2002;282:F991–997. doi: 10.1152/ajprenal.00283.2001. [DOI] [PubMed] [Google Scholar]
- 45.Rao GN, Corson MA, Berk BC. Uric acid stimulates vascular smooth muscle cell proliferation by increasing platelet-derived growth factor A-chain expression. J Biol Chem. 1991;266:8604–8608. [PubMed] [Google Scholar]
- 46.Gersch MS, Mu W, Cirillo P, Reungjui S, Zhang L, Roncal C, Sautin YY, et al. Fructose, but not dextrose, accelerates the progression of chronic kidney disease. Am J Physiol Renal Physiol. 2007;293:F1256–1261. doi: 10.1152/ajprenal.00181.2007. [DOI] [PubMed] [Google Scholar]
- 47.Kang DH, Park SK, Lee IK, Johnson RJ. Uric acid-induced C-reactive protein expression: implication on cell proliferation and nitric oxide production of human vascular cells. J Am Soc Nephrol. 2005;16:3553–3562. doi: 10.1681/ASN.2005050572. [DOI] [PubMed] [Google Scholar]
- 48.Khosla UM, Zharikov S, Finch JL, Nakagawa T, Roncal C, Mu W, Krotova K, et al. Hyperuricemia induces endothelial dysfunction. Kidney Int. 2005;67:1739–1742. doi: 10.1111/j.1523-1755.2005.00273.x. [DOI] [PubMed] [Google Scholar]
- 49.Budillon G, Citarella C, Loguercio C, Nardone G, Sicolo P, Del Vecchio Blanco C. Hyperuricemia induced by fructose load in liver cirrhosis. Ital J Gastroenterol. 1992;24:373–377. [PubMed] [Google Scholar]
- 50.Cortez-Pinto H, Chatham J, Chacko VP, Arnold C, Rashid A, Diehl AM. Alterations in liver ATP homeostasis in human nonalcoholic steatohepatitis: a pilot study. Jama. 1999;282:1659–1664. doi: 10.1001/jama.282.17.1659. [DOI] [PubMed] [Google Scholar]
- 51.Nair S, VPC, Arnold C, Diehl AM. Hepatic ATP reserve and efficiency of replenishing: comparison between obese and nonobese normal individuals. Am J Gastroenterol. 2003;98:466–470. doi: 10.1111/j.1572-0241.2003.07221.x. [DOI] [PubMed] [Google Scholar]
- 52.Winder WW, Hardie DG. AMP-activated protein kinase, a metabolic master switch: possible roles in type 2 diabetes. Am J Physiol. 1999;277:E1–10. doi: 10.1152/ajpendo.1999.277.1.E1. [DOI] [PubMed] [Google Scholar]
- 53.Davis BJ, Xie Z, Viollet B, Zou MH. Activation of the AMP-activated kinase by antidiabetes drug metformin stimulates nitric oxide synthesis in vivo by promoting the association of heat shock protein 90 and endothelial nitric oxide synthase. Diabetes. 2006;55:496–505. doi: 10.2337/diabetes.55.02.06.db05-1064. [DOI] [PubMed] [Google Scholar]
- 54.Dzamko NL, Steinberg GR. AMPK-dependent hormonal regulation of whole-body energy metabolism. Acta Physiol (Oxf) 2009;196:115–127. doi: 10.1111/j.1748-1716.2009.01969.x. [DOI] [PubMed] [Google Scholar]
- 55.Hultman E, Nilsson LH, Sahlin K. Adenine nucleotide content of human liver. Normal values and fructose-induced depletion. Scand J Clin Lab Invest. 1975;35:245–251. doi: 10.1080/00365517509095736. [DOI] [PubMed] [Google Scholar]
- 56.George J, Chandrakasan G. Biochemical abnormalities during the progression of hepatic fibrosis induced by dimethylnitrosamine. Clin Biochem. 2000;33:563–570. doi: 10.1016/s0009-9120(00)00170-3. [DOI] [PubMed] [Google Scholar]
- 57.Fargion S, Mattioli M, Fracanzani AL, Sampietro M, Tavazzi D, Fociani P, Taioli E, et al. Hyperferritinemia, iron overload, and multiple metabolic alterations identify patients at risk for nonalcoholic steatohepatitis. Am J Gastroenterol. 2001;96:2448–2455. doi: 10.1111/j.1572-0241.2001.04052.x. [DOI] [PubMed] [Google Scholar]