Abstract
Crystallization is one of the most fundamental nonequilibrium phenomena universal to a variety of materials. It has so far been assumed that a supercooled liquid is in a “homogeneous disordered state” before crystallization. Contrary to this common belief, we reveal that a supercooled colloidal liquid is actually not homogeneous, but has transient medium-range structural order. We find that nucleation preferentially takes place in regions of high structural order via wetting effects, which reduce the crystal–liquid interfacial energy significantly and thus promotes crystal nucleation. This novel scenario provides a clue to solving a long-standing mystery concerning a large discrepancy between the rigorous numerical estimation of the nucleation rate on the basis of the classical nucleation theory and the experimentally observed ones. Our finding may shed light not only on the mechanism of crystal nucleation, but also on the fundamental nature of a supercooled liquid state.
Keywords: bond orientational order, glass transition, hard-sphere liquid, metastable liquid
Crystallization is a process in which an ordered phase emerges from a disordered state. It is important not only as a fundamental problem of nonequilibrium statistical physics, but also as that of materials science. The initial state is a disordered liquid and the final state is a stable crystal. The classical nucleation theory (1–3) considers these initial homogeneous disordered liquid and final ordered crystal phases as the only key players of nucleation. In this theory, thus, crystal nucleation is controlled by the competition between the free-energy gain due to the liquid–crystal transformation and the free-energy loss associated with the formation of the liquid–crystal interface. The total free-energy cost to form a spherical crystallite with radius R is
 |
where ns is the number density of particles in the solid, δμ is the difference between the liquid and solid chemical potentials, and γ is the liquid–solid interfacial tension. This ΔG goes through a maximum at Rc = 2γ/(nsδμ) (critical nucleus size) and the height of the free-energy barrier is given by
 |
Then, the crystal nucleation frequency I per unit volume is obtained as
 |
where k is a constant, kB is Boltzmann’s constant, and T is the temperature. Here the kinetic factor governing I is τt, which is the characteristic time of material transport controlling crystallization. We note that it is determined not by the viscosity but by the translational diffusion (see, e.g., ref. 4).
The essential physics of nucleation and growth of crystals can be understood in the framework of the above classical nucleation theory (1–3). This theory was adapted by Russell (5) to hard-sphere colloidal crystals and was extended by Ackerson and Schätzel (6). However, there remain many fundamental open questions even now (see, e.g., refs. 7–9). Nature provides intriguing ways to help crystallization beyond the above simplified picture. An important point is that the initial and final states are not necessarily only the players. This idea goes back to the step rule of Ostwald (10), which was formulated more than a century ago. He argued that the crystal phase nucleated from a liquid is not necessarily the thermodynamically most stable one, but the one whose free energy is closest to the liquid phase. Stranski and Totomanow (11), on the other hand, argued that the phase that will be nucleated should be the one that has the lowest free-energy barrier. Later Alexander and McTague (12) argued, on the basis of the Landau theory, that the cubic term of the Landau free energy favors nucleation of a body-centered cubic (bcc) phase in the early stage of a weak first-order phase transition of a simple liquid. Since then, there have been a lot of simulation studies on this problem, but with controversy (see, e.g., refs. 13 and 14 and the references therein). Recently, ten Wolde et al. showed by numerical simulations of a Lennard–Jones system that (i) precritical nuclei are predominantly bcc, despite that the stable crystal structure is face-centered cubic (fcc), but (ii) as the nucleus grows to its critical nucleus size, the core becomes fcc ordered while its interface retains a high degree of bcc-like ordering (13, 14).
However, the story does not end here. Recently, Auer and Frenkel (15) examined the absolute crystal nucleation frequency I of a hard-core liquid, using numerical simulation. They directly estimated the free-energy barrier ΔGc instead of a brute-force approach in which we have to wait for nuclei to form spontaneously in a coarse of simulations. They defined an order parameter which acts as a “reaction coordinate” for the process of crystal nucleation. The order parameter they employed for this purpose is the bond orientational order parameter q6 (13, 14) (see Materials and Methods and Discussion). The estimated free-energy barrier is found to be considerably larger than that estimated from experiments, which leads to the crystal nucleation frequency I lower than that of experiments (16, 17) by many orders of magnitude (9, 15). This seminal paper shows us that our current understanding of crystal nucleation is still far from being complete. Recent advances in confocal microscopy have also contributed to the basic understanding of crystal nucleation (8, 18, 19), because it allows us to directly observe a nucleation process with a particle-level resolution. For example, Gasser et al. (19) showed that the crystal nucleus is not necessarily spherical, unlike what is assumed in the classical nucleation theory, and may be anisotropic (elliptic). Furthermore, they found that the value of the interfacial tension is almost four times lower than that found by simulations (15). It may be worth noting that this value is consistent with the estimate of the density functional theory (20). This difference in γ may be directly related to the above-mentioned discrepancy in I between simulations and experiments. Whether these discrepancies stem from nonideal factors of experiments [e.g., small charges on colloid surfaces (19)], from the classical nucleation theory itself, or from assumptions made in the estimate from simulations has remained elusive.
In this paper, we study this problem, using Brownian dynamics simulations of colloidal liquids (see Materials and Methods). In all previous theories of crystallization including the classical nucleation theory, it has been implicitly assumed that an initial supercooled liquid before crystallization is in a “homogeneous” disordered state. Contrary to this common belief, here we reveal that a supercooled liquid is not spatially homogeneous, but intrinsically has static structural heterogeneity, more specifically, medium-range bond orientational order, and it is this temporally fluctuating structural order that promotes crystal nucleation via wetting effects.
Results
Structure and Dynamics of a Supercooled Liquid.
First we characterize the dynamics and structure of a supercooled state of a monodisperse hard-sphere-like liquid system we investigated. Although this system is not a good glass former at all (or, easily crystallizes), it exhibits behavior characteristic of a supercooled state of a glass-forming system, which includes drastic slowing down of the dynamics and the growing correlation length upon cooling. Here a supercooled state means a stationary metastable state, which evolves from an initial random configuration of particles, but is still before crystal nucleation.
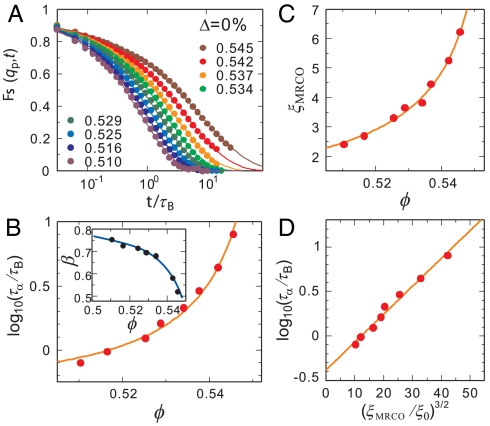
Fig. 1A indicates the ϕ dependence of the self-part of the intermediate scattering function Fs(qp,t). The wavenumber qp corresponds to the first peak of the structure factor S(q). The solid line indicates the Kohlrausch–Williams–Watts function: A exp[-(t/τα)β], which is fitted to the α relaxation in Fs(qp,t). From this fitting, we obtain the structural relaxation time τα as well as the stretching exponent β. Fig. 1B shows the ϕ dependence of the structural relaxation time τα. The solid line indicates the fitting by the Vogel–Fulcher–Tammann (VFT) relation: τα = τ0 exp[Dϕ/(ϕ0 - ϕ)], where D is the fragility index and the ϕ0 is the ideal glass transition point. We note that larger D indicates that a liquid is less fragile (i.e., stronger). The fitting yields D = 0.0743 and ϕ0 = 0.56. The inset of Fig. 1B shows the ϕ dependence of β. We see that the β decreases as ϕ increases, which indicates that dynamic heterogeneity grows with an increase in ϕ (see below). Here we note that the stability limit of the crystal is confirmed to be located between 0.498 and 0.501 for our system. This limit is very close to the hard-sphere freezing point ϕF = 0.494 (99% agreement).
Fig. 1.
Dynamics and structure of a supercooled state of a monodisperse colloidal suspension (N = 4,096). (A) The ϕ dependence of the intermediate scattering function Fs(qp,t). The solid lines are the fittings of the Kohlrausch–Williams–Watts function: A exp[-(t/τα)β]. (B) The ϕ dependence of τα. The solid line indicates the fitting by the VFT relation. The inset shows the ϕ dependence of β. The solid line is a guide to the eye. (C) The ϕ dependence of the characteristic size of clusters having high Q6, ξMRCO. The solid line is a power-law fit: ξMRCO = ξ0[ϕ/(ϕ0 - ϕ)]2/3. (D) Relationship between τα and (ξMRCO/ξ0)3/2. The solid line is the fitting by the relation τα = τ0 exp[D(ξMRCO/ξ0)3/2].
Fig. 1C indicates the ϕ dependence of the characteristic size of clusters having high bond orientational order Q6 (see Materials and Methods for the definition), ξMRCO. Here we call the structural order in a supercooled liquid “medium-range crystalline order” (MRCO). Strictly speaking, our MRCO should be called medium-range bond orientational order linked to a geometry of the equilibrium crystal; we use MRCO hereafter for simplicity. The ξMRCO is estimated from ξMRCO = (NMRCO)1/3, where NMRCO is the average number of particles belonging to a cluster (MRCO) with  . NMRCO is obtained as
  , where nc is the number of the clusters and Nj is the number of particles belonging to jth cluster. We confirm that the choice of the above threshold value (0.28) does not affect the ϕ dependence of ξ, and affects only the value of ξ0 slightly. The solid line is a power-law fit: ξMRCO = ξ0[ϕ/(ϕ0 - ϕ)]2/3. Here ϕ0 is the ideal glass transition point obtained by VFT fitting (see above), and we use ξ0 as the only adjustable parameter, whose value is determined as ξ0 = 0.512. Finally, Fig. 1D shows the relationship between τα and (ξMRCO/ξ0)3/2. The solid line indicates the relation τα = τ0 exp[D(ξMRCO/ξ0)3/2].
All these behaviors are the same as those of other glass-forming liquids we studied (21–24), indicating that even a monodisperse hard-sphere liquid exhibits typical glassy behavior under supercooling.
Process of Crystal Nucleation.
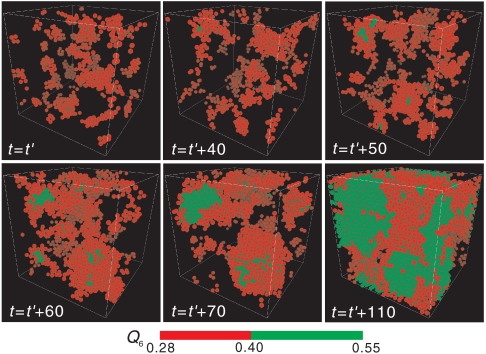
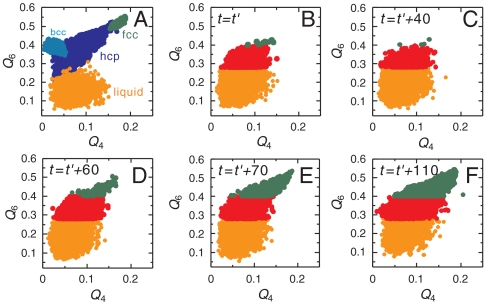
Now we show structural fluctuations and a crystal nucleation process, both of which are observed in a supercooled state of a monodisperse hard-sphere (colloidal) system, in Fig. 2 (see also SI Text). To characterize structural order, we use the correlation map of the two types of rotationally invariant bond orientational order parameters, Q6 and Q4 (see Materials and Methods and below) (25, 26) to specify the local symmetry of crystalline structures. For a 2D system, a similar analysis was made by Glaser and Clark (27); ten Wolde et al. (14) and Gasser et al.(19) also employed the combination of Q6 and Q4 distributions to analyze a 3D structure of crystal nuclei. Fig. 3 shows the transition process from medium-range crystal-like bond orientational order to a crystal, which is shown in Fig. 2, on the Q4–Q6 correlation map. From Fig. 2, we can see that bond orientational order before crystal nucleation is characterized by hcp-like symmetry, whereas crystals nucleated have a mixed character of hcp and fcc-like order. The latter suggests a random hexagonal close packing (rhcp) structure of nuclei, consistent with simulation (15) and experimental results (19). On noting that an fcc structure is the most stable crystal structure for hard spheres, which was also confirmed by microgravity experiments (28), the rhcp structure of crystal nuclei can be interpreted as a manifestation of Ostwald’s step rule (10), as suggested by Auer and Frenkel (15). By combining the information in Figs. 2 and 3, we can draw the following physical scenario. In a metastable supercooled state before the emergence of (green) crystal nuclei, we can see temporally fluctuating clusters of high hcp order, which are colored red in Fig. 2. After an incubation time, crystal nuclei with an rhcp-like structure (colored green in Fig. 2) are nucleated selectively inside regions of high hcp-like order (colored red), because the reduction of the interface energy due to wetting of a crystal nucleus to regions of high bond orientational order significantly reduces the free-energy barrier for crystal nucleation. An emerging crystal nucleus dresses a region of high hcp-like bond orientational order around it. Once nuclei are formed, structural fluctuations in a liquid are pinned by them.
Fig. 2.
Birth of a crystal nucleus from medium-range structural order (see Supporting Information) for a system of N = 16,384. The process of nucleation of a crystal at ϕ = 0.533. Particles with intermediate Q6 (0.28 ≤ Q6 ≤ 0.40) are colored red, whereas those with high Q6 (Q6≥0.4) are colored green. The time unit is the Brownian time of a particle, τB. We can see the birth of a crystal and its growth. Time t = t′ is when a supercooled liquid reaches a sort of quasi-equilibrium steady state after the initiation of simulations from a random disordered state.
Fig. 3.
Temporal change of the structure on the Q4–Q6 correlation map. (A) The distributions of Q4 and Q6 on the correlation map for fcc, hcp, and bcc crystals and liquids. Due to thermal fluctuations, even homogeneous crystals have a distribution of the order parameters. (B–D) Temporal change on the Q4–Q6 correlation map, corresponding to Fig. 2. We can see that the initial temporally fluctuating high Q6 regions (red particles in Fig. 2) have high hcp-like bond orientational order, whereas crystal nuclei (green particles in Fig. 2) have rhcp-like (a mixed character of hcp and fcc) bond orientational order.
The relevance of this scenario of wetting-induced preferential nucleation in regions of high MRCO is supported by the fact that more than 100 nucleation events observed in this study all occur selectively in high MRCO regions. This result implies the lower free-energy barrier of crystal nucleation, i.e., the lower liquid-crystal interfacial energy for higher MRCO regions, which is consistent with the experimental observation of Gasser et al. (19) that the value of the interfacial tension γ is almost four times lower than that found by simulations (15). By contrast, the result of Gasser et al. (19) is not consistent with an older density functional study (29) and computer simulations of hard spheres (15, 30), which gave results approximately four times as large. The lower interfacial tension estimated from the experiments might be due to slight charges of colloidal particles (8, 19). However, we point out here that there is another possibility that leads to larger γ in simulations (30). The estimation of γ was made for a flat interface between a large crystal and liquid (30), which extends over a length scale much longer than ξ. Thus, even if their liquid state includes MRCO, the interfacial energy for such a large crystal should be the average over low and high MRCO regions, whereas for a small crystal nucleus, the interfacial energy is exclusively between a high MRCO region and crystal in our scenario. This difference may be a possible cause of the discrepancy. However, further careful studies on the interfacial energy are highly desirable for settling this issue in a conclusive manner.
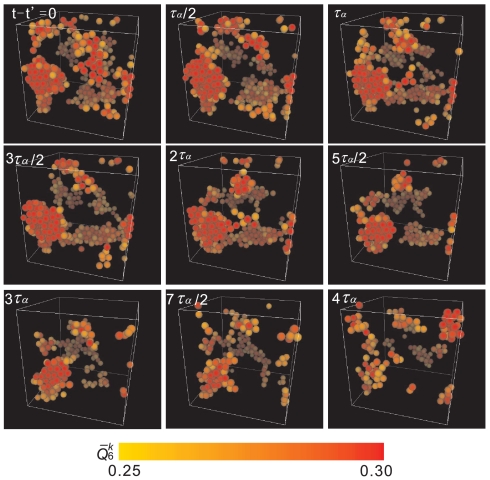
It might be thought that this temporally fluctuating order in a supercooled liquid can be interpreted as precritical nuclei whose size is smaller than the size of a critical nucleus, Rc, and does not grow. However, this interpretation is not appropriate. As described above, the correlation length of bond orientational order ξ is larger than the size of a critical nucleus Rc, which excludes a possibility that these red regions of high hcp-like order are precritical nuclei. We argue that the ordering should be regarded as spontaneous critical-like fluctuations of bond orientational order intrinsic to a supercooled state of a liquid. We stress that this transient ordering accompanies little density fluctuations, as will be shown below, which indicates the absence of positional (or, translational) ordering. Thus, this hcp-like bond orientational ordering is essentially different from the crystal nucleation, which should accompany positional ordering. This point is crucial to support our argument. This conclusion is further supported by the fact that a polydisperse system, which does not crystallize, also exhibits transient hcp-like bond orientational order with a long lifetime. For example, Fig. 4 indicates a series of snapshots of MRCO over 4τα for the polydispersity of Δ = 6%, where we can avoid crystal nucleation during our simulation time. At t = t′, there exist islands of MRCO, but at t = t′ + 4τα, some of them already disappear. This transient nature of MRCO tells us that MRCO is nothing to do with crystal nuclei which should grow with time. Unlike crystal nuclei, MRCO has a finite lifetime: a few times of τα in this case. The lifetime becomes longer with an increase in ϕ. Because there is no crystallization in a system of Δ > 6% and fluctuating order continues to exist in a stationary manner, this structural ordering can be regarded as an intrinsic structural feature of a supercooled liquid.
Fig. 4.
Snapshot of MRCO for a period of 4τα at ϕ = 0.557 and Δ = 6% (N = 4,096). At t = t′ there exist clusters of high MRCO. At t = t′ + 4τα some of them already disappear, which indicates that MRCO is temporally fluctuating and has a finite lifetime, and thus it is nothing to do with crystal nuclei.
Difference Between MRCO and Crystal Nuclei.
Concerning this hidden structural ordering in a supercooled liquid, we have recently studied the origin of dynamic heterogeneity in a supercooled liquid state and found that medium-range bond orientational ordering is responsible for dynamic heterogeneity in some glass-forming liquids. The correlation length of bond orientational order ξ appears to diverge toward the ideal glass transition temperature T0. We confirmed this result in 2D polydisperse colloids (22), driven polydisperse granular hard spheres (23), and spin liquid with internal energetic frustration (21). Consistent with these results, we have also revealed, by using the above-mentioned Q4–Q6 correlation map, that slow regions in 3D polydisperse colloidal liquids, which form glass rather than crystal upon densification because polydispersity avoids crystallization, have high hcp-like bond orientational order with a finite lifetime (see Fig. 4). For the present system (Δ = 0), we confirm the same behavior (see Fig. 1), including the diverging length scale of spatial static heterogeneity ξ, the VFT-like divergence of the structural relaxation time τα, and the link between them. This behavior suggests some universality of such critical-like fluctuations of bond orientational ordering in a supercooled liquid (24). We note that structural ordering in a supercooled colloidal suspension is driven purely entropically, as in its crystallization: hcp-like bond orientational ordering decreases configurational entropy, but increases vibrational (or correlational) entropy, which in total decreases the free energy of the system.
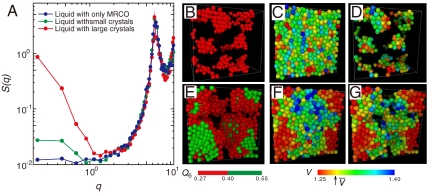
As shown in Fig. 5A, we emphasize that before crystallization the structure factor S(q) of a supercooled liquid does not have any excess scattering in the low q region around a wavenumber corresponding to the size of medium-range crystalline order, ξ, but crystallization induces a steep rise at low q, reflecting a higher density of the crystal than the liquid. We also confirm this result in real space. We apply Voronoi tessellation and analyze a local volume of the Voronoi cell of each particle. We can clearly see in Fig. 5 that crystal nuclei colored green with rhcp-like order have a high local density (Fig. 5 E–G), whereas regions with high hcp bond orientational order, which has a finite lifetime, accompany little density change (Fig. 5 B–D). Thus, the bond orientational ordering (MRCO) is decoupled from density change. This fact again leads us to the conclusion that the transient medium-range bond orientational order observed in a supercooled state is an intrinsic structural feature of a metastable supercooled state of a liquid and should not be regarded as precritical nuclei. We can use (i) decoupling of medium-range bond orientational order and coupling of a crystal nucleus with density change (i.e., positional ordering) and (ii) the local symmetry as fingerprints for whether crystal nucleation takes place or not.
Fig. 5.
Density ordering upon crystal nucleation. (A) Difference in S(q) before and after crystal nucleation at ϕ = 0.533 (N = 16,384). The blue line is S(q) before crystal nucleation (averaged from t′ to t′ + 50), the green line is S(q) just after nucleation (averaged from t′ + 50 to t′ + 70), and the red line is S(q) after crystallization (averaged from t′ + 110 to t′ + 150). Here the time unit is τB. We can see the increase of S(q) at low q for a system after crystal nucleation, indicating the density change upon crystallization. (B–D) Before crystal nucleation (t = t′ + 1.0) at ϕ = 0.537 (N = 4,096). (B) High Q6 clusters; (C) the spatial distribution of the volume of Voronoi polygon for all the particles; (D) the spatial distribution of the volume of Voronoi polygon for particles with high Q6 (see B). E–G shows the same information as B–D, respectively, but after crystal nucleation (t = t′ + 56.7) at ϕ = 0.537 (N = 4,096). The average volume per particle  (related to the average density) is indicated by the arrow on the color bar. Here we can clearly see crystal nuclei (green particles in E) have a density higher than the average (
 ) (appears as red), and is surrounded by depleted regions (
 ) (appears as green or blue).
Here it is worth mentioning the pioneering work by Schätzel and Ackerson (31) that shows the growth of long-wavelength density fluctuations during the crystallization of hard colloidal spheres by small-angle light scattering measurements. A measured structure factor exhibits a distinct peak at finite scattering vectors, reflecting the conserved nature of the particle density. This work indicates a strong coupling of the observed conserved density parameter to the nonconserved crystal-order parameter. Indeed, the real-space structure shown in Fig. 5 F and G tells us that crystal nuclei appearing red ( ) accompany depleted regions around them appearing green or blue (
 ), clearly indicating such a coupling. Although our system size is too small to see a distinct peak in S(q) in the low q region, the low q rise of S(q) observed in Fig. 5A suggests the existence of such a scattering peak because the conservation of the particle density tells us that S(q) should go to nearly zero when q approaches zero. The low q behavior of S(q) needs to be checked by larger-size simulations in the future.
Crystal Nucleation Frequency.
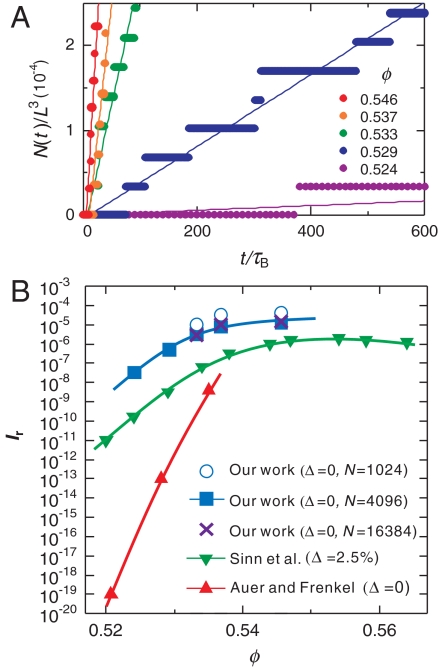
Finally, we directly measured the number of crystal nuclei as a function of time t to calculate the crystal nucleation frequency for each ϕ. Crystal nuclei were identified by the criterion Q6≥0.4 and eye inspection. Because the number density of nuclei is low and they grow with time, this simple method is robust enough. We confirmed that the decrease of the Voronoi volume per particle in a nucleus, which is a distinct feature of crystal absent in MRCO (see Fig. 5). Fig. 6A shows the ϕ dependence of the crystal nucleation number density N(t)/L3, where N(t) is the number of the crystal nuclei as a function of t, and L is the box size. The solid straight lines in the figure are the results of linear fitting: N(t)/L3 = I(t - t0), where we use the nucleation rate I and the incubation time for nucleation t0 as the fitting parameters. To calculate N(t), we performed seven independent simulations for averaging. For the case of the lowest ϕ, the system crystallizes only twice for seven simulation runs. In each simulation, we estimate the time when a crystal nucleus starts to grow and we accumulate the number of crystal nuclei. In this way, we produce the stair-like functions over all independent simulations for each ϕ to obtain N(t). The slope provides us with the nucleation rate I.
Fig. 6.
Crystal nucleation dynamics. (A) Temporal change of the number of crystal nuclei for a system of N = 4,096 (see also Supporting Information). From the rate of the increase in the number of crystal nuclei, we estimated the crystal nucleation frequency I. The numbers in the figure indicate the volume fraction ϕ. (B) The ϕ dependence of the reduced crystal nucleation frequency Ir for our work, the numerical estimate by Auer and Frenkel (15), and the experimental work by Sinn et al. (17). Curves are guides to the eye. The errors in our estimate of Ir are about the size of the symbols. We also show the results for three different system sizes (N = 1,024; 4,096; and 16,834), which indicate few finite size effects for N≥4,096. Our work almost reproduces the experimental results (17), including the ϕ dependence, i.e., the shape of the curve. The slight difference between our result and the experimental one may reflect the difference in the polydispersity between them. Here the degree of polydispersity Δ is the variance of the size distribution.
In Fig. 6B we show the ϕ dependence of the dimensionless reduced crystal nucleation frequency Ir = I(σeff)5/D0 (see Materials and Methods of σeff and D0) obtained by the above-mentioned direct simulations of a crystallization process (see Fig. 6A) and compare it with the results of experiments (17) and the numerical estimate by Auer and Frenkel (15). We can clearly see that the reduced crystal nucleation frequency Ir estimated from our simulations almost coincides with that of experiments. The slight difference in Ir between them may stem from the small difference in the polydispersity Δ (32): Δ = 0% for our case, whereas Δ = 2.5% in the experiments. We also confirm that our results for N≥4,096 are free from finite size effects (see Fig. 6B and SI Text). We speculate that the discrepancy between our results and those of Auer and Frenkel (15) may arise from (i) whether additional degrees of freedom [MRCO in a supercooled liquid and density change accompanied by crystallization (also linked to (ii)] are taken into account or not and (ii) whether the ensemble used in simulations is the canonical, constant temperature–constant volume (NVT) ensemble or isothermal–isobaric ensemble. The details are discussed in SI Text.
Discussion
Here we summarize our physical scenario of crystallization. After a quench from an equilibrium liquid state to a supercooled state, medium-range bond orientational ordering whose symmetry has a connection to an equilibrium crystal structure (hcp in hard-sphere colloids) is first formed transiently and then positional ordering follows via the first-order phase transition by overcoming a free-energy barrier for nucleation. The sequence of crystallization from melt is thus described as follows: (i) initial homogeneous equilibrium liquid → (ii) “inhomogeneous” supercooled liquid with bond orientational order → (iii) intermediate ordered phase (10–14) → (iv) final crystalline phase. In the conventional scenario, step (ii) is replaced by “homogeneous disordered supercooled liquid.”
Our finding may fundamentally alter the conventional picture of the state of liquid that a (supercooled) liquid is spatially homogeneous and possesses no structural order (at most short-range order). Since Ostwald’s seminal argument, intermediate states between the initial liquid and the final crystal state have been searched from the crystal side (10–14). However, our study demonstrates that it is equally important to consider hidden ordering in a supercooled liquid, which may be regarded as an intermediate state formed from the liquid side. This hidden ordering in a supercooled liquid further suggests an intimate link between crystallization and glass transition. Namely, a supercooled liquid is intrinsically heterogeneous and, in this sense, homogeneous nucleation may necessarily be “heterogeneous.” How universal this scenario is to more complex liquids remains for future investigation. Finally, we mention that we may view the above effects as enhanced crystal nucleation (positional ordering) by critical fluctuations associated with another phase ordering (bond orientational ordering), which was originally proposed for crystallization in protein solutions (33), if glass transition involves a sort of critical phenomena associated with bond orientational ordering, which is supposed to occur at the ideal glass transition point T0 (21–24).
Materials and Methods
Simulation Methods.
A hard-sphere system is often used as one of the simplest model systems for studying phase transitions observed in condensed matter (34). The control parameter of this system is the volume fraction ϕ rather than the temperature T, and the effective temperature is Teff = 1/ϕ. As a model of hard-sphere colloids, we employ a colloidal system interacting with the Weeks–Chandler–Andersen (WCA) repulsive potential (35): Ujk(r) = 4ϵ{(σjk/r)12 - (σjk/r)6 + 1/4} for  , otherwise Ujk(r) = 0, where σjk = (σj + σk)/2 and σj represents the size of particle j. For the monodisperse system mainly studied here, σi = σ. For a system of polydispersity, we introduce the Gaussian distribution of particle size σj. Its standard deviation is regarded as polydispersity;
  . We used standard Brownian dynamics simulations in the NVT ensemble. We mainly used simulation results for a system which contains N = 4,096 particles. To check the finite size effects, we also made simulations for N = 1,024 and N = 16,384. We confirm there is few finite size effects for systems of N≥4,096. The temperature is fixed at kBT/ϵ = 0.025. We define the volume fraction by
 |
where L is the box size and  is the effective diameter of the particle j;
  is characterized as
  . We use the effective (scaled) diameter
  and volume fraction ϕ for comparing our results with those of hard-sphere systems. In the study of glass transition, we confirmed that our WCA system with this definition of the volume fraction is equivalent with driven hard-core granular matter (22, 23), which suggests that our system can be practically regarded as hard-sphere colloids. The time unit was set to be the Brownian time τB = (σeff)2/D0, where D0 is the self-diffusion coefficient at infinite dilution.
Structural Characterization: Bond Orientational Order and S(q).
To characterize bond orientational order around particle k, Steinhardt et al. (36) introduced the rotationally invariant parameter
 |
Here
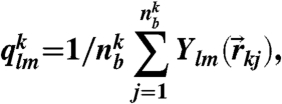 |
where  is a spherical harmonic function of degree l and order m, and
  is the number of bonds of particle k. Then its coarse-grained version including the information of the second neighbor shell was introduced by Lechner and Dellago (37) as
 |
where
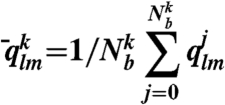 |
and here the sum from j = 0 to  runs over all neighbors of particle k (
 particles) plus the particle k itself. Thus, to calculate
  of particle k, one uses the local orientational order vectors averaged over particle k and its surroundings. Whereas
  holds the information of the structure of the first shell around particle k, its averaged version
  also takes into account the second shell. This spatial averaging added to the standard Steinhardt bond orientational order parameter (36) has tremendous significance in detecting local ordering with a high sensitivity (37). Here we mainly used the coarse-grained parameters
  and
and  which are l = 6 and l = 4 of
  , respectively. The time-averaged rotationally invariant lth order bond orientational order parameter of particle k is also calculated as
 |
Here the time average is taken for a period of τα. This time-averaged parameter was used only in Fig. 4. We also observe the structure factor S(q) in a supercooled liquid state. S(q) is calculated as S(q) = 1/(ρN)〈ρ(q)ρ(-q)〉, where
 |
Characterization of MRCO.
For characterization of the structure of MRCO in 3D, we make a correlation map of the two types of coarse-grained bond orientational order parameters,  and
and  (26), for MRCO together with those for crystals (fcc, hcp, and bcc), and a disordered liquid at a finite temperature (with thermal noises). The result is shown in Fig. 3A. Fig. 3 shows that the bond orientational order parameters’ distribution for MRCO is very similar to that for hcp, but very different from those of the other structures (fcc and bcc) for both of them. In particular, our results rule out a possibility that MRCO has an icosahedral bond orientational order. Here we note that at the zero temperature (without thermal noises) the simple cubic lattice has (Q4,Q6)sc = (0.764,0.354), the body-centered cubic lattice has (Q4,Q6)bcc = (0.036,0.511), the fcc has (Q4,Q6)fcc = (0.191,0.574), the hcp has (Q4,Q6)hcp = (0.097,0.485), and the icosahedral symmetry gives (Q4,Q6)ico = (0,0.663) (see, e.g., ref. 25). The crystal nuclei have a mixed character of fcc and hcp, which is indicative of an rhcp structure.
Supplementary Material
Acknowledgments.
We thank Mathieu Leocmach for providing the data of confocal microscopy experiments, which are used in the Supporting Information. This work was partially supported by a grant-in-aid from the Ministry of Education, Culture, Sports, Science and Technology, Japan.
Footnotes
The authors declare no conflict of interest.
This article is a PNAS Direct Submission.
This article contains supporting information online at www.pnas.org/lookup/suppl/doi:10.1073/pnas.1001040107/-/DCSupplemental.
References
- 1.Debenedetti PG. Metastable Liquids Concepts and Principles. Princeton: Princeton Univ Press; 1996. pp. 146–199. [Google Scholar]
- 2.Onuki A. Phase Transition Dynamics. Cambridge: Cambridge Univ Press; 2002. pp. 488–551. [Google Scholar]
- 3.Turnbull D. Under what conditions can a glass be formed? Contemp Phys. 1969;10:473–488. [Google Scholar]
- 4.Tanaka H. Possible resolution of the Kauzmann paradox in supercooled liquids. Phys Rev E. 2003;68:011505. doi: 10.1103/PhysRevE.68.011505. [DOI] [PubMed] [Google Scholar]
- 5.Russell WB. On the dynamics of the disorder-order transition. Phase Transit. 1990;21:127–137. [Google Scholar]
- 6.Ackerson BJ, Schätzel K. Classical growth of hard-sphere colloidal crystals. Phys Rev E. 1995;52:6448–6460. doi: 10.1103/physreve.52.6448. [DOI] [PubMed] [Google Scholar]
- 7.Sear R. Nucleation: Theory and applications to protein solutions and colloidal suspensions. J Phys: Condens Mat. 2007;19:033101. [Google Scholar]
- 8.Gasser U. Crystallization in three- and two-dimensional colloidal suspensions. J Phys: Condens Mat. 2009;21:203101. doi: 10.1088/0953-8984/21/20/203101. [DOI] [PubMed] [Google Scholar]
- 9.Auer S, Frenkel D. Numerical simulation of crystal nucleation in colloids. Adv Polym Sci. 2005;173:149–208. [Google Scholar]
- 10.Ostwald W. The formation and changes of solids (Translated from German) Z Phys Chem. 1897;22:289–330. [Google Scholar]
- 11.Stranski IN, Totomanow D. Rate of formation of (crystal) nuclei and the Ostwald step rule. Z Phys Chem. 1933;163:399–408. [Google Scholar]
- 12.Alexander S, McTague JP. Should all crystals be bcc? Landau theory of solidification and crystal nucleation. Phys Rev Lett. 1978;41:702–705. [Google Scholar]
- 13.ten Wolde PR, Ruiz-Montero MJ, Frenkel D. Numerical evidence for b.c.c. or ordering at the surface of a critical f.c.c. nucleus. Phys Rev Lett. 1995;75:2714–2717. doi: 10.1103/PhysRevLett.75.2714. [DOI] [PubMed] [Google Scholar]
- 14.ten Wolde PR, Ruiz-Montero MJ, Frenkel D. Numerical calculation of the rate of crystal nucleation in a Lennard-Jones system at moderate undercooling. J Chem Phys. 1996;104:9932–9947. [Google Scholar]
- 15.Auer S, Frenkel D. Prediction of absolute crystal-nucleation rate in hard-sphere colloids. Nature. 2001;409:1020–1023. doi: 10.1038/35059035. [DOI] [PubMed] [Google Scholar]
- 16.Harland JL, van Megen W. Crystallization kinetics of suspensions of hard colloidal spheres. Phys Rev E. 1997;55:3054–3067. [Google Scholar]
- 17.Sinn C, Heymann A, Stipp A, Palberg T. Solidification kinetics of hard-sphere colloidal suspensions. Prog Coll Pol Sci. 2001;118:266–275. [Google Scholar]
- 18.Anderson VJ, Lekkerkerker HNW. Insights into phase transition kinetics from colloidal science. Nature. 2002;416:811–815. doi: 10.1038/416811a. [DOI] [PubMed] [Google Scholar]
- 19.Gasser U, Weeks ER, Schofield A, Pusey PN, Weitz DA. Real space imaging of nucleation and growth in colloidal crystallization. Science. 2001;292:258–262. doi: 10.1126/science.1058457. [DOI] [PubMed] [Google Scholar]
- 20.Ohnesorge R, Löwen H, Wagner H. Density functional theory of crystal-fluid interfaces and surface melting. Phys Rev E. 1994;50:4801–4809. doi: 10.1103/physreve.50.4801. [DOI] [PubMed] [Google Scholar]
- 21.Shintani H, Tanaka H. Frustration on the way to crystallization in glass. Nat Phys. 2006;2:200–206. [Google Scholar]
- 22.Kawasaki T, Araki T, Tanaka H. Correlation between dynamic heterogeneity and medium-range order in two-dimensional glass-forming liquids. Phys Rev Lett. 2007;99:215701. doi: 10.1103/PhysRevLett.99.215701. [DOI] [PubMed] [Google Scholar]
- 23.Watanabe K, Tanaka H. Direct observation of medium-range crystalline order in granular liquids near the glass transition. Phys Rev Lett. 2008;100:158002. doi: 10.1103/PhysRevLett.100.158002. [DOI] [PubMed] [Google Scholar]
- 24.Tanaka H, Kawasaki T, Shintani H, Watanabe K. Critical-like behavior of glass-forming liquids. Nat Mater. 2010;9:324–331. doi: 10.1038/nmat2634. [DOI] [PubMed] [Google Scholar]
- 25.Aste T, Saadatfar M, Senden TJ. Geometrical structure of disordered sphere packings. Phys Rev E. 2005;71:061302. doi: 10.1103/PhysRevE.71.061302. [DOI] [PubMed] [Google Scholar]
- 26.Lechner W, Dellago C. Accurate determination of crystal structures based on averaged local bond order parameters. J Chem Phys. 2008;129:114707. doi: 10.1063/1.2977970. [DOI] [PubMed] [Google Scholar]
- 27.Glaser MA, Clark NA. Melting and liquid structure in two dimensions. Adv Chem Phys. 1993;83:543–709. [Google Scholar]
- 28.Cheng Z, Chaikin PM, Zhu J, Russel WB, Meyer WV. Crystallization kinetics of hard spheres in microgravity in the coexistence regime: Interactions between growing crystallites. Phys Rev Lett. 2001;88:015501. doi: 10.1103/PhysRevLett.88.015501. [DOI] [PubMed] [Google Scholar]
- 29.Marr DW, Gast AP. Planar density-functional approach to the solid-fluid interface of simple liquids. Phys Rev E. 1993;47:1212–1221. doi: 10.1103/physreve.47.1212. [DOI] [PubMed] [Google Scholar]
- 30.Davidchack RL, Laird BB. Direct calculation of the hard-sphere crystal melt interfacial free energy. Phys Rev Lett. 2000;85:4751–4754. doi: 10.1103/PhysRevLett.85.4751. [DOI] [PubMed] [Google Scholar]
- 31.Schätzel K, Ackerson BJ. Density fluctuations during crystallization of colloids. Phys Rev E. 1993;48:3766–3777. doi: 10.1103/physreve.48.3766. [DOI] [PubMed] [Google Scholar]
- 32.Auer S, Frenkel D. Suppression of crystal nucleation in polydisperse colloids due to increase of the surface free energy. Nature. 2001;413:711–713. doi: 10.1038/35099513. [DOI] [PubMed] [Google Scholar]
- 33.ten Wolde PR, Frenkel D. Enhancement of protein crystal nucleation by critical density fluctuations. Science. 1997;277:1975–1978. doi: 10.1126/science.277.5334.1975. [DOI] [PubMed] [Google Scholar]
- 34.Pusey PN, van Megen W. Phase behavior of concentrated suspensions of nearly hard colloidal spheres. Nature. 1986;320:340–342. [Google Scholar]
- 35.Weeks JD, Chandler D, Andersen HC. Role of repulsive forces in determining the equilibrium structure of simple liquids. J Chem Phys. 1971;54:5237–5247. [Google Scholar]
- 36.Steinhardt PJ, Nelson DR, Ronchetti M. Bond-orientational order in liquids and glasses. Phys Rev B. 1983;28:784–805. [Google Scholar]
- 37.Lechner W, Dellago C. Accurate determination of crystal structures based on averaged local bond order parameters. J Chem Phys. 2008;129:114707. doi: 10.1063/1.2977970. [DOI] [PubMed] [Google Scholar]
Associated Data
This section collects any data citations, data availability statements, or supplementary materials included in this article.


