Abstract
Differential gene expression between groups of homogenous cell types is a biological question whose time has come. RNA can be extracted from small numbers of cells, such as those isolated by laser-capture microdissection, but the small amounts obtained often require amplification to enable whole genome transcriptome profiling by technologies such as microarray analysis and RNA-seq. Recently, advances in amplification procedures make amplification directly from whole cell lysates possible. The aim of this study was to compare two amplification systems for variations in observed RNA abundance attributable to the amplification procedure for use with small quantities of cells isolated by laser-capture microdissection. Arabidopsis root cells undergoing giant cell formation as a result of nematode infestation and uninfested control root cells were laser-captured and used to evaluate two amplification systems. One, NuGEN's WT-Ovation Pico (Pico) amplification system, uses total RNA as starting material, and the other, NuGEN's WT-One-Direct (One-Direct) amplification system, uses lysate containing the captured cells. The reproducibility of whole genome transcript profiling and correlations of both systems were investigated after microarray analysis. The One-Direct system was less reproducible and more variable than the Pico system. The Pico amplification kit resulted in the detection of thousands of differentially expressed genes between giant cells and control cells. This is in marked contrast to the relatively few genes detected after amplification with the One-Direct amplification kit.
Keywords: cryosectioning, differential expression, root knot nematode, technical replicates
INTRODUCTION
Plants are composed of a vast array of different tissue and cells types that act in concert to generate a functional organism. For example, different complexes of sieve element-companion cells—specialized cells critical for phloem loading that are located in the same minor vein—use different mechanisms for loading carbohydrates into the phloem for transport throughout the plant.1 The disparate functions of each cell type are reflected in their cellular compositions. One method used successfully for isolating specific plant cells for analysis is laser-capture microdissection.2–4 In combination with highly multiplexed assays for transcriptome profiling, such as microarrays or massively parallel sequencing, this technique can be a powerful tool to increase our understanding of biological processes occurring in response to various stimuli or developmental cues. However, acquiring sufficient RNA from individual cells or small populations of cells for RNA profiling assays can be difficult, and RNA amplification is necessary to obtain sufficient target material for detection in the assay.
RNA amplification for these assays must be linear to preserve the relative abundance levels of constituent targets within a sample and to reduce the likelihood of artificially altered abundance differences between samples. Although the linearity of PCR is dependent on each target's length and nucleotide composition and thus, is not used widely for transcriptome profiling, two other methods have been shown to provide sufficiently consistent and linear amplification from total RNA to enable profiling of complex target samples. In vitro transcription from cDNA carrying the T7 promoter5 can be used with a minimum input of approximately 50 ng total RNA, and multiround strategies using serially repeated amplification reactions have been used for lower input amounts. Alternatively, the Ribo-SPIA reaction uses a combination of RNA primer, DNA polymerase, and RNase to isothermally amplify total RNA.6 NuGEN Technologies Inc. (San Carlo, CA, USA) supplies Ribo-SPIA kits designed for various amounts and qualities of input RNA, including minimum inputs of 500 pg total RNA or crude lysates from single cells. Regardless of the method used, the quality and technical consistency of initial cDNA production, amplification to representative cRNA or cDNA, and target labeling are critical for accurate assessment of transcriptome differences between biological conditions.
We evaluated two RNA amplification protocols offered by NuGEN Technologies Inc. WT-Ovation Pico (Pico) and WT-Ovation One-Direct (One-Direct)] for variations in observed RNA abundance attributable to the amplification procedure. A number of published studies have included the Pico kit or its previous version and found it suitable for RNA amplification for animal7,8 and plant materials.9 In contrast, the One-Direct kit was releasecd recently (2009), and its performance has not been widely evaluated. Although both protocols use Ribo-SPIA technology from NuGEN Technologies Inc., the One-Direct kit offers the option of RNA amplification in a cell lysate without the requirement for prior RNA isolation. RNA amplification directly from a lysate offers a number of positive aspects, such as reducing the amount of handling, the time to completion, and labor intensiveness, all of which can potentially increase technical variability in genomics assays.
MATERIALS AND METHODS
Plant and Nematode Material
Arabidopsis thaliana seedlings (Columbia ecotype) were infested with Meloidogyne incognita nematodes, according to the method described by Hammes et al.10 Briefly, Arabidopsis seeds were sterilized and sown, five seeds/plate, 30 plates total, in a medium containing 2% sucrose, 0.3% Gamborg's basal salts, and 0.6 % Phytagel, pH 6.1. Plates were placed at a 45° angle in a short-day chamber (23°C, 8 h light/16 h dark). After 3 weeks, each plate was inoculated with 1000 M. incognita Stage 2 juveniles. The plates were placed at an angle in a clear acrylic humid box and returned to the short-day chamber. Twenty-one days after inoculation, root knots and noninfected roots were collected for laser-capture microdissection.
Laser-Capture Microdissection
Cryosections (25 μm) were obtained from collected root samples using a cryotome (Thermo Electron, Pittsburgh, PA, USA) at –20°C. Each section was transferred to an adhesive-coated slide (Leica Biosystems, Richmond, IL, USA), according to the manufacturer's instructions. Slides were dehydrated in 70% (v/v) ethanol for 10 min at room temperature, followed by washes in ethanol [at 4°C, 2 min each (v/v) 70%, 95%, 100%] and xylenes (at 4°C, 2 min). A final 2 min dehydration step was carried out in xylenes at room temperature. Slides were air-dried at room temperature for approximately 15 min prior to laser-pressure catapulting.
Approximately 80 root cells undergoing giant cell formation (∼5,000,000 μm2 area) per biological replicate were captured using the PALM Microbeam (P.A.L.M. Microlaser Technologies, Bernried, Germany). Approximately 150 control root cells not undergoing giant cell formation (∼13,000,000 μm2 area) were captured from noninfested regions of the same replicate. Giant cells and noninfected root cells were catapulted using the AutoLPC method directly to P.A.L.M. adhesive caps.
RNA Profiling
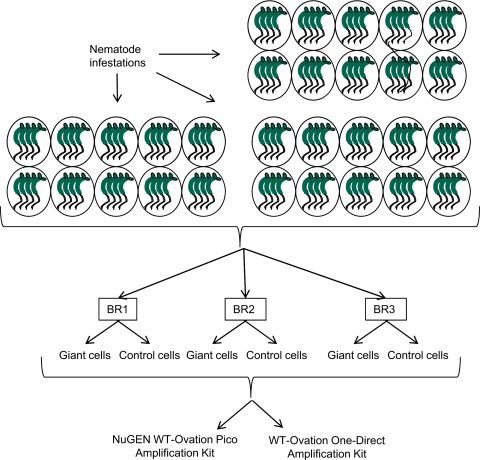
Evaluation of each amplification system consisted of three biological replicates per treatment with one biological replicate split into three technical replicates for a total of 10 samples per amplification procedure (Fig. 1). RNA samples for amplification with the Pico kit were isolated from 150 control cells or from 80 giant cells using the PicoPure RNA isolation kit (Arcturus, Mountain View, CA, USA) with the optional DNase treatment, according to the manufacturer's instructions. Total RNA was concentrated and cleaned using a RNA Clean & Concentrator-5 (Zymo Research, Orange, CA, USA). Total RNA was quantified using a Nanodrop Spectrophotometer 2000 (Thermo Scientific Inc., Waltham, MA, USA) and the quality confirmed on an Agilent 2100 bioanalyzer (Agilent Technologies, Santa Clara, CA, USA). For amplification with the One-Direct kit, samples containing 150 control or 80 giant cells were collected directly into 2 μl of the NuGEN lysis buffer.
FIGURE 1.
Experimental design. Arabidopsis plants, 3 weeks post-inoculation with juvenile M. incognita, were divided into three biological replicates (BR). Giant cells and control root cells were collected from each biological replicate. All biological replicates were processed with Pico or One-Direct kits. Biological replicates 1 and 2 were subdivided further into three technical replicates.
RNA amplifications were carried out according to the kits' protocols. Total RNA (2 ng) was used as input for the Pico method; 2 μl lysate was used for One-Direct. cDNA amplification products were labeled with biotin using the NuGEN FL module, and hybridized to ATH1 genome arrays (Affymetrix Inc., Santa Clara, CA, USA). Microarrays were processed using standard Affymetrix protocols. Data were quantified using the Expression Console MAS5 algorithm (Affymetrix Inc.), which computes a weighted average of 11 independent probes per targeted transcript after correction for regional and probe-specific background, followed by normalization across all samples by global scaling. The resulting signal intensities and present/absent calls were tabulated and compiled into a single data set for comparison and are available as GEO Accession GSE21981 (http://www.ncbi.nlm.nih.gov/geo/).
Statistical Analysis
The percentage of the transcriptome detected for each sample was tabulated using the Affymetrix “present” call. The distribution of transcript abundance levels across the genome was estimated using a kernel density estimate11 and box plots. Samples were compared for the global effect on the transcriptome using principal component and hierarchical cluster analyses.
Detection rates between technical replicates of the same sample and biological replicates of the same cell type were compared using the κ statistic, a chance corrected measure of agreement12 to determine if detection levels were systematically biased. The technical and biological replicates were compared for symmetry using McNemar's test.
Estimated gene-expression levels were compared among technical replicates using Spearmans' correlation coefficient. To identify transcripts with low abundance in one technical replicate and high abundance in a different technical replicate, signal values were divided into four equal groups. Technical replicates were compared using the κ statistic and Bowker's test for symmetry. The number of genes for which a large disagreement (more than one category difference) existed was tabulated for each pair of technical replicates.
The main interest is in determining if the detection of differential expression is affected by the choice of amplification strategy. The experimental design allows the comparison of giant cell and normal tissue and the detection of significant differences, given variance observed among three biological replicates of each condition. The following ANOVA model, Yif = μ + τi + εij, was fit, where Y is the natural log of each gene's normalized signal. The fixed effect of amplification (i=Pico; j=One-Direct) was compared using an F test. Only biological replicates were included in this model. The number of genes significantly different at nominal (0.05) and false-discovery rate (FDR)-corrected13,14 levels was tabulated. Statistical analysis of microarray (SAM)15 was also carried out with Δ value settings of 5 (One-Direct FDR 20%), 1 (One-Direct FDR 10%), 0.55 (Pico FDR 20%), and 0.8 (Pico FDR 10%).
RESULTS
In this study, we evaluated two RNA amplification protocols from NuGEN: the Pico kit and the One-Direct kit. The analysis was performed using Arabidopsis plants infested with nematodes as described.10 Twenty-one days post-infestation, approximately 80 root cells undergoing giant cell formation were captured per biological replicate using laser-capture microdissection, along with approximately 150 control root cells from the same plants. Evaluation of each amplification system consisted of a total of three biological replicates per treatment (giant or control cells) with one biological replicate split into three technical replicates for a total of 10 samples on 10 GeneChips per amplification procedure (Fig. 1). RNA amplified with the Pico kit was isolated from captured cells and quality-confirmed using a bioanalyzer (Agilent Technologies; Supplemental Fig. 1). All Pico amplification reactions were carried out with 2 ng RNA. Tissue samples for amplification with the One-Direct kit were collected directly into 2 μl of the provided lysis buffer. One of the One-Direct lysates was increased to 6 μl by adding more lysis buffer and divided into three technical replicates prior to further analysis. For the One-Direct kit, double-stranded cDNA synthesis was carried out in the entire volume of lysate and cDNA purified prior to amplification. Pico amplification yields ranged from 6.4 to 8.7 μg cDNA, and One-Direct yields ranged from 8 to 10.8 μg cDNA with no differences between diluted and unadjusted lysates (Supplemental Tables 1 and 2). The size range of amplification products was skewed consistently toward shorter fragments with the One-Direct method (Supplemental Figs. 2 and 3).
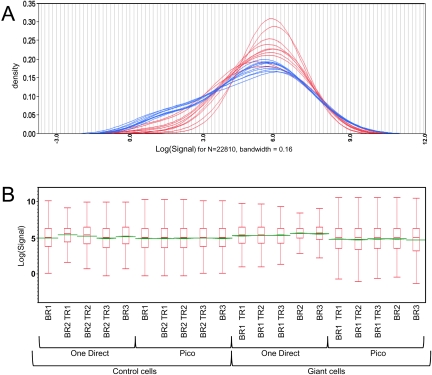
A comparison of overall gene-expression levels for each of the amplification methods identified key differences. Distribution analysis found noticeable differences in the number of genes per expression level bin across the dynamic range (Fig. 2A and B). The broader distribution and dynamic range for Pico than for One-Direct is most apparent at low expression levels and is reflected in the number of transcripts called present for the two amplification protocols (Table 1). On average, 60.5% of transcripts were called present on the Pico amplification microarrays and 85.0% for the One-Direct microarrays.
FIGURE 2.
Differences in gene-expression levels observed after Pico and One-Direct amplifications. Kernel density estimates (A) of transcript distributions across the genome. Pico amplifications are shown in blue and One-Direct in red. Box plots (B) for each microarray. Biological replicates with technical replicates (TR) are indicated. The box ends define the 25th and 75th quantiles, and the green line identifies median values.
TABLE 1.
Percent of probe sets with signal detected as present for each microarray
| Cell type | Amplification protocol | Biological replicate | Technical replicate | Percent present |
|---|---|---|---|---|
| Control | Pico | BR1 | n/a | 60.9 |
| Control | Pico | BR2 | TR1 | 64.2 |
| Control | Pico | BR2 | TR2 | 63.5 |
| Control | Pico | BR2 | TR3 | 60.5 |
| Control | Pico | BR3 | n/a | 61.3 |
| Giant | Pico | BR1 | TR1 | 61.5 |
| Giant | Pico | BR1 | TR2 | 60.4 |
| Giant | Pico | BR1 | TR3 | 59.9 |
| Giant | Pico | BR2 | n/a | 57.4 |
| Giant | Pico | BR3 | n/a | 66.1 |
| Control | One-Direct | BR1 | n/a | 68.3 |
| Control | One-Direct | BR2 | TR1 | 91.4 |
| Control | One-Direct | BR2 | TR2 | 85.4 |
| Control | One-Direct | BR2 | TR3 | 75.0 |
| Control | One-Direct | BR3 | n/a | 82.6 |
| Giant | One-Direct | BR1 | TR1 | 88.7 |
| Giant | One-Direct | BR1 | TR2 | 92.9 |
| Giant | One-Direct | BR1 | TR3 | 87.8 |
| Giant | One-Direct | BR2 | n/a | 94.3 |
| Giant | One-Direct | BR3 | n/a | 94.9 |
n/a, Not applicable.
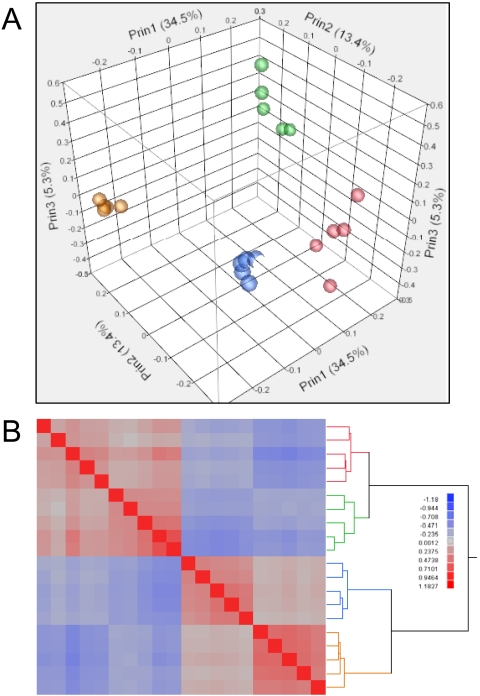
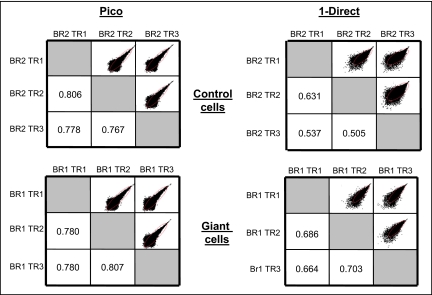
Principle component analysis (Fig. 3A) was used to explore the degree of relatedness among samples for overall RNA expression profiles. The first component accounts for 34.5% of the total variability in the data and distinguishes the Pico and One-Direct amplification methods. The second component, accounting for 13.4% of the variability, distinguishes samples generated from giant versus control cells. It is clear from principle component 3 (5.3%) that the One-Direct method results in greater variability between technical and biological replicates compared with the Pico kit. A correlation heat map for each amplification type demonstrates these effects (Fig. 3B). The pair-wise scatter-plots of the natural log of the intensities for the technical replicates demonstrate increased spread of the data, particularly in the lower-intensity ranges (Fig. 4).
FIGURE 3.
Correlations across microarray data sets. Principle (Prin) components analysis (A) is plotted for Pico amplifications in gold (giant cell) and blue (control cells) and One-Direct amplifications in green (giant cells) and red (control cells). A correlation heat map (B) was generated by unsupervised hierarchical clustering of samples. Colors are as in A.
FIGURE 4.
Variation in reproducibility according to amplification protocol. Scatter-plots were generated using the natural log of the MAS5 signals and are shown with the associated weighted κ statistic for the indicated technical replicates. Red ovals indicate 95% density ellipse.
For pairs of technical replicates, the Spearman correlation coefficient was calculated. The average of these pairwise measures was higher for the Pico amplifications than for the One-Direct (Table 2). To determine whether the increased variability in the technical replications for the One-Direct samples might be a result of inconsistent amplification of very low-abundance transcripts, we restricted these comparisons to probe sets detected consistently in all Pico samples. The results were highly similar (Table 2), indicating that the increased variability in the One-Direct is not solely a result of the amplification of very low-abundance transcripts. The coefficient of variation (CV) values for the One-Direct amplifications (0.001686–22.8121) were higher than the Pico amplifications (0.001559–6.1144) and unrelated (the CV values for the same gene were usually different between amplification methods).
TABLE 2.
Spearman correlation coefficients averaged across technical replicates
| Protocol | Treatment | Spearman, all genes presenta | Spearman, genes present in Picob |
|---|---|---|---|
| Pico | control cells | 0.942 | 0.93 |
| Pico | giant cells | 0.942 | 0.940 |
| One-Direct | control cells | 0.775 | 0.753 |
| One-Direct | giant cells | 0.886 | 0.87 |
aAll genes present in all arrays included in analysis.
bOnly genes present in all Pico arrays included in analysis.
As expected, the κ coefficients for the technical replicates were lower than the Spearman correlation coefficients. These chance-corrected measures of agreement give a more accurate picture of the underlying agreement among the replicates (Fig. 4). The weighted κ coefficients are consistently higher for the Pico samples than the One-Direct. Agreement for One-Direct is low but not biased in any individual technical replicate, as none was significant in Bowker's test of symmetry. Detection rates are significantly different between technical replicates for Pico and One-Direct using the κ statistic.
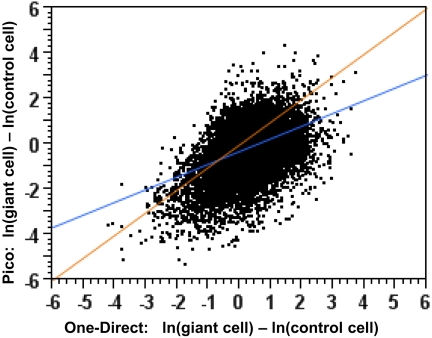
Differences in the estimates of differential expression were apparent (Fig. 5), and the number of genes detected as differentially expressed was reduced greatly in the One-Direct protocol (Table 3). To determine if a different statistical approach would affect the conclusions, SAM15 was performed. The total number of genes detected as significantly, differentially expressed was greater for SAM than for ANOVA (Table 3). Results were consistent with the ANOVA analysis; the number of genes detected as differentially expressed was much smaller for the One-Direct amplification.
FIGURE 5.
Comparison of gene-expression measurements after Pico and One-Direct amplification. Scatter-plot with regression line (blue) of the difference between the natural log of the giant cell MAS5 signal and the natural log of the control cell MAS5 signal for Pico (y-axis) and One-Direct (x-axis). A 45° trend (perfect agreement) line is drawn in orange.
TABLE 3.
Number of genes with significantly different abundance after each amplification protocol using ANOVA and SAM
| ANOVA |
SAMa |
||
|---|---|---|---|
| Pico | One-Direct | Pico | |
| 10% FDR | 3694 | 0 | 9658 |
| 20% FDR | 8159 | 1 | 12,815 |
| Nominal P < 0.05 | 11,181 | 2564 | nd |
and, Not determined.
DISCUSSION
The Pico system, although more labor-intensive than the One-Direct, performed well and resulted in the detection of genes differentially expressed between giant cells and normal root cells. In contrast, the One-Direct system detected many fewer significantly, differentially expressed genes after ANOVA and SAM analyses. Given the phenotypic differences between cells undergoing giant cell formation and normal root cells, the inability of the One-Direct system to identify differences in gene expression that are evident using the Pico system is marked. The increased variability and decreased reliability of the One-Direct system could have a number of origins; the cell types analyzed in this study may not be compatible with cDNA synthesis carried out in a crude lysate as a result of other constituents, the One-Direct system may over-amplify the underlying biological variation as compared with the Pico system, and the number of cells added to the lysate may have overloaded the One-Direct system. Other studies have also found that the Pico system accurately reflects differences in gene expression from low-input samples.7,8 The Pico system is a better choice for the samples examined in this study.
ACKNOWLEDGMENT
This work was supported by the National Science Foundation under grant number 0821954.
Footnotes
There is no financial support or association that may pose a conflict of interest in this study.
REFERENCES
- 1.Voitsekhovskaja OV, Rudashevskaya EL, Demchenko KN, et al. Evidence for functional heterogeneity of sieve element-companion cell complexes in minor vein phloem of Alonsoa meridionalis. J Exp Botany 2009;60:1873–1883 [DOI] [PubMed] [Google Scholar]
- 2.Brooks L, III, Strable J, Zhang X, et al. Microdissection of shoot meristem functional domains. PLoS Genet 2009;5:e1000476.. [DOI] [PMC free article] [PubMed] [Google Scholar]
- 3.Day RC, Herridge RP, Ambrose BA, Macknight RC. Transcriptome analysis of proliferating Arabidopsis endosperm reveals biological implications for the control of syncytial division, cytokinin signaling, and gene expression regulation. Plant Physiol 2008;148:1964–1984 [DOI] [PMC free article] [PubMed] [Google Scholar]
- 4.Kerk NM, Ceserani T, Tausta SL, Suxxex IM, Nelson TM. Laser capture microdissection of cells from plant tissues. Plant Physiol 2003;132:27–35 [DOI] [PMC free article] [PubMed] [Google Scholar]
- 5.Van Gelder RN, von Zastrow ME, Yool A, Dement WC, Barchas JD, Everwine JH. Amplified RNA synthesized from limited quantities of heterogeneous cDNA. Proc Natl Acad Sci USA 1990;87:1663–1667 [DOI] [PMC free article] [PubMed] [Google Scholar]
- 6.Kurn N, Chen P, Heath JD, Kopf-Sill A, Stephens KM, Wang S. Novel isothermal, linear nucleic acid amplification systems for highly multiplexed applications. Clin Chem 2005;51: 1973–1981 [DOI] [PubMed] [Google Scholar]
- 7.Caretti E, Kevarajan K, Coudry R, et al. Comparison of RNA amplification methods and chip platforms for microarray analysis of samples processed by laser capture microdissection. J Cell Biochem 2008;103:556–563 [DOI] [PubMed] [Google Scholar]
- 8.Clement-Ziza M, Gentien D, Lyonnet S, Thiery J-P, Besmond C, Decraene C. Evaluation of methods for amplification of picogram amounts of total RNA for whole genome expression profiling. BMC Genomics 2009;10:246–260 [DOI] [PMC free article] [PubMed] [Google Scholar]
- 9.Rehrauer H, Aquino C, Gruissem W, et al. AGRONOMICS1: a new resource for Arabidopsis transcriptome profiling. Plant Physiol 2009;152:487–499 [DOI] [PMC free article] [PubMed] [Google Scholar]
- 10.Hammes UZ, Nielsen E, Honaas LA, Taylor CG, Schachtman DP. AtCAT6, a sink-tissue-localized transporter for essential amino acids in Arabidopsis. Plant J 2006;48:414–426 [DOI] [PubMed] [Google Scholar]
- 11.Silverman BW. Density Estimation for Statistics and Data Analysis. London, UK: Chapman and Hall, 1986. [Google Scholar]
- 12.Fleiss JL. Statistical Methods for Rates and Proportions, 2nd ed New York, NY, USA: Wiley, 1981. [Google Scholar]
- 13.Storey JD, Tibshirani R. Statistical significance for genome-wide studies. Proc Natl Acad Sci USA 2003;100:9440–9445 [DOI] [PMC free article] [PubMed] [Google Scholar]
- 14.Verhoeven KJF, Simonsen KL, McIntyre LM. Implementing false discovery rate control: increasing your power. Oikos 2005;108:643–647 [Google Scholar]
- 15.Tusher VG, Tibshirani R, Chu G. Significance analysis of microarrays applied to the ionizing radiation response. Proc Natl Acad Sci USA 2001;98:5116–5121 [DOI] [PMC free article] [PubMed] [Google Scholar]


