

Abstract
Background
Compared with women aged 50–69 years, the lower sensitivity of mammographic screening in women aged 40–49 years is largely attributed to the lower mammographic tumor detectability and faster tumor growth in the younger women.
Methods
We used a Monte Carlo simulation model of breast cancer screening by age to estimate the median tumor size detectable on a mammogram and the mean tumor volume doubling time. The estimates were calculated by calibrating the predicted breast cancer incidence rates to the actual rates from the Surveillance, Epidemiology, and End Results (SEER) database and the predicted distributions of screen-detected tumor sizes to the actual distributions obtained from the Breast Cancer Surveillance Consortium (BCSC). The calibrated parameters were used to estimate the relative impact of lower mammographic tumor detectability vs faster tumor volume doubling time on the poorer screening outcomes in younger women compared with older women. Mammography screening outcomes included sensitivity, mean tumor size at detection, lifetime gained, and breast cancer mortality. In addition, the relationship between screening sensitivity and breast cancer mortality was investigated as a function of tumor volume doubling time, mammographic tumor detectability, and screening interval.
Results
Lowered mammographic tumor detectability accounted for 79% and faster tumor volume doubling time accounted for 21% of the poorer sensitivity of mammography screening in younger women compared with older women. The relative contributions were similar when the impact of screening was evaluated in terms of mean tumor size at detection, lifetime gained, and breast cancer mortality. Screening sensitivity and breast cancer mortality reduction attributable to screening were almost linearly related when comparing annual or biennial screening with no screening. However, when comparing annual with biennial screening, the greatest reduction in breast cancer mortality attributable to screening did not correspond to the greatest gain in screening sensitivity and was more strongly affected by the mammographic tumor detectability than tumor volume doubling time.
Conclusion
The age-specific differences in mammographic tumor detection contribute more than age-specific differences in tumor growth rates to the lowered performance of mammography screening in younger women.
CONTEXT AND CAVEATS
Prior knowledge
Poorer mammography screening outcomes (screening sensitivity, tumor size, lifetime gained, and mortality) in younger women (40–49 years) are partly because of faster tumor growth and partly reduced tumor detectability on mammograms.
Study design
Breast Cancer Screening Simulator, a modified computer simulation model, was developed for this study to estimate the relative contributions of biological factor (tumor growth) vs technological factor (mammographic tumor detectability) in screening outcomes of younger women (40–49 years) compared with older women (50–69 years).
Contribution
Approximately 79% of poorer mammography screening sensitivity was because of reduced mammographic tumor detectability, and only 21% was because of faster tumor growth. The relative contributions were similar for other screening outcomes.
Implications
The technological factor contributed more to the age-specific differences in screening outcomes, and further advancement in technologies to detect breast cancer in younger women is needed.
Limitations
The estimates are subject to study biases. Also, the analysis did not investigate if reduced mammographic tumor detectability was an independent risk factor and associated with a specific subtype of breast cancer.
From the Editors
Mammographic screening aims to reduce breast cancer mortality by prompting early detection and treatment. Conventional film mammography screening is known to reduce breast cancer mortality among women aged 50–69 years by up to 32% (1–6), but its effectiveness among younger women, aged 40–49 years, is controversial. Several clinical trials suggested that conventional mammography screening may reduce mortality from breast cancer in younger women, but these reductions were small and not statistically significant (1,3–5,7,8); other studies have reported no mortality benefit in this age group (1,5,9).
The poorer effectiveness of mammography screening in younger women is most often attributed to two factors. First, breast cancer incidence is lower in younger women, resulting in a lower reduction in overall breast cancer mortality attributable to screening (10). Second, the sensitivity of mammography screening is lower in younger women (11). This may be partly because of faster tumor growth (12) and reduced ability to delineate tumors on conventional mammograms because of greater mammographic breast density (13). Buist et al. (14) reported that greater mammographic breast density was the primary factor for reduced sensitivity of annual screening in women aged 40–49 years compared with older women, whereas both rapid tumor growth and greater mammographic breast density contributed similarly in biennial screening.
In this study, we presented a computer-based simulation analysis of screening to evaluate the relative impact of mammographic tumor detectability and tumor volume doubling time (referred hereon as “doubling time”) on the poorer screening outcomes in younger women compared with older women. We defined “mammography threshold” as the smallest tumor diameter detectable on screening mammography and used the threshold values to characterize mammographic tumor detectability. The following screening outcomes were evaluated—screening sensitivity, mean tumor size at diagnosis, lifetime gained, and breast cancer mortality. To quantify the relative effect of the age-specific differences in mammography threshold and doubling time on these outcomes, we considered hypothetical screening scenarios whereby women aged 40–49 years have either the mammography threshold or the doubling time or both of women aged 50–69 years. These hypothetical scenarios allowed us to separate the effects of a biological factor (eg, doubling time) and a technological factor (eg, mammography threshold) on the poorer outcomes associated with screening younger women.
The purpose of this study was to determine whether the biological or the technological factor has a greater impact on screening outcomes. If the technological factor dominates, then pursuing incremental advances in mammography is warranted; but if the biological factor dominates, then rethinking approaches for early detection in younger women becomes a necessity.
Methods
Breast Cancer Screening Simulator
This study is based on the Breast Cancer Screening Simulator (BCSS), a computer simulation model developed previously by our group to analyze the effects of screening mammography in the general population (15). A summary of BCSS is provided in the Supplementary Methods (available online). BCSS is a Monte Carlo simulation model that generates the life history of individual breast cancer patients and then reports aggregated, population-level breast cancer screening outcomes. For the life history of each breast cancer patient, BCSS generates the natural history of the invasive-only disease (in terms of tumor growth and clinical stage progression), age at mammogram screening, the mammography threshold at each screening examination, the age at diagnosis, tumor size and clinical stage at detection, mode of detection (screening vs symptomatic), type of adjuvant treatment received, if any, and its efficacy, the age of death, and cause of death (breast cancer vs other causes). At the population level, the natural history of invasive breast cancer is modeled as a stochastic process, from which an individual breast cancer patient simulated in BCSS is randomly assigned a doubling time, conditioned on her age at symptomatic detection. The probability of advancement in clinical stage increases as the tumor grows; however, progression of invasive disease from an in situ (noninvasive) stage is not modeled. Each woman is randomly assigned a mammography threshold from a distribution of values estimated at the population level, dependent on her age at the time of screening. If the woman has a tumor at or above the mammography threshold at the time of screening, the tumor is classified “screen detected”; otherwise, it is classified “not screen detected.” In BCSS, the mammography threshold is considered as a surrogate to mammographic density, which is a measure of the glandular breast tissue density. Higher mammographic density contributes to masking the tumor when it is small and increases the risk of breast cancer. We tested for a linear dependence between the age-specific mammography threshold and mammographic density, shown in the Supplementary Figure 2 (available online).
Calibration of Age-Specific Mammography Threshold and Doubling Time
In this study, we modified BCSS to include age-specific estimates of mammography threshold and doubling time. In the original BCSS, the mammography threshold and doubling time were not dependent on age (15). For age dependence, we assumed a linear relationship between the median mammography threshold and age at time of screening and a separate linear relationship between the mean doubling time and age at clinical diagnosis. Age in years was categorized into five groups (<40, 40–49, 50–59, 60–69, and >70). We calibrated the age-specific median mammography threshold and mean doubling time, discussed in the next paragraph. The calibration was done so that BCSS reproduces, as close as possible, the observed age-specific breast cancer incidence rates derived from the Surveillance, Epidemiology, and End Results (SEER) database and observed age-specific distributions of screen-detected tumor sizes obtained from the Breast Cancer Surveillance Consortium (BCSC), from January 1, 1994, to December 31, 2003.
For calibration, we used two goodness-of-fit measures: 1) = the χ2-statistic between the age-specific SEER and BCSS breast cancer incidence and 2) = the χ2-statistic between age-specific BCSC and BCSS tumor size distributions. The objective function (f) was defined as the sum (∑) of the two average χ2-statistics 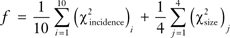 , where i represents one of the ten 5-year age groups (35–39, 40–44, …, 75–79), whereas j represents one of the four age ranges (30–49, 50–59, 60–69, and >70). The objective function was optimized by the Nelder–Mead method (16). At first, we initialized all the age groups with the median mammography threshold of 1.0 cm and mean doubling time of 0.75 year that was used in our prior work (15); in addition, we found convergence from a range of initial conditions for the age-specific median threshold and mean doubling time.
Relative Contributions of Mammography Threshold and Doubling Time to Screening Outcomes in Younger vs Older Women
Our objective was to determine what would have happened if women aged 40–49 years had the doubling time and/or mammography threshold of women aged 50–69 years. For this, we defined four hypothetical scenarios: scenario 1, women aged 40–49 years were assigned their own mammography threshold and doubling time; scenario 2, they were assigned their own mammography threshold but the mean doubling time of women aged 50–69 years; scenario 3, they were assigned the median mammography threshold of women aged 50–69 years but their own doubling time; and scenario 4, they were assigned the median mammography threshold and the mean doubling time of women aged 50–69 years. In all of the scenarios, women aged 50–69 years underwent annual screening, whereas women aged 40–49 years underwent none, annual, or biennial screening. For each scenario, we computed screening outcomes (screening sensitivity, mean tumor size at diagnosis, lifetime gained, and breast cancer mortality) for a 1960 US birth cohort of 5 000 000 women. By comparing the screening outcomes of these scenarios, we determined the relative contribution of the mammography threshold vs doubling time on the poorer screening outcomes in younger women compared with older women.
Sensitivity Analysis
We performed sensitivity analyses by quantifying changes in screening sensitivity and breast cancer mortality as we varied, in younger women only, the median mammography threshold from 0.8 to 2.0 cm, the mean doubling time from 30 to 335 days, and the screening interval from 1 to 2 years. In addition, we evaluated the joint relationship between screening sensitivity and breast cancer mortality as a function of mammography threshold, doubling time, and screening interval.
Results
Age-Specific Estimates of Mammography Threshold and Doubling Time
The age-specific estimates for the median mammography threshold and mean doubling time for various age groups are shown in Table 1. The cumulative distribution functions for the doubling time and mammography threshold are shown in Supplementary Figures 1 and 2 (available online), respectively, for women aged 40–49 vs 50–69 years. As expected, the mammography threshold increased and the doubling time decreased for the younger women aged 40–49 years (Table 1). In these women, the median mammography threshold was 24% larger (1.44 vs 1.16 cm) and the mean doubling time was 17% shorter (206 vs 247 days) compared with women aged 50–69 years. These age-specific estimates were obtained by calibrating the BCSS to the SEER breast cancer incidence and BCSC tumor size distributions at screen detection using the model parameters shown in Supplementary Table 1 (available online). We compared the BCSS output when calibrated with the age-independent mammography threshold and doubling time from our previous study (15) (original BCSS), age-dependent mammography and doubling time from the current study (modified BCSS), and the calibration targets of SEER and BCSC, as shown in Figure 1, A–D. The cumulative distribution functions of tumor size at screen detection for women aged 30–49, 50–59, and 60–69 years are shown in Figure 1, A–C, respectively. The breast cancer incidence rate (age adjusted to the US standard population in 2000), vs year of diagnosis, is shown in Figure 1, D. As evident in Figure 1, A–D, the modified BCSS, which uses the age-dependent estimates of the mammography threshold and doubling times, more closely reproduced the calibration targets of SEER breast cancer incidence and BCSC tumor size distributions at screen detection. The age-specific estimates for mammography threshold were compared with the published age-specific estimates for mammography density (17,18), shown in Supplementary Table 2 (available online), and found to be linearly related as presented in the Supplementary Methods (available online).
Table 1.
Age-specific estimates for median mammography threshold (MT) and mean doubling time (DT)*
| Age, y† | Median MT, cm | Mean DT, d |
| <40 | 1.63 | 179 |
| 40–49 | 1.44 | 206 |
| 50–59 | 1.25 | 233 |
| 60–69 | 1.07 | 260 |
| ≥70 | 0.88 | 288 |
| 50–69 | 1.16 | 247 |
The cumulative distribution function for the MT is shown in Supplementary Figure 2 (available online) for women aged 40–49 vs 50–69 years.
Patients’ age at mammography screening in case of median MT and age at clinical diagnosis in case of mean DT.
Figure 1.

Calibration of Breast Cancer Screening Simulator (BCSS). Cumulative distribution function, CDF(d), of tumor size (diameter) at screen detection (d), for women aged A) 30–49 years, B) 50–59 years, and C) 60–69 years. The solid curve (labeled “modified BCSC”) corresponds to data obtained from the Breast Cancer Surveillance Consortium (BCSC); long dashed curve (labeled “modified BCSS”) corresponds to the modified BCSS that used age-specific median mammography thresholds (MTs) and mean doubling times (DTs); short dashed curve (labeled “original BCSS”) corresponds to the original BCSS that used non–age specific median MTs and mean DTs (15). D) Breast cancer incidence rate (per 100 000 women), age adjusted to US standard population in the year 2000. The solid curve (labeled “SEER”) corresponds to data obtained from the Surveillance, Epidemiology, and End Results (SEER). Patients with ductal carcinoma in situ alone were excluded from the analyses (A–D).
Relative Contributions of Mammography Threshold and Doubling Time on Screening Outcomes in Younger vs Older Women
To evaluate the impact of the mammography threshold and doubling time on the screening outcomes in younger women, we simulated the screening outcomes for the four hypothetical scenarios defined earlier in this study. The screening outcomes for scenarios 1–4, for both annual and biennial screening, are shown in Table 2. When we compared scenario 1 with no screening, annual vs biennial screening showed that screening sensitivity was 59% vs 42%, respectively; mean tumor size at diagnosis was reduced by 1.08 vs 0.46 cm, respectively; lifetime gain per woman screened from ages 40–49 years was 13.8 vs 9.3 days, respectively; reduction in breast cancer deaths among 40- to 49-year-old women was 21.2% vs 14.8%, respectively; reduction in breast cancer deaths among 50- to 69-year-old women was 12.2% vs 8.0%, respectively; and the reduction in breast cancer deaths among all women more than 40 years old was 2.7% vs 1.8%, respectively. In terms of absolute values, when we compared scenario 1 and scenario 4 for annual vs biennial screening, the screening sensitivity increased by 14% vs 15%, respectively; the mean tumor size decreased by 0.30 vs 0.23 cm, respectively; the lifetime gain per woman screened from ages 40–49 years was 4.4 vs 4.1 days, respectively; and the reduction in breast cancer deaths among 40- to 49-year-old women was 6.2% vs 6.0%, respectively, among 50- to 59-year-old women was 4.4% vs 4.0%, respectively, and among all women more than 40 years old was 0.9% for both annual and biennial screening.
Table 2.
Computed screening outcomes from none, annual, and biennial screening in women aged 40–49 years and annual screening in women aged 50–69 years*
| Screening scenarios at age 40–49 y† | Screening sensitivity, %, for age 40–49 y at diagnosis‡ | Mean tumor size, cm, for age 40–49 y at diagnosis | Lifetime gained, d, per woman screened at age 40–49 y | Breast cancer mortality reduction, %, relative to no screening in age group 40–49 y | ||
| Age 40–49 y at death | Age 50–69 y at death | Age >40 y at death | ||||
| No screening | — | 3.20 | — | — | — | — |
| Annual screening | ||||||
| Scenario 1 | 59 | 2.12 | 13.8 | 21.2 | 12.2 | 2.7 |
| Scenario 2 | 62 | 2.09 | 14.6 | 22.7 | 13.1 | 2.9 |
| Scenario 3 | 70 | 1.85 | 17.5 | 26.2 | 16.0 | 3.5 |
| Scenario 4 | 73 | 1.82 | 18.2 | 27.4 | 16.6 | 3.6 |
| Relative contributions of MT, DT, %§ | 79, 21 | 90, 10 | 84, 18 | 81, 25 | 86, 20 | 88, 22 |
| Biennial screening | ||||||
| Scenario 1 | 42 | 2.74 | 9.3 | 14.8 | 8.0 | 1.8 |
| Scenario 2 | 46 | 2.70 | 10.2 | 16.2 | 8.9 | 2.0 |
| Scenario 3 | 53 | 2.56 | 12.5 | 19.3 | 11.2 | 2.5 |
| Scenario 4 | 57 | 2.51 | 13.4 | 20.8 | 12.0 | 2.7 |
| Relative contributions of MT, DT, %§ | 73, 27 | 78, 17 | 78, 22 | 75, 23 | 80, 23 | 78, 22 |
Women aged 50–69 years underwent annual screening only. DT = doubling time; MT = mammography threshold.
In scenario 1, women aged 40–49 years were assigned their MT and DT; in scenario 2, women were assigned their MT but the mean DT of women aged 50–69 years; in scenario 3, women were assigned the median MT of women aged 50–69 years but their DT; and in scenario 4, women were assigned the median MT and mean DT of women aged 50–69 years.
Screening sensitivity for a specific age group is defined as the proportion of breast cancer patients who are screen detected in that age group among all breast cancer patients in that age group.
The relative effect of MT on a specific outcome is computed as the difference between scenario 3 and scenario 1, divided by the difference between scenario 4 and scenario 1; the relative effect of DT on a specific outcome is computed as the difference of that outcome between scenario 2 and scenario 1, divided by the difference of that outcome between scenario 4 and scenario 1. The relative contributions of MT and DT may not always add to 100% because of synergy between MT and DT for a given outcome.
Next, we quantified the relative contributions of the mammography threshold and doubling time on the poorer screening outcomes in younger women compared with older women (Table 2). For annual screening, the sensitivity for women aged 40–49 years showed a 11% increase in absolute value when the median mammography threshold for 40- to 49-year-old women was assumed to be that of 50- to 69-year-old women (scenario 1 vs scenario 3); the sensitivity showed a 3% increase in absolute value when the mean doubling time of 40- to 49-year-old women was assumed to be that of 50- to 69-year-old women (scenario 1 vs scenario 2); the sensitivity showed a 14% increase in absolute value when both the median mammography threshold and the mean doubling time of 40- to 49-year-old women were assumed to be that of 50- to 69-year-old women (scenario 1 vs scenario 4). Hence, changing the median mammography threshold accounted for 79% of the lowered sensitivity of scenario 1 vs scenario 4, whereas changing the mean doubling time accounted for only 21% of the decrease (Table 2). For biennial screening, the relative contribution of mammography threshold vs doubling time to the lowered sensitivity was 73% vs 27%, respectively. We found similar relative contributions of mammography threshold vs doubling time for other screening outcomes, namely mean detectable tumor size, lifetime gained, and breast cancer mortality reduction in women aged 40–49, 50–69, and more than 40 years (Table 2).
Sensitivity Analysis
Because of uncertainty in our age-specific estimates for the median mammography threshold and mean doubling time, we varied the age-specific model parameters for 40- to 49-year-old women across a broad range of values to evaluate the effect on screening sensitivity and overall breast cancer mortality reduction attributed to screening younger women. We defined overall breast cancer mortality reduction as the reduction in breast cancer deaths more than the age of 40 years. The results for annual and biennial screening in women aged 40–49 years, when women aged 50–69 years undergo annual screening, are illustrated in Figure 2. A decrease in median mammography threshold and increase in mean doubling time showed increased screening sensitivity (Figure 2, A and B) and overall breast cancer mortality reduction (Figure 2, C and D). For a given mean doubling time, the sensitivity and overall breast cancer mortality reduction were fairly linear with mammography threshold (r2 > .94, where r2 was computed as the Pearson product moment correlation coefficient) (Figure 2, A–D). Every 2-mm decrement in the median mammography threshold increased the sensitivity for annual vs biennial screening by 3%–9.5% vs 1.7%–9.8%, respectively, and reduced the overall breast cancer mortality by approximately 0.2%–0.7% vs 0.1%–0.6%, respectively. Interestingly, neither sensitivity nor overall breast cancer mortality was linear with doubling time. For a given median mammography threshold, as the mean doubling time increased, there was a decrease in percent change in sensitivity and overall breast cancer mortality. At a mammography threshold of 0.8 cm (vs 2.0 cm), the maximum sensitivity was 89% (vs 46%) for annual screening (Figure 2, A) and 79% (vs 33%) for biennial screening (Figure 2, B); the maximum breast cancer mortality reduction was 4.8% (vs 2%) for annual screening (Figure 2, C) and 4% (vs 1.3%) for biennial screening (Figure 2, D).
Figure 2.

Effect of median mammography threshold (MT) and mean doubling time (DT) on the A) sensitivity of annual screening, B) sensitivity of biennial screening, C) overall breast cancer mortality reduction from annual screening, and D) overall breast cancer mortality reduction from biennial screening. Screening interval was annual or biennial for younger women (aged 40–49 years) and annual for older women (aged 50–69 years). Median MT varied from 0.8 to 2.0 cm, and mean DT varied from 30 to 335 days. Linearity of sensitivity with median MT was tested by computing r2 separately for each mean DT in (A) and (B); similarly, the linearity of overall breast cancer mortality reduction with the median MT was computed in (C) and (D). All r2 > .94, r = Pearson product moment correlation coefficient.
As an extension to the sensitivity analysis, we analyzed the joint relationship between screening sensitivity and overall breast cancer mortality reduction as a function of median mammography threshold (range: 0.8–2 cm) and mean doubling time (range: 30–335 days) for annual and biennial screening vs no screening in women aged 40–49 years, as shown in Figure 3, A and B. Interestingly, the overall breast cancer mortality reduction increased linearly as the sensitivity increased (r2 > .98). Again, we observed a greater effect of mammography threshold compared with doubling time, jointly on sensitivity and overall breast cancer mortality reduction. In annual screening (Figure 3, A), to achieve a sensitivity of 80% or greater and an overall breast cancer mortality reduction greater than 4%, the median mammography threshold had to be 1.0 cm or less; at 1.0 cm median mammography threshold, this was achieved in women whose tumors were moderately slow growing (doubling time ≥243 days); at 0.8 cm median mammography threshold, this was achieved in women whose tumors were faster growing (doubling time ≥152 days). Findings were similar for biennial screening (Figure 3, B).
Figure 3.

Scatter plots showing overall breast cancer mortality reduction vs screening sensitivity in women aged 40–49 years. A) Annual screening in women aged 40–49 years, and B) biennial screening in women aged 40–49 years. Women aged 50–69 years underwent annual screening (A and B). For a median mammography threshold (MT) of 0.8 cm, the mean doubling time (DT) is shown in days (30–365); the sequential ordering of mean DT is the same for all values of the median MT. The linearity between overall breast cancer mortality reduction and sensitivity is tested across all paired values of median MT and mean DT, producing an overall r2 = .94, r = Pearson product moment correlation coefficient.
Finally, we analyzed the joint relationship between the sensitivity gain and overall breast cancer mortality reduction when comparing annual with biennial screening in women aged 40–49 years, as a function of mammography threshold and doubling time, as shown in Figure 4. We defined the sensitivity gain as the difference in sensitivity between annual and biennial screening, divided by the sensitivity of annual screening. The sensitivity gain increased monotonically as the mean doubling time decreased or the median mammography threshold increased. Breast cancer mortality reduction increased monotonically as the mammography threshold decreased, but it was not monotonic with respect to the doubling time. The largest reduction in overall breast cancer mortality (1%–1.2%) did not correspond to the greatest sensitivity gain (≥80%); instead, it was achieved at a sensitivity gain of 20%–50%. Again, we observed a greater impact of mammography threshold than doubling time on the reduction in overall breast cancer mortality. A reduction in breast cancer mortality greater than 0.9% was achieved at a mammography threshold of 1.4 cm or lower. When the median mammography threshold was 1.6 cm or larger, none of the mean doubling times evaluated (30–335 days) showed a reduction of greater than 0.9% in overall breast cancer mortality.
Figure 4.

Scatter plot showing overall breast cancer mortality reduction vs sensitivity gain in women aged 40–49 years when comparing annual vs biennial screening for women aged 40–49 years with annual screening for women aged 50–69 years. For a mammography threshold (MT) of 2 cm, the mean doubling time is shown in days (30–365); the sequential ordering of mean doubling time is the same for all values of the median MT.
Discussion
This model-based analysis of screening showed that mammography threshold and doubling time varied with age. This analysis also showed that age-specific differences in the mammographic threshold contributed more than the age-specific differences in doubling time to poorer outcomes associated with screening women aged 40–49 years compared with women aged 50–69 years. These findings are consistent with the empiric findings of Buist et al. (14) regarding the effect of mammography breast density and tumor growth on screening sensitivity. In addition, we showed that these relative contributions extended to other screening outcomes, including mean detectable tumor size, lifetime gained, and breast cancer mortality.
In a sensitivity analysis, we varied the mammography threshold and doubling time across a broad range of values and analyzed their effect on the joint relationship between sensitivity and breast cancer mortality. On doing so, when comparing annual with biennial screening, we found that the largest sensitivity gain was associated with the fastest growing tumors but these tumors were not associated with the largest mortality reduction. Because fast growing tumors are more likely to be screen detected close to the time that they would have been symptomatically detected in the absence of screening, early detection of such tumors produces a small effect on breast cancer mortality reduction. Therefore, when comparing annual with biennial screening, a high sensitivity gain should not be used to infer a high reduction in breast cancer mortality; similarly, a moderate or low sensitivity gain should not be used to infer a low reduction in breast cancer mortality. We found that the greatest reduction in breast cancer mortality corresponded to moderate sensitivity gains and was achieved at low mammography thresholds and moderately fast growing tumors, further highlighting the greater impact of mammography threshold compared with tumor growth rate on the reduction in breast cancer mortality attributed to screening.
Our results underscore the importance of continued efforts to improve technologies for early detection of breast cancer in younger women, particularly in women with dense breast tissue. Digital mammography and ultrasound are two technologies that recently demonstrated higher detection rates in dense breast tissue (19–21). In the Digital Mammographic Imaging Screening Trial (DMIST), digital mammography performed better than film mammography for women less than 50 years old with dense breasts (19). The sensitivity of annual screening with digital mammography in women less than 50 years old was reported to be 0.68 (95% confidence interval = 0.56 to 0.77) (20); the point estimate of 0.68 is close to our estimated sensitivity of 0.7 in scenario 3. This indicates that digital mammography in younger women is performing as well as conventional mammography performs in older women for invasive disease; although this comparison is not completely accurate, because unlike our study, DMIST included ductal carcinoma in situ.
In the American College of Radiology Imaging Network National Breast Ultrasound Trial (ACRIN-6666), addition of a single screening ultrasound examination to a screening mammogram increased the detectability of breast cancer, compared with mammography alone, among women who were at increased risk of breast cancer and also had dense breast tissue (21). However, although the supplemental ultrasound screening uncovers more breast cancer, it also substantially increases the risk of a false-positive finding and unnecessary biopsy. Hence, ACRIN-6666 and DMIST trials highlight a key aspect that was not considered in this analysis—an increase in sensitivity may be accompanied by a decrease in specificity and an increase in costs. When evaluating a new screening technology to an existing one, the benefits are often compared with the harms and cost. A recent cost-effectiveness analysis of DMIST found that digital mammographic screening, compared with film-based screening, results in sufficient health gains in younger women to warrant its increased cost (20).
This study on the use of a computer simulation model to analyze screening mammography outcomes has a few limitations. The findings depend on estimated age-specific differences in mammography threshold and doubling time, but admittedly, these estimates are subject to biases. We assumed that missing BCSC data on screen-detected tumor sizes were randomly distributed. Also, when using the BCSC data, we defined a cancer as screen detected if the diagnosis was made within 4 months of the last screening mammography, but alternative definitions could vary our estimates. Despite these limitations, our age-specific estimates of doubling times are similar to estimates of doubling times in other studies (22–24). A further limitation of our analysis is that we did not consider the possibility that low mammographic tumor detectability, which we used as a surrogate for high breast density, could be considered a breast cancer risk factor in itself (25,26) and may even be associated with a specific subtype of breast cancer. To incorporate these aspects, more research is needed to not only establish a better relationship between mammographic breast density and breast cancer risk but also understand the differences in the tumor characteristics in dense vs nondense breast tissue.
Supplementary Data
Supplementary data can be found at http://www.jnci.oxfordjournals.org/.
Funding
National Institutes of Health (U01 CA088248 to S.K.P., T32 CA09695 to G.M.G.). Data on screen-detected tumor sizes that were used for model calibration were collected with the support of a National Cancer Institute-funded BCSC cooperative agreement (U01CA63740 [Karla M. Kerlikowske], U01CA86076 [Diana L. Miglioretti], U01CA86082 [Tracy Onega], U01CA63736 [Gary Cutter], U01CA70013 [Berta M. Geller], U01CA69976 [Robert D. Rosenberg], U01CA63731 [Diana S. M. Buist], U01CA70040 [Bonnie C. Yankaskas]). The collection of these BCSC data was also supported in part by several state public health departments and cancer registries throughout the United States. For a full description of the BCSC sources, please visit http://breastscreening.cancer.gov/work/acknowledgement.html.
Supplementary Material
Footnotes
We thank the BCSC investigators, participating mammography facilities, and radiologists for the data they have provided for this study. A list of the BCSC investigators and procedures for requesting BCSC data for research purposes are provided at http://breastscreening.cancer.gov/.
References
- 1.Nystrom L, Andersson I, Bjurstam N, Frisell J, Nordenskjold B, Rutqvist LE. Long-term effects of mammography screening: updated overview of the Swedish randomised trials. Lancet. 2002;359(9310):909–919. doi: 10.1016/S0140-6736(02)08020-0. [DOI] [PubMed] [Google Scholar]
- 2.Miller AB, To T, Baines CJ, Wall C. The Canadian National Breast Screening Study-2: 13-year results of a randomized trial in women aged 50-59 years. J Natl Cancer Inst. 2000;92(18):1490–1499. doi: 10.1093/jnci/92.18.1490. [DOI] [PubMed] [Google Scholar]
- 3.Alexander FE, Anderson TJ, Brown HK, et al. 14 years of follow-up from the Edinburgh randomised trial of breast-cancer screening. Lancet. 1999;353(9168):1903–1908. doi: 10.1016/s0140-6736(98)07413-3. [DOI] [PubMed] [Google Scholar]
- 4.Shapiro S, Venet W, Strax P, Venet L. Current results of the breast cancer screening randomized trial: the Health Insurance Plan (HIP) of greater New York study. In: Day NE, Miller AB, editors. Screening for Breast Cancer. Toronto, Ontario, Canada: Hans Huber; 1988. pp. 3–15. [Google Scholar]
- 5.Humphrey LL, Helfand M, Chan BK, Woolf SH. Breast cancer screening: a summary of the evidence for the U.S. Preventive Services Task Force. Ann Intern Med. 2002;137(5, pt 1):347–360. doi: 10.7326/0003-4819-137-5_part_1-200209030-00012. [DOI] [PubMed] [Google Scholar]
- 6.Tabar L, Vitak B, Chen HH, et al. The Swedish Two-County Trial twenty years later: updated mortality results and new insights from long-term follow-up. Radiol Clin North Am. 2000;38(4):625–651. doi: 10.1016/s0033-8389(05)70191-3. [DOI] [PubMed] [Google Scholar]
- 7.Tabar L, Fagerberg G, Chen HH, et al. Efficacy of breast cancer screening by age: new results from the Swedish Two-County Trial. Cancer. 1995;75(10):2507–2517. doi: 10.1002/1097-0142(19950515)75:10<2507::aid-cncr2820751017>3.0.co;2-h. [DOI] [PubMed] [Google Scholar]
- 8.Shapiro S. Periodic screening for breast cancer: the HIP Randomized Controlled Trial. Health Insurance Plan. J Natl Cancer Inst Monogr. 1997;22:27–30. doi: 10.1093/jncimono/1997.22.27. [DOI] [PubMed] [Google Scholar]
- 9.Miller AB, To T, Baines CJ, Wall C. The Canadian National Breast Screening Study—I, breast cancer mortality after 11-16 years of follow-up in women age 40-49. Ann Intern Med. 2002;137(5, pt 1):305–312. doi: 10.7326/0003-4819-137-5_part_1-200209030-00005. [DOI] [PubMed] [Google Scholar]
- 10.American Cancer Society. Breast Cancer Facts and Figures 2003-2004. Atlanta, GA: American Cancer Society; https://www.cancer.org/acs/groups/content/@nho/documents/document/caff2003brfpwsecuredpdf.pdf. Accessed July 28, 2008. [Google Scholar]
- 11.Carney P, Miglioretti DL, Yankaskas BC, et al. Individual and combined effects of age, breast density and hormone replacement therapy use on the accuracy of mammography. Ann Intern Med. 2003;138(138):168–175. doi: 10.7326/0003-4819-138-3-200302040-00008. [DOI] [PubMed] [Google Scholar]
- 12.Gilliland FD, Joste N, Stauber PM, et al. Biologic characteristics of interval and screen-detected breast cancers. J Natl Cancer Inst. 2000;92(2):743–749. doi: 10.1093/jnci/92.9.743. [DOI] [PubMed] [Google Scholar]
- 13.Mandelson MT, Oestreicher N, Porter PL, et al. Breast density as a predictor of mammographic detection: comparison of interval- and screen-detected cancers. J Natl Cancer Inst. 2000;92(13):1081–1087. doi: 10.1093/jnci/92.13.1081. [DOI] [PubMed] [Google Scholar]
- 14.Buist DSM, Porter PL, Lehman C, Taplin S, White E. Factors contributing to mammography failure in women aged 40-49 years. J Natl Cancer Inst. 2004;96(19):1432–1440. doi: 10.1093/jnci/djh269. [DOI] [PubMed] [Google Scholar]
- 15.Plevritis SK, Sigal BM, Salzman P, Rosenberg J, Glynn P. Chapter 12: a stochastic simulation model of U.S. breast cancer mortality trends from 1975 to 2000. J Natl Cancer Inst Monogr. 2006;36:86–95. doi: 10.1093/jncimonographs/lgj012. [DOI] [PubMed] [Google Scholar]
- 16.Nelder JA, Mead R. A simplex method for function minimization. Comput J. 1965;7(4):308–313. [Google Scholar]
- 17.Vachon CM, et al. Longitudinal trends in mammographic percent density and breast cancer risk. Cancer Epi Biomarkers Prev. 2007;16(5):921–928. doi: 10.1158/1055-9965.EPI-06-1047. [DOI] [PubMed] [Google Scholar]
- 18.Kerlikowske K, et al. Longitudinal measurement of clinical mammographic breast density to improve estimation of breast cancer risk. J Natl Cancer Inst. 2007;99(5):386–395. doi: 10.1093/jnci/djk066. [DOI] [PubMed] [Google Scholar]
- 19.Pisano ED, Gatsonis C, Hendrick E, et al. Digital Mammographic Imaging Screening Trial (DMIST) Investigators Group. Diagnostic performance of digital versus film mammography for breast-cancer screening. N Engl J Med. 2005;353(17):1773–1783. doi: 10.1056/NEJMoa052911. [DOI] [PubMed] [Google Scholar]
- 20.Tosteson AN, Stout NK, Fryback DG, et al. Cost-effectiveness of digital mammography breast cancer screening. Ann Intern Med. 2008;148(1):1–10. doi: 10.7326/0003-4819-148-1-200801010-00002. [DOI] [PMC free article] [PubMed] [Google Scholar]
- 21.Berg WA, Blume JD, Cormack JB, et al. ACRIN 6666 Investigators. Combined screening with ultrasound and mammography vs mammography alone in women at elevated risk of breast cancer. JAMA. 2008;299(18):2151–2163. doi: 10.1001/jama.299.18.2151. [DOI] [PMC free article] [PubMed] [Google Scholar]
- 22.Peer PG, van Dijck JA, Hendriks JH, Holland R, Verbeek AL. Age-dependent growth rate of primary breast cancer. Cancer. 1993;71(11):3547–3551. doi: 10.1002/1097-0142(19930601)71:11<3547::aid-cncr2820711114>3.0.co;2-c. [DOI] [PubMed] [Google Scholar]
- 23.Spratt JS, Meyer JS, Spratt JA. Rates of growth of human neoplasms: Part II. J Surg Oncol. 1996;61(1):68–83. doi: 10.1002/1096-9098(199601)61:1<68::aid-jso2930610102>3.0.co;2-e. [DOI] [PubMed] [Google Scholar]
- 24.Tan SYGL, van Oortmarssen GJ, de Koning HJ, Boer R, Habbema JDF. Chapter 9: the MISCAN-Fadia continuous tumor growth model for breast cancer. J Natl Cancer Inst Monogr. 2006;36:56–65. doi: 10.1093/jncimonographs/lgj009. [DOI] [PubMed] [Google Scholar]
- 25.Byrne C, Schairer C, Wolfe J, et al. Mammographic features and breast cancer risk: effects with time, age, and menopause status. J Natl Cancer Inst. 1995;87(21):1622–1629. doi: 10.1093/jnci/87.21.1622. [DOI] [PubMed] [Google Scholar]
- 26.Boyd NF, Rommens JM, Vogt K, et al. Mammographic breast density as an intermediate phenotype for breast cancer. Lancet Oncol. 2005;6(10):798–808. doi: 10.1016/S1470-2045(05)70390-9. [DOI] [PubMed] [Google Scholar]
Associated Data
This section collects any data citations, data availability statements, or supplementary materials included in this article.