

Abstract
Biofilms are communities of bacteria whose formation on surfaces requires a large portion of the bacteria’s transcriptional network. To identify environmental conditions and transcriptional regulators that contribute to sensing these conditions, we used a high-throughput approach to monitor biofilm biomass produced by an isogenic set of Escherichia coli K-12 strains grown under combinations of environmental conditions. Of the environmental combinationsd, growth in tryptic soy broth at 37°C supported the most biofilm production. To analyze the complex relationships between the diverse cell surface organelles, transcriptional regulators, and metabolic enzymes represented by the tested mutant set, we used a novel vector-item pattern-mining algorithm. The algorithm related biofilm amounts to the functional annotations of each mutated protein. The pattern with the best statistical significance was the gene ontology ‘pyruvate catabolic process,’ which is associated with enzymes of acetate metabolism. Phenotype microarray experiments illustrated that carbon sources that are metabolized to acetyl-coenzyme A, acetyl phosphate, and acetate are particularly supportive of biofilm formation. Scanning electron microscopy revealed structural differences between mutants that lack acetate metabolism enzymes and their parent and confirmed the quantitative differences. We conclude that acetate metabolism functions as a metabolic sensor, transmitting changes in environmental conditions to biofilm biomass and structure.
Keywords: biofilm formation, environmental conditions, genetic factors, high-throughput experimentation, vector-item pattern-mining algorithm, acetate metabolism, two-component signaling
Introduction
Bacterial biofilms are slime layers of bacteria that form on liquid/solid and air/liquid interfaces. They are difficult to eradicate by conventional techniques and cause problems in many natural, environmental, clinical, and bioindustrial settings (Costerton et al. 1999; Sung et al. 2006). Early biofilm research was aimed at the identification of biofilm-specific pathways as a response to changes in the environment. This led to a first model of biofilm formation, the developmental model. As part of this model, it was postulated that the formation of biofilms proceeds in several stages, each characterized by a specific cell surface organelle (Sauer et al. 2002). Before the biofilm can form, bacteria must attach to the surface and/or to each other. Attachment is mediated by cell surface organelles, such as flagella and type I fimbriae, which are characteristic of the first and second stages of biofilm formation, reversible and irreversible attachment. During the third stage or maturation phase of biofilm development, the attached cells produce an extracellular matrix, e.g. colanic acid. This matrix enables the bacteria to form three-dimensional structures, while inhibiting chemicals from penetrating the biofilm. The resistance of bacterial biofilms to commonly employed disinfection and removal protocols is due in part to this extracellular matrix. During this maturation phase, flagella and fimbriae are generally not present. However, for a later stage of development, flagella are synthesized to enable individual bacteria to swim away from the biofilm.
According to a more recently proposed biofilm model (Monds and O’Toole 2009), individual bacteria respond to their own specific and local environment. This model does not hold onto the idea anymore that the response to an environmental signal follows a biofilm-specific regulatory pathway. Instead, it proposes that the change in biofilm structure and amount may be due to central metabolic changes due to the modified environment. Our current study addressed aspects of both models. We used a high-throughput design to test the effect of multiple combinations of environmental conditions in a set of isogenic mutants of E. coli K-12. Mutated proteins included components of those cell surface organelles that are associated with phases of biofilm formation that the developmental model postulates (Sauer et al. 2002), as well as regulatory proteins that are part of the general transcriptional network of the bacteria, a portion of which was summarized in a review article (Prüβ et al. 2006).
The experimental design for this study followed the example of a computational study, in which a novel Vector-Item Pattern-mining (VIP) algorithm was used to determine relationships between published gene expression data and protein function information of mutated proteins (Denton et al. 2008). The vector-item pattern-mining concept allows a direct search for sets of relationships (patterns) between multiple experiments (vector data) and membership in a specific classification (item data). In the above example, the vector data were gene expression data, taken from a microarray study that had compared wild-type E. coli K-12 to mutants in all two-component systems (2CSTS) (Oshima et al. 2002). Item data were the presence or absence of specific protein functions, presented as gene ontologies (GO) and taken from previous work (Besemann et al. 2006). The VIP algorithm searched for patterns of frequently occurring combinations of vector and item data (gene expression and protein function). It then calculated the statistical significance of the relationship between the two types of data, finding that the GOs ‘response to desiccation’ and ‘biopolymer metabolism’ yielded patterns of statistical significance throughout the gene expression experiments. Both GOs contained genes within the wca operon, which is responsible for the formation of the extracellular matrix molecule colanic acid that is part of the mature E. coli biofilm. VIP also determined that the 2CSTSs BasS/BasR, BarA/UvrY, NtrB/NtrC, YpdA/YpdB, and DcuS/DcuR contributed to the significant patterns. As part of the computational study, some of these 2CSTS were experimentally confirmed as being involved in biofilm formation (Denton et al. 2008).
2CSTSs are a family of signal transduction proteins (for a review on two-component signaling, see Gao and Stock 2009), each consisting of a sensor kinase and a response regulator. The sensor kinase receives a signal from the environment, auto-phosphorylates on a conserved histidine, and donates the phosphate to a conserved aspartate in the receiver domain of the response regulator. Alternatively, the activated acetate intermediate acetyl phosphate can serve as a phosphodonor for the phosphorylation of the response regulator (for a review, see Wolfe, 2010). In either case, the phosphorylation status of the response regulator determines its transcriptional activity. Other global regulators that affect biofilm formation include the cAMP receptor protein CRP (Zheng et al. 2004), the histone-like protein H-NS (Bertin et al. 1994; Bertin et al. 2001; Hommais et al. 2001), and the diguanylate cyclases and phosphodiesterases that catalyze the synthesis and degradation of cyclic di-GMP (Wolfe and Visick 2010).
Our current study includes several of such 2CSTSs, some of which were part of the reviewed network of transcriptional regulation (Prüβ et al. 2006), others were hypothesized by the previous computational study (Denton et al. 2008). We used to a modified version (VIP2) of the original VIP algorithm to relate information about the mutated proteins to the environmental conditions, under which biofilm formation by the mutants was determined. As the major outcome of this study, acetate metabolism was identified as an important factor in determining biofilm amounts and structures in response to environmental conditions, such as nutrition or temperature. Quantitative information from the high-throughput experiment was confirmed with qualitative observations obtained by scanning electron microscopy.
Materials and methods
Bacterial strains and plasmids
All bacterial strains used in this study were derivatives of the E. coli K-12 strain AJW678 and are listed in Table 1. Strain AJW678 forms robust biofilms and is wild-type for acetate metabolism, the biogenesis of type I fimbriae and flagella, the biosynthesis of colanic acid, and each of the regulators tested (Kumari et al. 2000). Flagella-dependent motility was evaluated on tryptone swarm plates (Wolfe and Berg 1989). The promoter region of flhD was tested for the presence of IS elements, using PCR as described (Barker et al. 2004). Mutations were transduced into AJW678 using P1 phage (Silhavy et al. 1984).
Table 1.
Bacterial strains used for this study
| # | Strains | Relevant genotypes | Reference |
|---|---|---|---|
| 1 | AJW678 | thi-1 thr-1(am) leuB6 metF159(Am) rpsL136 ΔlaxX74 | (Kumari et al. 2000) |
| 2 | AJW2145 | AJW678 fliA::Tn5 | (Wolfe et al. 2003) |
| 3 | BP1094 | AJW678 flhD::kn | This study |
| 4 | AJW2063 | AJW678 ΔfimA::kn | (Wolfe et al. 2003) |
| 5 | AJW2061 | AJW678 fimH::kn | (Wolfe et al. 2003) |
| 6 | AJW2070 | AJW678 ΔfimA::kn ackA::TnphoA’-2 | (Wolfe et al. 2003) |
| 7 | AJW2064 | AJW678 ΔfimA::kn Δ(ackA pta hisJ hisP dhu) zej223-Tn10 | (Wolfe et al. 2003) |
| 8 | AJW2069 | AJW678 fimH::kn ackA::TnphoA’-2 | (Wolfe et al. 2003) |
| 9 | AJW2062 | AJW678 fimH::kn Δ(ackA pta hisJ hisP dhu) zej223-Tn10 | (Wolfe et al. 2003) |
| 10 | AJW1939 | AJW678 ackA::kn | (Kumari et al. 2000) |
| 11 | AJW2013 | AJW678 Δ(ackA pta hisJ hisP dhu) zej223-Tn10 | (Wolfe et al. 2003) |
| 12 | AJW2050 | AJW678 ompR::Tn10 | Alan J. Wolfe |
| 13 | AJW2143 | AJW678 rcsB::Tn5 | (Fredericks et al. 2006) |
| 14 | AJW2144 | AJW678 rcsC::Tn5 | (Fredericks et al. 2006) |
| 15 | AJW2372 | AJW678 rcsD::cm | Alan J. Wolfe |
| 16 | AJW2147 | AJW678 rcsB::Tn5 ackA::TnphoA’-2 | (Fredericks et al. 2006) |
| 17 | AJW2151 | AJW678 rcsB::Tn5 Δ(ackA pta hisJ hisP dhu) zej223-Tn10 | (Fredericks et al. 2006) |
| 18 | BP1068 | AJW678 pT7-7 flhDC | (Liu and Matsumura 1994) |
| 19 | BP1059 | AJW2144 pT7-7 flhDC | (Liu and Matsumura 1994) |
| BP1286 | AJW678 dcuR::kn | CGSC, this study | |
| BP1318 | AJW678 ackA::TnphoA’-2 dcuR::kn | This study | |
| BP1291 | AJW678 ackA::kn ompR::Tn10 | This study |
The Tn5 transposon confers resistance towards kanamycin, the Tn10 transposon towards tetracycline, kn is an insertion of the kanamycin resistance gene, cm of the chloramphenicol resistance gene. Δ constitutes a deletion of the respective gene. # 1–19 are running numbers for the bacterial strains that were used for the high-throughput quantitative biofilm experiment. These are designated ‘attributes’ for the VIP2 algorithm (analysis 1). Running numbers in this Table are identical to Figs. 2A and B. Strains lacking the running number were used for follow up experiments. CGSC, Coli Genetic Stock Center.
Bacteria were plated onto Luria Bertani plates (LB; 1% tryptone, 0.5% yeast extract, 0.5% NaCl, 1.5% agar) and incubated overnight at 34°C. Strains containing plasmid pXL27 (pT7-7 flhD), which expresses FlhD/FlhC constitutively under the control of the T7-7 promoter, were incubated on plates containing penicillin (100 μg/ml) to avoid plasmid loss. Liquid overnight cultures were prepared in the medium and at the temperature of the subsequent experiment.
Environmental conditions
The environmental conditions examined in this study were temperature (27, 29.5, 32, 34.5, and 37°C) and nutrition (tryptone broth, TB; Luria Bertani broth, LB; tryptic soy broth, TSB). TB consisted of 1% tryptone and 0.5% NaCl, LB contained an additional 0.5% yeast extract. TSB consisted of 1.7% pancreatic digest of casein, 0.3% papaic digest of soybean, 0.25% D-glucose, 0.5% NaCl, and 0.25% K2HPO4. Also tested were the size of the bacterial inoculum (1:100, 1:30, 1:20, and 1:10 from overnight culture) and duration of incubation (either 24 or 48 h post-inoculation).
A D-Optimal response surface design (Design-Expert version 6.0.7, Stat-Ease Inc., Minneapolis MN and JMP 6, SAS Institute Inc., Cary NC) (Myers and Montgomery 1995) was used to reduce the number of combinations of conditions and provide for an experimental plan that is adequate to identify the important factors and conditions for biofilm formation (Table 2). The D-Optimal design algorithm minimizes the number of experiments, while preserving the critical design points to select and model the factors that affect a given response. For example, to test all possible combinations of this experimental design space would require 120 combinations of environmental conditions for each of the 19 bacterial strains or a total of 6,840 experiments (each performed in triplicate). The design space tested comprises 22 combinations of environmental conditions for each bacterial strain or 1,254 experiments (each performed in triplicate). Thus, D-Optimal design reduced the total number of experiments by a factor of 5.45. After the initial experiments demonstrated that temperature and nutrition were the most important environmental factors in biofilm development, three additional combinations of environmental conditions were added, bringing the total combinations of conditions tested to 25.
Table 2.
Combinations of conditions used for this study
| # | Temperature (°C) | Medium | Dilution | Time | ||||||||||
|---|---|---|---|---|---|---|---|---|---|---|---|---|---|---|
| 27 | 29.5 | 32 | 34.5 | 37 | TB | LB | TSB | 1:100 | 1:30 | 1:20 | 1:10 | 24 | 48 | |
| 1 | 0 | 0 | 0 | 0 | 1 | 0 | 1 | 0 | 0 | 0 | 0 | 1 | 1 | 0 |
| 2 | 0 | 0 | 0 | 0 | 1 | 1 | 0 | 0 | 1 | 0 | 0 | 0 | 1 | 0 |
| 3 | 1 | 0 | 0 | 0 | 0 | 0 | 0 | 1 | 0 | 0 | 0 | 1 | 1 | 0 |
| 4 | 0 | 0 | 0 | 0 | 1 | 0 | 1 | 0 | 0 | 0 | 1 | 0 | 0 | 1 |
| 5 | 1 | 0 | 0 | 0 | 0 | 0 | 0 | 1 | 0 | 0 | 1 | 0 | 0 | 1 |
| 6 | 0 | 0 | 0 | 0 | 1 | 1 | 0 | 0 | 1 | 0 | 0 | 0 | 0 | 1 |
| 7 | 0 | 0 | 0 | 0 | 1 | 0 | 0 | 1 | 0 | 0 | 0 | 1 | 0 | 1 |
| 8 | 0 | 0 | 0 | 0 | 1 | 0 | 0 | 1 | 0 | 0 | 1 | 0 | 1 | 0 |
| 9 | 0 | 0 | 0 | 0 | 1 | 1 | 0 | 0 | 0 | 0 | 0 | 1 | 0 | 1 |
| 10 | 0 | 0 | 1 | 0 | 0 | 0 | 1 | 0 | 0 | 1 | 0 | 0 | 0 | 1 |
| 11 | 1 | 0 | 0 | 0 | 0 | 0 | 1 | 0 | 0 | 0 | 1 | 0 | 1 | 0 |
| 12 | 0 | 0 | 1 | 0 | 0 | 0 | 1 | 0 | 1 | 0 | 0 | 0 | 1 | 0 |
| 13 | 0 | 1 | 0 | 0 | 0 | 1 | 0 | 0 | 0 | 1 | 0 | 0 | 1 | 0 |
| 14 | 0 | 1 | 0 | 0 | 0 | 1 | 0 | 0 | 0 | 0 | 1 | 0 | 0 | 1 |
| 15 | 0 | 0 | 1 | 0 | 0 | 1 | 0 | 0 | 0 | 0 | 0 | 1 | 1 | 0 |
| 16 | 0 | 0 | 1 | 0 | 0 | 1 | 0 | 0 | 1 | 0 | 0 | 0 | 0 | 1 |
| 17 | 1 | 0 | 0 | 0 | 0 | 0 | 0 | 1 | 1 | 0 | 0 | 0 | 1 | 0 |
| 18 | 1 | 0 | 0 | 0 | 0 | 0 | 1 | 0 | 1 | 0 | 0 | 0 | 0 | 1 |
| 19 | 1 | 0 | 0 | 0 | 0 | 1 | 0 | 0 | 0 | 0 | 0 | 1 | 0 | 1 |
| 20 | 0 | 0 | 0 | 1 | 0 | 1 | 0 | 0 | 0 | 0 | 1 | 0 | 1 | 0 |
| 21 | 0 | 0 | 1 | 0 | 0 | 0 | 0 | 1 | 0 | 1 | 0 | 0 | 1 | 0 |
| 22 | 1 | 0 | 0 | 0 | 0 | 0 | 1 | 0 | 0 | 0 | 0 | 1 | 0 | 1 |
| 23 | 0 | 0 | 1 | 0 | 0 | 0 | 1 | 0 | 1 | 0 | 0 | 0 | 1 | 0 |
| 24 | 0 | 0 | 0 | 0 | 1 | 0 | 0 | 1 | 1 | 0 | 0 | 0 | 0 | 1 |
| 25 | 0 | 0 | 0 | 0 | 1 | 0 | 0 | 1 | 1 | 0 | 0 | 0 | 1 | 0 |
Each combination of environmental conditions is characterized by one temperature, one growth medium, one dilution from the overnight culture, and one incubation time. The D-Optimal response surface design algorithm was used to select combinations 1 through 22. Combinations 23 to 25 were added after it was observed that temperature and nutrition were the most important environmental factors. # is the running number for the combinations of environmental conditions. These are designated ‘attributes’ for the VIP2 algorithm (GO analysis). Running numbers in this Table are identical to Figs. 2C and D.
Functional annotation data for each mutated protein were provided as gene ontologies (GO) and were taken from the EcoCyc database (http:www.ecocyc.org). Supplemental Table 1 indicates the absence or presence of a specific GO for each of the proteins that were knocked out in the mutants.
High-throughput quantitative biofilm experiment
E. coli K-12 biofilms were cultured in 96 well polystyrene plates by diluting overnight cultures in 100 μl of the designated nutrient growth medium in each well. Ten bacterial strains were processed on each plate in six replicates, leaving the outside wells blank to avoid variation in apparent biofilm amounts due to evaporation of the growth medium. These wells were filled with sterile media. Plates were sealed in Ziploc bags and placed in a humidified chamber at the appropriate temperature. Experiments were performed in triplicate (to a total of 18 data points per strain and condition).
To determine the amount of biofilms formed in the wells of the plate, we used the established crystal violet (CV) colorimetric assay (O’Toole et al. 1999; Pratt and Kolter 1998; Stafslien et al. 2006; Stafslien et al. 2007). Since biofilms were observed at both air-liquid and liquid-solid interfaces, efforts were made to preserve both biofilm types in the measurements. The media from each well was carefully removed using a multichannel pipette, layering the air-liquid biofilm on top of the liquid-solid biofilm. The wells were washed twice with 1 × phosphate buffered saline (PBS; 137 mM NaCl, 2.7 mM KCl, 10 mM phosphate buffer, pH 7.4–7.6) and stained with 100 μl of 0.1% crystal violet in H20 for 15 min. The CV solution was carefully removed with the multichannel pipette and the biofilms were washed twice with PBS. To elute bound CV, 100 μl of an 80% ethanol/20% acetone solution were added to each well and incubated for 10 min. The optical density at 600 nm was determined from 1:10 dilutions in an EL808 Ultra Microplate Reader from Bio-Tek Instruments Inc. (Winooski VT). Data were processed with KC4 3.01 Rev 7 (Bio-Tek) and imported into an Excel Spreadsheet. Data were analyzed as optical densities (absolute biofilm amounts) and normalized to the AJW678 parent strain (relative biofilm amounts). Data were expressed as the mean value across all 18 data points per strain and combination of conditions (3 experiments of 6 replicates).
Vector-item pattern-mining algorithm (VIP2)
An algorithm (VIP) for determining the statistical significance of relationships between multiple continuous and binary data (Denton et al. 2008) was adapted for quantitative biofilm and functional annotation data (VIP2). Analogous to previous studies that related gene expression data to functional annotations, the VIP2 algorithm was based on the vector-item pattern-mining concept (Denton et al. 2008; Denton and Wu 2009). The objective of vector-item pattern-mining is to test for relationships between multiple continuous (vector) and binary (item) attributes that may be considered either individually or as sets. Vector-item pattern-mining differs from biclustering followed by gene set enrichment analysis (Shamir et al. 2005) in that it accounts for multiple experiments, or vectors, at a fundamental level and in one single step. In the current study, the experimental data provide the continuous vector attributes in two different ways, permitting us to relate the quantitative biofilm data to environmental conditions and to protein functions. For the evaluation of experimental conditions, the bacterial strains make up the vector attributes (1–19 in Table 1). The study seeks patterns that involve the strains collectively and relate to variables, such as individual choices of temperature or medium. For the evaluation of protein function information, the combinations of conditions make up the vector attributes (#1–25 in Table 2). Patterns under consideration involve individual functional annotations or combinations thereof.
Statistical significance of each pattern was calculated based on the Kullback-Leibler (K-L) divergence between the complete data set, and the subset defined by the respective binary attribute, or (conjunctive) combination of binary attributes. The K-L-distribution-based algorithm was chosen instead of the histogram-based algorithm (Denton et al. 2008) because the validity of the histogram-based algorithm is limited to larger data sets than are considered in this study, where the data matrix has only 25 rows.
The K-L divergence for each subset was compared to the distribution of K-L divergence values that result from random selection of the same number of data points. 1000 random selections were performed and their significance was calculated on the assumption that the resulting K-L values were normally distributed. As a preprocessing step, the experimental results were normalized by dividing by the mean of the respective attribute.
Since many binary attributes, i.e. experimental variables or functional annotations, were considered, the multiple hypothesis testing setup was taken into consideration through the Bonferroni correction. For individual binary attributes, the number of tests was taken to be the number of attributes. For combinations of two binary attributes, all individual tests as well as all tests on combinations together were used as the number of tests. Only binary attributes that select at least four data points and leave no more than four unselected were considered. Binary attributes that were equal in their selections were only considered as a single test.
Biofilm formation on phenotype microarrays
To identify carbon sources that yield the most biofilm biomass, the E. coli K-12 strain AJW678 was cultured on phenotype microarray plates. The Phenotype MicroArray system from Biolog (Hayward, CA) consists of 96 well plates, where a single nutrient is dried to the bottom of each well. A tetrazolium dye is included to monitor respiration, which is indicative of growth (Bochner et al. 2001; Bochner et al. 2008; Bochner 2009). The PM1 plate used contains 95 single carbon sources and one negative control.
Bacteria were grown on R2A agar plates, swabbed from the plates, and diluted into IF-0a GN/GP Base inoculation fluid as recommended by the manufacturer. Threonine, methionine, leucine, and thiamine were added at a final concentration of 20 μg/ml to allow growth of the auxotrophic parental strain AJW678. 100 μl of this inoculum solution was added to each well, plates were incubated at 37°C for 48 h. For each of four independent experiments, two separate plates were prepared. Growth was determined as optical density at 600 nm (OD600) from the plate that was inoculated with the tetrazolium dye.
For biofilm determination, the tetrazolium dye was omitted. To provide a control experiment that has a completely independent experimental set up than the high-throughput experiment, a previously described ATP assay (Sule et al. 2009) was used to quantify biofilms. Briefly, the spent growth medium was carefully removed from each well with a multichannel pipette and the biofilms were washed twice with PBS. 100 μl of BacTiter GloTM reagent (Promega, Madison, WI) were added to each well. Bioluminescence was measured after 10 min at room temperature in a TD 20-20 bioluminometer from Turner Design (Sunnyvale, CA). Biofilm amounts formed in each well were reported as relative bioluminescence units (RLU). Data were normalized across four or five replicate experiments, using the total bioluminescence across each plate. Average and standard deviation were determined for the experiments.
Carbon sources were considered for analysis only when growth had occurred to at least 0.7 OD600 on the plate that was inoculated with the tetrazolium dye. Carbon sources were considered best ‘conditions’ for biofilm formation when the mean bioluminescence was above 1,300 RLU and the standard deviation below 40% of the mean (on the plates without the dye). 1,300 RLU was chosen because it is roughly four times the background value (approximately 320 RLU) and one quarter the maximum value obtained (4,900 RLU). Carbon sources were considered moderately good conditions for biofilm formation when they permitted an amount of biofilm that is equivalent to at least 800 and no more than 1,300 RLU. Degradation pathways for carbon sources were obtained from the Kyoto Encyclopedia of Genes and Genome (http://www.genome.jp/kegg) (Kanehisa and Goto 2000).
Scanning electron microscopy (SEM)
Biofilms were produced from the parental strain AJW678 and its isogenic ackA, ackA pta, ackA rcsB, ackA dcuR, and ackA ompR mutants on 12 mm glass cover slips (Assistant, Germany) in 6 well plates. Bacteria were inoculated 1:100 from overnight culture in 4 ml of LB and incubated at 32°C for 48 h. As for the quantitative experiment, liquid-air and liquid-solid biofilms were preserved and analyzed. After one wash with PBS, biofilms were air dried and fixed in 2 ml of 2.5% glutaraldehyde (Tousimis Research Corporation, Rockville MD) in 0.1 mol l−1 sodium phosphate buffer. Biofilms were prepared for scanning electron microscopy (SEM) as described previously (Sule et al., 2009). Images were obtained with a JEOL JSM-6490LV scanning electron microscope (JEOL Ltd., Japan) at 1,000 ×, 3,000 ×, and 6,500 × magnification. Bacterial strains were processed three to four times; between 15 and 24 images were obtained per strain. For each strain examined, the distribution of bacterial biofilm across the cover slips was largely consistent. One representative image was presented for each strain at 3,000 × magnification.
Results
High-throughput biofilm analysis
To identify environmental and genetic factors that influence biofilm amounts, we performed a high-throughput experiment using the CV assay to quantify the amount of biofilm formed by 19 different isogenic bacterial strains grown under 25 different combinations of 4 distinct environmental conditions. Supplemental Table 2 presents the raw data, while Figure 1 summarizes a selection of the data that best illustrate our general observations.
Fig. 1. High-throughput quantitative biofilm experiment.

For A, the absolute amount of biofilm was determined as optical density measurement at 600 nm for the parent strain. Combinations of environmental conditions are indicated on the x-axis. Different gray shades indicate the three different temperatures (black, 37°C; dark grey, 32°C; light grey, 27°C). For B, relative biofilm amounts are normalized to the AJW678 parent strain (WT=1). The amount of biofilm formation is indicated for environmental conditions 37°C, TSB, 1:10, 48 h (black bars); 37°C, LB, 1:10, 24 h (dark grey bars); 32°C, LB, 1:100, 24 h (medium grey bars); 27°C, LB, 1:10, 48 h (light grey bars); and 27°C, TB, 1:10, 48 h (white bars). Error bars indicate the standard deviation across 18 data points.
To identify the environmental conditions that support the largest biofilm biomass formed by the parental strain (AJW678), we plotted the data in terms of absolute biofilm amount (OD600). Such a portrayal revealed that the two environmental conditions that most influenced biofilm formation are growth medium composition and incubation temperature. Specifically, when grown in TSB at 37°C, the parental strain formed the largest amount of biofilm. The amount of biofilm decreased as the richness of the medium diminished from TSB to TB (black bars in Fig. 1A), while reduction of the temperature from 37°C to 32°C further diminished biofilm biomass (dark grey bars). The smallest amount of biofilm formed in TB at 27°C (light grey bars). Since each of the mutant strains exhibited a similar pattern (data not shown), we conclude that medium composition and incubation temperature are of paramount importance to biofilm formation by this genetic background.
To identify phenotypic differences caused by the loss of certain surface appendages, signaling pathways, metabolic pathways, or select combinations, we plotted the relative amount of biofilm, giving the value of 1 to the amount of biofilm produced by the parental strain under each combination of conditions (Fig. 1B). The first two mutants, fliA and flhD, each lack a key regulator required for the biogenesis of the bacterial flagellum. Loss of the flagellar-specific sigma factor FliA resulted in a substantial loss of biofilm under all growth conditions. In contrast, loss of the master regulator of flagellar biogenesis, FlhD/FlhC, exerted a much less severe effect: under most conditions, the flhD mutant produced approximately parental amounts of biofilm.
To explain this apparent paradox, we tested the parental strain for the presence of IS elements that increase the expression level of FlhD/FlhC and render E. coli K-12 strains more motile (Barker et al. 2004). When we performed PCR amplification with flhD promoter region-specific primers, the parent strain yielded a PCR product indicative of the lack of an IS element (data not shown). This result was paralleled by the reduced migration rate of the parent strain AJW678 on tryptone swarm plates (1.8 ± 0.03 mm/h) relative to that of MC1000, a related strain that contains an IS5 element within its flhD promoter region (5.9 ± 0.1 mm/h). These results indicate that the lack of a difference in biofilm amounts between the parental strain and the flhD mutant (Fig. 1B) might be due to low expression levels of flhD in AJW678. Interestingly, constitutive expression of flhD from a multicopy plasmid (pXL27) dramatically improved migration (6.4 ± 1 mm/h) and reduced biofilm biomass across most conditions (Fig. 1B). Thus, FlhD/FlhC appears to have a negative effect on biofilm biomass when flhD is expressed constitutively and in multi-copy.
The next six mutants (Fig. 1B) lacked at least one required component of type I fimbriae (either fimA or fimH). Across all combinations of conditions, the lack of complete type I fimbriae consistently reduced the amount of biofilm to less than 30% of that produced by the Fim+ parent. This was the case even in double and triple mutants containing additional mutations in ackA and/or pta, whose presence alone gave rise to rather large amounts of biofilms throughout most conditions (see below). We conclude that irreversible attachment mediated by the type I fimbrium is a crucial step during biofilm formation.
Results obtained from the remaining mutants were more complex. Both the RcsCDB phosphorelay (Hagiwara et al. 2003) and EnvZ/OmpR (Oshima et al. 2002) are global 2CSTSs known to affect expression of a large portion of the E. coli genome, including several biofilm-associated cell surface organelles. Yet, mutants lacking RcsC, RcsB, or OmpR exhibited only moderate reductions in biomass especially under growth conditions that were the least favorable for biofilm formation (Fig. 1B). In contrast, cells lacking RcsD exhibited a dramatic loss of biomass across all conditions.
Vector-item pattern-mining algorithm (VIP2)
To better understand the complex relationships between the global regulators, the metabolic enzymes AckA and Pta, and the biofilm-associated cell surface organelles flagella and type I fimbriae, we performed computational analyses using the vector-item pattern-mining algorithm VIP2, which searches directly for sets of relationships (patterns) between multiple experiments (vector data) and membership in a specific classification (item data).
In a first analysis, we related the quantitative biofilm data (Supplemental Table 2) to the tested environmental conditions (Table 2). Fig. 2A highlights the results from the computational analysis for all the experiments performed at 37°C. For these data, the algorithm calculated a significant p-value of 7 × 10⁻⁴. In contrast, Fig. 2B highlights only those experiments performed at 37°C in TSB. For this more restricted data set, the p-value is a highly significant 5.1 × 10−47. This confirms our initial observation (Fig. 1A) that growth medium and temperature exert a stronger effect upon biofilm amount than do inoculation density and duration of incubation.
Fig. 2. Outcome of the computational analysis of the high-throughput experiment.

For A and B, quantitative amounts of biofilm were plotted versus the bacterial strains (labels on x-axis correspond to strain designations in column 1 of Table 1). Each line represents one experiment that is defined through a combination of four individual conditions. The peak at strain 10 is the ackA mutant at 37°C in TSB. Fig. 2A highlights (bold lines) the condition 37°C (p-value of 6.991 × 10⁻⁴), while Fig. 2B highlights the combination of the conditions 37°C as the growth temperature and TSB as the culture medium (p-value of 5.1558 × 10−47). Both panels show the entire data set, and only differ in their highlighting.
For Figs. 2C and 2D, the quantitative amounts of biofilm were plotted versus combinations of experimental conditions (labels on x-axis correspond to the designations in column 1 of Table 2). Each line represents one mutant. The peak at conditions 7 and 8 is at 37°C in TSB, the highest biofilm amount is formed by the ackA mutant (see A and B). Fig. 2C highlights mutants that lack genes with GO:0042867, pyruvate catabolic process function. Fig. 2D highlights mutants that lack genes that together show the presence of GO:0042867 and the absence of GO:0007155, which is characteristic of the type I fimbrium. Note that while the filters were defined requiring GO:0042867 to be present and GO:0007155 to be absent, other GO terms are associated with the same filters: For example, GO:0009289 and GO:0042995 select the same genes as GO:0007155 because they are all associated with type 1 fimbriae. Likewise, GO:0005624, GO:0006082, GO:0008776, GO:0009063, GO:0016052, GO:0016774, and GO:0045733 select the same genes as GO:0042867 because they are all associated with the same enzymes. For a complete of all GOs that were associate with a particular protein function, please, see Supplemental Table 1.
We next used the VIP2 algorithm to analyze the relationship between the quantitative biofilm data (Supplemental Table 2) and the GO annotations (Supplemental Table 1). Fig. 2C highlights the functional group ‘pyruvate catabolic process.’ These data are not significant (p-value of 8.7). A simple explanation for this lack of significance can be found in the data at the bottom of the plot. These data, obtained from mutants that contain the fimA or fimH mutation in combination with mutations in the Pta-AckA pathway, do not follow the general pattern exhibited by the other highlighted mutants. When we used a filter that excluded the respective GO annotations for the type I fimbrium (GO:0042867 ‘pyruvate catabolic process’ and not GO:0007155 ‘member of the fimA or fimH group), we obtained a much improved p-value of 0.0619 (Fig. 2D). The protein function that forms the pattern in Fig. 2D, ‘pyruvate catabolic process’ or GO:0042867, is associated with the enzymes Pta and AckA that form the Pta-AckA pathway from acetyl-CoA to acetate. The four mutants that contribute to the pattern are ackA, ackA pta, ackA rcsB, and ackA pta rcsB. This is strong evidence that acetate metabolism may play a role in determining quantitative biofilm amounts.
Carbon sources that are metabolized to acetyl-CoA and acetate facilitate formation of large amounts of biofilm
The results from the high-throughput quantitative biofilm experiment support the notion that the nutritional status of the environment plays an important role in biofilm formation. The use of the VIP2 algorithm further implicated acetate metabolism as a critical factor in that process. To test the latter hypothesis, we used the PM1 plates of the BioLog Phenotype MicroArray system to evaluate the ability of individual carbon sources to support biofilm formation by the parental strain (AJW678). Of the 51 carbon sources that supported growth, 18 supported substantial amounts of biofilm (>1,300 RLU, Fig. 3A), another 18 supported moderate amounts of biofilm (800 to 1,300 RLU, Fig. 3B), and 15 supported low amounts of biofilm (<800 RLU, data not shown). Of the 18 carbon sources that supported substantial amounts of biofilm (Fig. 3A), 14 can be metabolized to acetyl-CoA and/or acetate via glycolysis or the tricarboxylic acid (TCA) cycle (red carbon sources in Fig. 4). Of the 18 carbon sources that supported moderate amounts of biofilm (Fig. 3B), another 13 can be metabolized to acetyl-CoA and/or acetate through glycolysis (L-rhamnose through L-lactic acid) or the TCA cycle (m-tartaric acid through L-malic acid). These data support the hypothesis that acetate metabolism plays a role in biofilm formation. However, some carbon sources that can be metabolized to acetyl-CoA and/or acetate failed to support significant amounts of biofilm. Two examples of such carbon sources are glucose 6-phosphate and fructose 6-phosphate, which permitted growth to 1.0 and 1.1 OD600, while supporting biofilm amounts equivalent to only 614 and 338 RLU, respectively. In contrast, pyruvate, whose metabolism would also be expected to produce large amounts of acetate, failed to permit growth to 0.7 OD600. D-ribose was the carbon source that permitted the lowest amount of biofilm (146 RLU), while still promoting growth (0.7 OD600). Other five-carbon sugars, such as arabinose, xylose, or lyxose, failed to promote growth and consequently did not support biofilm formation (data not shown).
Fig. 3. Phenotype MicroArray analysis, parent strain.

The ability of 95 carbon sources to promote biofilm formation by AJW678 was tested on PM1 plates with the ATP bioluminescence assay. Fig. 3A presents carbon sources that supported the formation of an amount of biofilm that was at least 1,300 RLU, Fig. 3B demonstrates carbon sources that supported biofilm amounts equivalent to at least 800 and no more than 1,300 RLU. Carbon sources are only shown when they allowed growth to an OD600 of at least 0.7. The experiment was performed four times, the data were normalized to the experiment that yielded the lowest biofilm amounts, using the total bioluminescence on each plate. Averages and standard deviations are presented. The negative control is included.
Fig. 4. Hypothesized signaling pathway from nutrients to biofilm associated cell surface organelles.

Printed in red are fourteen of the eighteen carbon sources that permitted highest amounts of biofilm in the Phenotype MicroArray experiment (parent strain, Fig. 3A). Metabolic intermediates that are involved in their degradation are printed in black. D-glucose, maltose, maltotriose, and D-trehalose enter glycolysis through glucose 6-phosphate; D-mannose, D-mannitol, and D-fructose through fructose 6-phosphate. L-asparagine, L-aspartate, and L-alanine have a pathway that leads into glycolysis at the level of pyruvate. Succinic acid, fumaric acid, and malic acid can serve as substrates for the synthesis of hexoses through gluconeogenesis; the enzyme phosphoenolpyruvate carboxykinase converts oxaloacetate back to the glycolytic intermediate phosphoenolpyruvate. Printed in blue are the Pta and AckA enzymes that are involved in the interconversion of acetyl-CoA, acetyl phosphate and acetate. Printed in green is the response regulator RcsB that gets phosphorylated by acetyl phosphate. Biofilm associated cell surface organelles that are affected by RcsB-P are printed in purple.
Clearly, acetate metabolism cannot explain all the behaviors observed by phenotype microarrays, for example the support of biofilm production by C(4)-dicarboxylic acids, including m-tartaric acid and the TCA cycle intermediates D,L-malic acid, fumaric acid, and succinic acid. Because the 2CSTS DcuS/DcuR that was hypothesized as involved in biofilm formation by the original VIP algorithm (Denton et al. 2008) regulates the genes responsible for the metabolism of C(4)-dicarboxylic acids (Golby et al. 1999), we constructed a dcuR mutant and tested its ability to form biofilms on different carbon sources. This was done with PM1 plates. Relative to its parent strain, the dcuR mutant produced about half the amount of biofilm on D,L-malic acid, fumaric acid, and succinic acid (827 versus 1651 RLU, 755 versus 1410 RLU, and 1073 versus 1452 RLU, respectively). Interestingly, the mutant also exhibited a reduced ability to form biofilm when growing on acetate (1005 versus 1349 RLU). This raises the question whether DcuR may contribute to transmitting the environmental signal from acetate metabolism to biofilm amounts, in addition to its demonstrated role in C(4)-dicarboxylic acid metabolism.
Biofilms formed by strains with mutations in acetate metabolism exhibit structural and quantitative differences from their parent strain
To (i) confirm quantitative differences in biofilm amounts between the acetate mutants and their parent strain and (ii) determine whether such quantitative differences are accompanied by structural differences, SEM was performed. For the parental strain, this technique revealed a small number of bacteria distributed homogenously across the cover slip without apparent accumulation or clustering (Fig. 5, top image). In contrast, biofilms formed by the ackA and ackA pta mutants contained larger numbers of cells in very densely packed clusters (second row). As observed previously (Sule et al. 2009), both mutants elaborated long straight appendages that were generally missing from the parent. The identity of these appendages is currently unknown.
Fig. 5. Scanning electron microscopy.
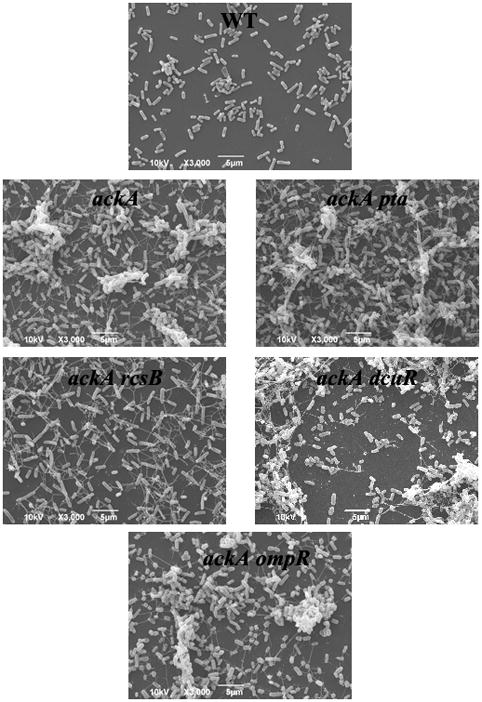
Biofilms were grown in LB for 48 h at 32°C from wild-type bacteria and isogenic ackA, ackA pta, ackA rcsB, ackA dcuR, and ackA ompR mutants. Up to 24 scanning electron micrographs were obtained at three different magnifications. One representative image at 3,000 fold magnification is shown.
To determine whether the qualitative or quantitative differences between the ackA mutant and its parent strain were dependent on a specific 2CSTS response regulator, we tested double mutants defective in ackA and either rcsB, dcuR, or ompR. The ackA rcsB mutant (third row, left image) lacked the clusters of densely packed bacteria that are characteristic of the ackA mutant. The ackA dcuR mutant (third row, right image) retained these clusters but exhibited a reduced number of attached bacteria. In contrast, the ackA ompR mutant (bottom image) looked no different than the ackA mutant. Thus, the structural differences between the ackA mutant and its parent strain depend on RcsB, whereas the quantitative differences involve DcuR.
Discussion
From many microarray studies (Beloin et al. 2004; Ren et al. 2004; Schembri et al. 2003), it is obvious that gene expression during biofilm development is very sensitive to environmental conditions (Domka et al. 2007; Wood 2009). However, 15 years of biofilm research have failed to convincingly attribute the response to such environmental conditions to a set of transcriptional regulators that are specific for biofilm formation (Monds and O’Toole 2009). This could be due to the fact that the amount of information obtained to date is immense, yet systematic approaches to investigate the environmental conditions that support or inhibit biofilm formation are rare. Our study constitutes an example of such a systematic approach, where a complex experimental data set obtained with an easy assay and analyzed by a novel algorithm led to novel discoveries. Ranking of the environmental conditions, specifically the determination of temperature and nutrition as more important than inoculation density and incubation time, may just support current literature (Goller and Romeo 2008). However, our study was based on genetic factors that are not routinely studied by other biofilm researchers. The inclusion of mutations in the enzymes of acetate metabolism led to the discovery that acetate metabolism is involved in sensing environmental conditions. Among the 2CSTSs that were postulated as involved in biofilm formation by our previous computational study (Denton et al. 2008), DcuR played a role in determining biofilm amounts. Overall, we believe that high-throughput approaches, such as the one presented in this study, coupled to novel computational tools will enable us to identify metabolic sensory mechanisms that contribute to biofilm formation, as postulated by the individualistic biofilm model (Monds and O’Toole 2009).
While the use of high-throughput technology coupled to the VIP2 algorithm identified acetate metabolism as involved in the determination of biofilm amounts (Figs. 2C and D), observation by SEM revealed additional structural differences between the biofilms formed by the acetate mutants and their isogenic parental strain (Fig. 5). These differences appear similar to the ones that were observed for Pseudomonas aeruginosa, grown in the presence of different carbon sources. P. aeruginosa biofilms that form in the presence of glucose are very heterogenous and contain mushroom-shaped microcolonies (Davies et al. 1998; Stewart et al. 1993), while biofilms that are cultured in the presence of citrate are flat and uniform (Heydorn et al. 2000; Heydorn et al. 2002). The biofilms that we describe for the acetate mutants appear similar to the glucose-grown P. aeruginosa biofilm, whereas our parent biofilm appears more similar to the citrate-grown P. aeruginosa biofilm.
Acetate metabolism includes two high-energy intermediates, acetyl-CoA and acetyl phosphate. The synthesis of acetyl phosphate from acetyl-CoA [1] and its degradation to acetate [2] are mediated by the enzymes phosphotransacetylase (Pta) and acetate kinase (AckA), respectively (Brown et al. 1977). Acetyl phosphate serves as a global signal that transmits information about environmental cues to central metabolism, modulating the activity of certain 2CSTS response regulators (for reviews, see Wolfe 2005a; Wolfe 2005b; Wolfe 2010).
| [1] |
| [2] |
Given that bacteria growing on glucose produce large amounts of acetyl phosphate and acetate (Fig. 4), acetate metabolism could be responsible for many of the structural effects. At least one 2CSTS response regulator, RcsB, is known to be activated upon receipt of the phosphoryl group from acetyl phosphate (Fredericks et al. 2006; Fig. 4). In doing so, RcsB functions as a sensor of acetate metabolism. Since many cellular processes associated with biofilm formation are regulated by RcsB-P, it is not hard to see how acetate metabolism could have a major impact. It will have to be determined whether DcuR can become phosphorylated by acetyl phosphate and, if so, which cellular processes regulated by DcuR are relevant to the production of biofilm.
A previous study (Wolfe et al. 2003) described a fimbriae-dependent biofilm formed by the ackA mutant and a flagella-dependent biofilm formed by the ackA pta mutant. It was hypothesized that acetyl phosphate may act as a signal that permits an orderly switch between the flagella-dependent reversible attachment phase of biofilm formation and the type I fimbriae-dependent irreversible attachment phase. This was dependent on the response regulator RcsB (Fredericks et al. 2006). While the amount of biofilm biomass was not quantified in either of the two previous studies, both studies indicate that ackA and ackA pta double mutants can form biofilms. Our study is in agreement with these observations. Mutants in ackA and ackA pta form biofilms that are structurally different from each other and their parental strain. In addition, biofilms formed by both mutants contained a larger number of bacteria than was found in wild-type biofilms, as was determined by scanning electron microscopy. However, ackA mutants, which accumulate acetyl phosphate, and ackA pta mutants, which do not synthesize acetyl phosphate, were both qualitatively and quantitatively different from the parent. This is strong evidence that acetyl phosphate cannot be the only acetate intermediate that is responsible for these differences.
The other activated acetate intermediate, acetyl-CoA, also could influence biofilm formation. Acetyl-CoA is well known as an acetyl donor and recent proteomics studies have shown that many E. coli and Samonella enterica proteins can become acetylated (Yu et al. 2008; Zhang et al. 2009; Wang et al. 2010) (for a review, see Hu et al. 2010). The effect of acetylation on the biofilm-associated processes remains unknown; however, there appears to be a correlation between gene expression and manipulations that alter the acetyl-CoA:CoA ratio (Linda Hu, Bruno Lima, Bozena Zemaitaitis, and Alan Wolfe, unpublished). In addition, RcsB is one of two response regulators that can be acetylated by acetyl-CoA (Jorge Escalante-Semerena, personal communication). Finally, acetate itself could influence biofilm formation. A recent study presents evidence that acetate can activate the BarA/UvrY 2CSTS (Chavez et al. 2010). Thus, the role of the Pta-AckA pathway in biofilm formation might involve acetyl phosphate, acetyl-CoA, and acetate.
Supplementary Material
Acknowledgments
The authors thank the Coli Genetic Stock Center (Yale University, New Haven CT)) for strains and Dr. Philip Matsumura (University of Illinois at Chicago, Chicago IL) for plasmid pXL27. Dr. Jayma Moore (NDSU) performed the scanning electron microscopy at the Electron Microscopy Center.
In the VMS Department, KV was funded by the North Dakota Agricultural Experiment Station. BMP, SK, and PS were funded by ADVANCE/FORWARD through grant HRD-0811239 from the National Science Foundation. Equipment was purchased from a seed grant from ND EPSCoR through grant EPS-0447679 from the NSF. In addition, BMP and PS were funded by an earmark grant on Agrosecurity: Disease Surveillance and Public Health provided through the Unites States Department of Agriculture-APHIS. In the Computer Science Department, AD and JW were funded by grant IDM-0415190 from the NSF. JW was also supported by the Center for Nanoscale Science and Engineering. At CNSE, SJS and DC were funded by grant N00014-06-1-0952 from the Office of Naval Research. At Loyola University, AJW was funded by grant GM066130 from the National Institute of General Medical Sciences.
References
- Barker CS, Prüβ BM, Matsumura P. Increased motility of Escherichia coli by insertion sequence element integration into the regulatory region of the flhD operon. J Bacteriol. 2004;186:7529–7537. doi: 10.1128/JB.186.22.7529-7537.2004. [DOI] [PMC free article] [PubMed] [Google Scholar]
- Beloin C, Valle J, Latour-Lambert P, Faure P, Kzreminski M, Balestrino D, Haagensen JA, Molin S, Prensier G, Arbeille B, Ghigo JM. Global impact of mature biofilm lifestyle on Escherichia coli K-12 gene expression. Mol Microbiol. 2004;51:659–674. doi: 10.1046/j.1365-2958.2003.03865.x. [DOI] [PubMed] [Google Scholar]
- Bertin P, Hommais F, Krin E, Soutourina O, Tendeng C, Derzelle S, Danchin A. H-NS and H-NS-like proteins in Gram-negative bacteria and their multiple role in the regulation of bacterial metabolism. Biochimie. 2001;83:235–241. doi: 10.1016/s0300-9084(01)01247-0. [DOI] [PubMed] [Google Scholar]
- Bertin P, Terao E, Lee EH, Lejeune P, Colson C, Danchin A, Collatz E. The H-NS protein is involved in the biogenesis of flagella in Escherichia coli. J Bacteriol. 1994;176:5537–5540. doi: 10.1128/jb.176.17.5537-5540.1994. [DOI] [PMC free article] [PubMed] [Google Scholar]
- Besemann C, Denton A, Carr NJ, Prüβ BM. BISON: Bio-Interface for the Semi-global analysis Of Network patterns. Source Code Biol Med. 2006;1:8. doi: 10.1186/1751-0473-1-8. [DOI] [PMC free article] [PubMed] [Google Scholar]
- Bochner BR. Global phenotypic characterization of bacteria. FEMS Microbiol Rev. 2009;33:191–205. doi: 10.1111/j.1574-6976.2008.00149.x. [DOI] [PMC free article] [PubMed] [Google Scholar]
- Bochner BR, Gadzinski P, Panomitros E. Phenotype microarrays for high-throughput phenotypic testing and assay of gene function. Genome Res. 2001;11:1246–1255. doi: 10.1101/gr.186501. [DOI] [PMC free article] [PubMed] [Google Scholar]
- Bochner BR, Giovannetti L, Viti C. Important discoveries from analysing bacterial phenotypes. Mol Microbiol. 2008;70:274–280. doi: 10.1111/j.1365-2958.2008.06383.x. [DOI] [PMC free article] [PubMed] [Google Scholar]
- Brown TD, Jones-Mortimer MC, Kornberg HL. The enzymic interconversion of acetate and acetyl-coenzyme A in Escherichia coli. J Gen Microbiol. 1977;102:327–336. doi: 10.1099/00221287-102-2-327. [DOI] [PubMed] [Google Scholar]
- Chavez RG, Alvarez AF, Romeo T, Georgillis D. The physiological stimulus for the BarA sensor kinase. J Bacteriol. 2010;192:2009–2012. doi: 10.1128/JB.01685-09. [DOI] [PMC free article] [PubMed] [Google Scholar]
- Costerton JW, Stewart PS, Greenberg EP. Bacterial biofilms: a common cause of persistent infections. Science. 1999;284:1318–1322. doi: 10.1126/science.284.5418.1318. [DOI] [PubMed] [Google Scholar]
- Davies DG, Parsek MR, Pearson JP, Iglewski BH, Costerton JW, Greenberg EP. The involvement of cell-to-cell signals in the development of a bacterial biofilm. Science. 1998;280:295–298. doi: 10.1126/science.280.5361.295. [DOI] [PubMed] [Google Scholar]
- Denton AM, Wu J. Data mining of vector-item patterns using neighborhood histograms. Knowl and Informat Syst. 2009;21:173–199. [Google Scholar]
- Denton AM, Wu J, Townsend MK, Sule P, Prüβ BM. Relating gene expression data on two-component systems to functional annotations in Escherichia coli. BMC Bioinformatics. 2008;9:294. doi: 10.1186/1471-2105-9-294. [DOI] [PMC free article] [PubMed] [Google Scholar]
- Domka J, Lee J, Bansal T, Wood TK. Temporal gene-expression in Escherichia coli K-12 biofilms. Environ Microbiol. 2007;9:332–346. doi: 10.1111/j.1462-2920.2006.01143.x. [DOI] [PubMed] [Google Scholar]
- Fredericks CE, Shibata S, Aizawa SI, Reimann SA, Wolfe AJ. Acetyl phosphate-sensitive regulation of flagellar biogenesis and capsular biosynthesis depends on the Rcs phosphorelay. Mol Microbiol. 2006;61:734–747. doi: 10.1111/j.1365-2958.2006.05260.x. [DOI] [PubMed] [Google Scholar]
- Gao R, Stock AM. Biological insights from structures of two-component proteins. Annu Rev Microbiol. 2009;63:133–154. doi: 10.1146/annurev.micro.091208.073214. [DOI] [PMC free article] [PubMed] [Google Scholar]
- Golby P, Davies S, Kelly DJ, Guest JR, Andrews SC. Identification and characterization of a two-component sensor-kinase and response-regulator system (DcuS-DcuR) controlling gene expression in response to C4-dicarboxylates in Escherichia coli. J Bacteriol. 1999;181:1238–1248. doi: 10.1128/jb.181.4.1238-1248.1999. [DOI] [PMC free article] [PubMed] [Google Scholar]
- Goller CC, Romeo T. Environmental influences on biofilm development. Curr Top Microbiol Immunol. 2008;322:37–66. doi: 10.1007/978-3-540-75418-3_3. [DOI] [PubMed] [Google Scholar]
- Hagiwara D, Sugiura M, Oshima T, Mori H, Aiba H, Yamashino T, Mizuno T. Genome-wide analyses revealing a signaling network of the RcsC-YojN-RcsB phosphorelay system in Escherichia coli. J Bacteriol. 2003;185:5735–5746. doi: 10.1128/JB.185.19.5735-5746.2003. [DOI] [PMC free article] [PubMed] [Google Scholar]
- Heydorn A, Ersboll B, Kato J, Hentzer M, Parsek MR, Tolker-Nielsen T, Givskov M, Molin S. Statistical analysis of Pseudomonas aeruginosa biofilm development: impact of mutations in genes involved in twitching motility, cell-to-cell signaling, and stationary-phase sigma factor expression. Appl Environ Microbiol. 2002;68:2008–2017. doi: 10.1128/AEM.68.4.2008-2017.2002. [DOI] [PMC free article] [PubMed] [Google Scholar]
- Heydorn A, Nielsen AT, Hentzer M, Sternberg C, Givskov M, Ersboll BK, Molin S. Quantification of biofilm structures by the novel computer program COMSTAT. Microbiology. 2000;146:2395–2407. doi: 10.1099/00221287-146-10-2395. [DOI] [PubMed] [Google Scholar]
- Hommais F, Krin E, Laurent-Winter C, Soutourina O, Malpertuy A, Le Caer JP, Danchin A, Bertin P. Large-scale monitoring of pleiotropic regulation of gene expression by the prokaryotic nucleoid-associated protein, H-NS. Mol Microbiol. 2001;40:20–36. doi: 10.1046/j.1365-2958.2001.02358.x. [DOI] [PubMed] [Google Scholar]
- Hu LI, Lima BP, Wolfe AF. Bacterial protein acetylation: the dawning of a new age. Mol Microbiol. 2010 doi: 10.1111/j.1365-2958.2010.07204.x. in press. [DOI] [PMC free article] [PubMed] [Google Scholar]
- Kanehisa M, Goto S. KEGG: kyoto encyclopedia of genes and genomes. Nucleic Acids Res. 2000;28:27–30. doi: 10.1093/nar/28.1.27. [DOI] [PMC free article] [PubMed] [Google Scholar]
- Kumari S, Beatty CM, Browning DF, Busby SJ, Simel EJ, Hovel-Miner G, Wolfe AJ. Regulation of acetyl coenzyme A synthetase in Escherichia coli. J Bacteriol. 2000;182:4173–4179. doi: 10.1128/jb.182.15.4173-4179.2000. [DOI] [PMC free article] [PubMed] [Google Scholar]
- Liu X, Matsumura P. The FlhD/FlhC complex, a transcriptional activator of the Escherichia coli flagellar class II operons. J Bacteriol. 1994;176:7345–7351. doi: 10.1128/jb.176.23.7345-7351.1994. [DOI] [PMC free article] [PubMed] [Google Scholar]
- Monds RD, O’Toole GA. The developmental model of microbial biofilms: ten years of a paradigm up for review. Trends in Microbiol. 2009;17:73–87. doi: 10.1016/j.tim.2008.11.001. [DOI] [PubMed] [Google Scholar]
- Myers RH, Montgomery DC. Response surface methodology. John Wiley & Sons; New York: 1995. [Google Scholar]
- O’Toole GA, Pratt LA, Watnick PI, Newman DK, Weaver VB, Kolter R. Genetic approaches to study of biofilms. Methods Enzymol. 1999;310:91–109. doi: 10.1016/s0076-6879(99)10008-9. [DOI] [PubMed] [Google Scholar]
- Oshima T, Aiba H, Masuda Y, Kanaya S, Sugiura M, Wanner BL, Mori H, Mizuno T. Transcriptome analysis of all two-component regulatory system mutants of Escherichia coli K-12. Mol Microbiol. 2002;46:281–291. doi: 10.1046/j.1365-2958.2002.03170.x. [DOI] [PubMed] [Google Scholar]
- Pratt LA, Kolter R. Genetic analysis of Escherichia coli biofilm formation: roles of flagella, motility, chemotaxis and type I pili. Mol Microbiol. 1998;30:285–293. doi: 10.1046/j.1365-2958.1998.01061.x. [DOI] [PubMed] [Google Scholar]
- Prüβ BM, Besemann C, Denton A, Wolfe AJ. A complex transcription network controls the early stages of biofilm development by Escherichia coli. J Bacteriol. 2006;188:3731–3739. doi: 10.1128/JB.01780-05. [DOI] [PMC free article] [PubMed] [Google Scholar]
- Ren D, Bedzyk LA, Thomas SM, Ye RW, Wood TK. Gene expression in Escherichia coli biofilms. Appl Microbiol and Biotechnol. 2004;64:515–524. doi: 10.1007/s00253-003-1517-y. [DOI] [PubMed] [Google Scholar]
- Sauer K, Camper AK, Ehrlich GD, Costerton JW, Davies DG. Pseudomonas aeruginosa displays multiple phenotypes during development as a biofilm. J Bacteriol. 2002;184:1140–1154. doi: 10.1128/jb.184.4.1140-1154.2002. [DOI] [PMC free article] [PubMed] [Google Scholar]
- Schembri MA, Kjaergaard K, Klemm P. Global gene expression in Escherichia coli biofilms. Mol Microbiol. 2003;48:253–267. doi: 10.1046/j.1365-2958.2003.03432.x. [DOI] [PubMed] [Google Scholar]
- Shamir R, Maron-Katz A, Tanay A, Linhart C, Steinfeld I, Sharan R, Shiloh Y, Elkon R. EXPANDER-an integrative program suite for microarray data analysis. BMC Bioinformatics. 2005;6:232. doi: 10.1186/1471-2105-6-232. [DOI] [PMC free article] [PubMed] [Google Scholar]
- Silhavy TJ, Berman ML, Enquist LW. Experiments with gene fusions. Cold Spring Harbor Laboratory; Cold Spring Harbor: 1984. [Google Scholar]
- Stafslien SJ, Bahr JA, Feser JM, Weisz JC, Chisholm BJ, Ready TE, Boudjouk P. Combinatorial materials research applied to the development of new surface coatings I: a multiwell plate screening method for the high-throughput assessment of bacterial biofilm retention on surfaces. J Comb Chem. 2006;8:156–162. doi: 10.1021/cc050047m. [DOI] [PubMed] [Google Scholar]
- Stafslien S, Daniels J, Chisholm B, Christianson D. Combinatorial materials research applied to the development of new surface coatings III. Utilisation of a high-throughput multiwell plate screening method to rapidly assess bacterial biofilm retention on antifouling surfaces. Biofouling. 2007;23:37–44. doi: 10.1080/08927010601127311. [DOI] [PubMed] [Google Scholar]
- Stewart PS, Peyton BM, Drury WJ, Murga R. Quantitative observations of heterogeneities in Pseudomonas aeruginosa biofilms. Appl Environ Microbiol. 1993;59:327–329. doi: 10.1128/aem.59.1.327-329.1993. [DOI] [PMC free article] [PubMed] [Google Scholar]
- Sule P, Wadhawan T, Carr NJ, Horne SM, Wolfe AJ, Prüβ BM. A combination of assays reveals biomass differences in biofilms formed by Escherichia coli mutants. Lett Appl Microbiol. 2009;49:299–304. doi: 10.1111/j.1472-765X.2009.02659.x. [DOI] [PMC free article] [PubMed] [Google Scholar]
- Sung BH, Lee CH, Yu BJ, Lee JH, Lee JY, Kim MS, Blattner FR, Kim SC. Development of a biofilm production-deficient Escherichia coli strain as a host for biotechnological applications. Appl Environ Microbiol. 2006;72:3336–3342. doi: 10.1128/AEM.72.5.3336-3342.2006. [DOI] [PMC free article] [PubMed] [Google Scholar]
- Wang Q, Zhang Y, Yang C, Xiong H, Lin Y, Yao J, Li H, Xie L, Zhao W, Yao Y, Ning ZB, Zeng R, Xiong Y, Guan KL, Zhao S, Zhao GP. Acetylation of metabolic enzymes coordinates carbon source utilization and metabolic flux. Science. 2010;19:1004–1007. doi: 10.1126/science.1179687. [DOI] [PMC free article] [PubMed] [Google Scholar]
- Wolfe AJ. Acetyl phosphate is a global signal. In: Prüβ BM, editor. Global regulatory networks in enteric bacteria. Research Signpost; Trivandrum, Kerala, India: 2005a. pp. 31–44. [Google Scholar]
- Wolfe AJ. The acetate switch. Microbiol Mol Biol Rev. 2005b;69:12–50. doi: 10.1128/MMBR.69.1.12-50.2005. [DOI] [PMC free article] [PubMed] [Google Scholar]
- Wolfe AJ. Physiologically relevant small phosphodonors link metabolism to signal transduction. Curr Opin Microbiol. 2010;13:204–209. doi: 10.1016/j.mib.2010.01.002. [DOI] [PMC free article] [PubMed] [Google Scholar]
- Wolfe AJ, Berg HC. Migration of bacteria in semisolid agar. Proc Natl Acad Sci USA. 1989;86:6973–6977. doi: 10.1073/pnas.86.18.6973. [DOI] [PMC free article] [PubMed] [Google Scholar]
- Wolfe AJ, Visick KL. The second messenger cyclic di-GMP. American Society for Microbiology; Washington DC: 2010. [Google Scholar]
- Wolfe AJ, Chang DE, Walker JD, Seitz-Partridge JE, Vidaurri MD, Lange CF, Prüβ BM, Henk MC, Larkin JC, Conway T. Evidence that acetyl phosphate functions as a global signal during biofilm development. Mol Microbiol. 2003;48:977–988. doi: 10.1046/j.1365-2958.2003.03457.x. [DOI] [PubMed] [Google Scholar]
- Wood TK. Insights on Escherichia coli biofilm formation and inhibition from whole-transcriptome profiling. Environ Microbiol. 2009;11:1–15. doi: 10.1111/j.1462-2920.2008.01768.x. [DOI] [PMC free article] [PubMed] [Google Scholar]
- Yu BJ, Kim JA, Moon JH, Ryu SE, Pan JG. The diversity of lysine-acetylated proteins in Escherichia coli. J Microbiol Biotechnol. 2008;18:1529–1536. [PubMed] [Google Scholar]
- Zhang J, Sprung R, Pei J, Tan X, Kim S, Zhu H, Liu CF, Grishin NV, Zhao Y. Lysine acetylation is a highly abundant and evolutionarily conserved modification in Escherichia coli. Mol Cell Proteomics. 2009;8:215–225. doi: 10.1074/mcp.M800187-MCP200. [DOI] [PMC free article] [PubMed] [Google Scholar]
- Zheng D, Constantinidou C, Hobman JL, Minchin SD. Identification of the CRP regulon using in vitro and in vivo transcriptional profiling. Nucleic Acids Res. 2004;32:5874–5893. doi: 10.1093/nar/gkh908. [DOI] [PMC free article] [PubMed] [Google Scholar]
Associated Data
This section collects any data citations, data availability statements, or supplementary materials included in this article.