

Abstract
Rationale and Objectives
Imaging tumor response to neoadjuvant chemotherapy in vivo offers unique opportunities for patient care and clinical decision-making. Detailed imaging studies may allow oncologists to optimize therapeutic drug type and dose based on individual patient response. Most radiologic methods are used sparingly due to cost, thus important functional information about tumor response dynamics may be missed. In addition, current clinical standards are based on determining tumor size changes, thus standard anatomic imaging may be insensitive to early or frequent biochemical responses. Because optical methods provide functional imaging endpoints, our objective is to develop a low-barrier-to-access bedside approach that can be used for frequent, functional assessment of dynamic tumor physiology in individual patients.
Materials and methods
Diffuse Optical Spectroscopic Imaging (DOSI) is a non-invasive, bedside functional imaging technique that quantifies the concentration and molecular state of tissue hemoglobin, water, and lipid. Pilot clinical studies have shown that DOSI may be a useful tool for quantifying neoadjuvant chemotherapy response, typically by comparing the degree of change in tumor water and deoxy-hemoglobin concentration before and after therapy. Patient response at one week and mid-therapy have been used to predict clinical outcome. In this report we assess the potential value of frequent DOSI monitoring by performing measurements on 19 different days in a 51 year old subject with infiltrating ductal carcinoma (initial tumor size 60 × 27 mm) who received neoadjuvant chemotherapy (Anthracyclines and Bevacizumab) over an 18 week period.
Results
A composite index, the Tissue Optical Index (TOI), showed a significant (~50%) decrease over the nearly 18 weeks of chemotherapy. Tumor response was sensitive to the type of chemotherapy agent, and functional indices fluctuated in a manner consistent with dynamic tumor physiology. Final pathology revealed 4 mm of residual disease, which was detectible by DOSI at the conclusion of chemotherapy prior to surgery.
Conclusion
This case study suggests that DOSI may be a bedside-capable tool for frequent longitudinal monitoring of therapeutic functional response to neoadjuvant chemotherapy.
Keywords: Near-infrared, optical imaging, tissue absorption spectroscopy, breast cancer, therapeutic monitoring
Introduction
Pre-surgical neoadjuvant chemotherapy (NAC) has an increasingly important role in breast cancer patient care and drug development.(1–3) Also referred to as “preoperative systemic therapy,” NAC has become standard of care for locally advanced and inflammatory breast cancer.(2) In this setting, chemotherapy is administered prior to surgery to improve breast tissue conservation by reducing tumor size.(4) Additional important benefits compared to adjuvant chemotherapy include the ability to directly assessan individual’s sensitivity to specific drugs, and initiating treatment of possible nodes and metastases prior to surgery.
Imaging individual tumor response can provide sufficient information for oncologists to alter therapeutics with a goal of improving overall survival, decreasing cancer recurrence, and minimizing exposure to ineffective drugs. Several groups are developing advanced imaging techniques for monitoring the effects of neoadjuvant chemotherapy, using for example Magnetic Resonance Imaging (MRI) and Spectroscopy (MRS), and Positron Emission Tomography (PET).(1, 5–15) These studies provide compelling evidence that functional imaging can be used to monitor and perhaps even predict therapeutic outcome.(16) However, it is currently unclear what are the most sensitive and informative imaging endpoints and how often they should be assessed.
As multi-agent, targeted therapies become more popular, optimizing decisions for individual patients may require frequent updating with functional information that reflects therapeutic mechanisms and pathways. In conventional imaging, measurement frequency is typically low, generally because the high cost and complexity of scans is restrictive. Diffuse Optical Imaging and Spectroscopy (DOI, DOS) are emerging diagnostic techniques that are being explored to address a variety of problems in breast cancer.(17) These methods quantitatively measure the concentration of near-infrared (NIR) absorbing molecules in tissues using absorption spectroscopy and model-based computation. Typically DOS/DOI measures the tissue concentration of deoxy-hemoglobin (ctHHb) and oxy-hemoglobin (ctO2Hb). By increasing spectroscopic information content, water (ctH2O), bulk lipids, and other molecules can also be quantified.(18–20) The relationship between DOS and DOI are similar to that of MRS and MRI. MRI/DOI typically emphasize spatial resolution/image formation at the expense of spectral information content, whereas MRS/DOS generally have reduced spatial resolution, but excel in spectral information content. Our approach, Diffuse Optical Spectroscopic Imaging (DOSI), is a technique that can be used to generate low spatial resolution (i.e., 2D maps) functional images, yet maintain high spectral information content (~1000 wavelengths).
We reported the first use of DOS with limited imaging capabilities to track breast tumor response to neoadjuvant chemotherapy of Adriamycin/Cytoxan (A/C) in a human subject.(21) In that study, DOS measurements were performed over a 68 day time period. Significant reductions in tumor total hemoglobin concentration (ctTHb) and ctH2O of 56% and 67%, respectively were observed by the final treatment. In addition, bulk lipid content increased by nearly 28%. Recent DOI studies have supported these findings by comparison with MRI and ultrasound after long–term treatment.(22–24) We further demonstrated that DOS, again with limited imaging capabilities, may be able to predict tumor response to A/C therapies by observing that changes in ctHHb and ctH2O in the first week of treatment are strongly correlated (p=0.008, N=11) with the degree of tumor pathological response assessed months later after surgery.
In this paper, we present a longitudinal case study of a breast cancer patient who received 2 different therapeutic stages (Anthracyclines and Bevacizumab) over an 18 week period. DOSI was used at the bedside to measure tumor response on 19 different dates, starting before chemotherapy and ending just prior to surgery. A composite index, the Tissue Optical Index (TOI), showed a significant (~50%) decrease over the nearly 18 weeks of chemotherapy. Tumor response was sensitive to the type of chemotherapy agent, and functional indices fluctuated in a manner consistent with dynamic tumor physiology. These results highlight the capabilities of DOSI for detailed longitudinal studies and provide insight into the optimal timing of therapeutic imaging measurements for clinical decision making.
Materials and Methods
Instrumentation
The concepts of our combined frequency-domain(25) and continuous-wave (26) tissue spectrometer system, as well as the specific details of the instrument used for this study have been reported (Figure 1).(21) Both components are necessary for the separation of absorption from scattering over a wide spectral range. Briefly, the frequency-domain component of the instrument allows for absolute quantitation of tissue optical properties at discrete wavelengths, while the continuous wave component determines the optical properties at continuous wavelengths across the near-infrared (650–1000 nm) spectrum. The frequency-domain portion of the DOS instrument employs six commercially-available diode laser sources (660, 690, 780, 808, 830, and 850 nm), and an avalanche photodiode (APD) detector. The steady-state portion of the DOSI instrument employs a fiber-coupled broadband white-light source and a fiber-coupled 16-bit, 1024 pixel, cooled CCD spectrometer. The spectrometer system detects broadband light from 650 to 1000 nm with approximately 0.4 nm/pixel at 8 nm spectral resolution (i.e., resolving power). A handheld probe incorporates all source optical fibers, as well as the APD and spectrometer detector fiber. A reflectance geometry with a 28 mm source-detector separation is used. Frequency-domain and steady-state measurements are performed using a pre-set timing technique with less than 20 mW of optical power launched into the tissue per source. Frequency-domain instrumental artifacts are removed by calibrating with a tissue- simulating phantom with known absorption and scattering properties. Spectral artifacts are removed by calibrating on a spectraflect™-coated integrating sphere.
Figure 1. Current DOSI instrument.
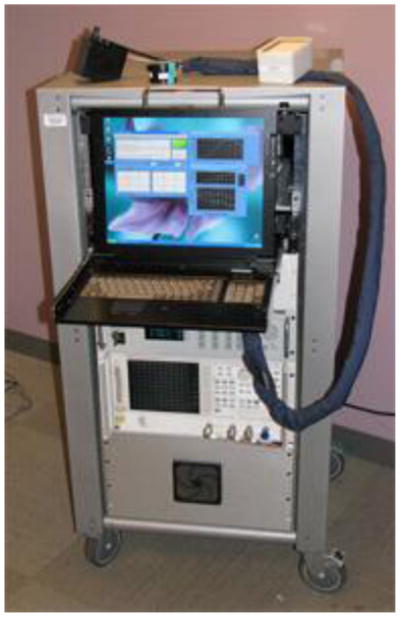
The DOSI instrument measures tissue complete absorption and scattering spectra from 650 to 1000 nm through the use of a handheld probe (seen on top of system). Spectroscopic images are generated by translating the handheld probe along a rectilinear grid on the surface of the breast.
Measured Information Content
Simple calculations using the Beer-Lambert law and known absorber extinction coefficients were used to convert the absorption spectra into quantitative measures of tissue concentrations of ctHHb (μM), ctO2Hb (μM), ctH2O (%), and bulk lipids (%), which are the primary NIR absorbers in breast tissue.(27) ctH2O is the concentration of measured tissue water divided by pure water concentration (55.6 M). Tissue lipids are reported as the percentage lipid measured relative to an assumed ‘pure’ lipid density of 0.9 g mL−1. Thus, reported water and lipid percentages are relative figures of merit compared to pure solutions of the substance, and are neither strict volumes nor add to 100%. The reduced scattering properties of tissue are reported as the results of a power-law fit to the measured frequency-domain reduced scattering values.(28) The absolute value of the exponent resulting from this fit is termed the scatter power (SP). In general, the SP is related to the size of the tissue scattering particles in relation to the optical wavelength. Further, we calculated a Tissue Optical Index (TOI), defined as ctHHb × ctH2O/lipids, which has been shown to be a reasonable contrast function for identifying diseased tissues that was derived from an analysis of 58 malignant tumors.(18)
DOSI Measurement Technique
A handheld probe was used to map a grid of spatial locations that covered both normal and tumor tissues. The lesion location was known a priori from ultrasound and palpation. A 10 mm-spaced point grid was marked on the breast using a non-permanent surgical skin pen to denote the DOSI scan area (Figure 2). The scan area was large enough to keep the lesion within the optical field of view, despite possible day-to-day variances in measurement technique. The DOSI probe was placed with light gravitational pressure without compression on the skin surface. Care was taken to perform DOSI with the patient in a consistent position each measurement session; subjects laid supine on a recliner at about 30° from horizontal with their arm up above the head. The handheld probe is mostly insensitive to the probe application pressure; only light contact (gravitational pressure) without compression was used for all measurements; contact pressure is not a significant source of measurement variation in DOSI.(29)
Figure 2. Measured Areas.

Dots represent DOSI-measured locations on each breast for the study. At each spatial location, broadband NIR absorption and scattering spectra were obtained. The tumor location and orientation is identified by the oval in the Figure.
Image Analysis
Functional maps of breast tissue physiological properties (ctHHb, ctO2Hb, ctH2O, bulk lipids, TOI) were calculated using the measured NIR absorption spectra from each grid location. No tomographic reconstructions were used, and the tissue within the field of view was assumed to be homogeneous in accordance with simple diffusion theory. Map points were interpolated using 2-dimensional nearest-neighbor cubic splines to round out the discrete shapes. All image scale bars were determined using the maximum and minimum values of the image. A four-stage colorbar was used in the images with RGB values of (0,0,0), (0,0,255), (0,255,255), and (255,255,255).
The tumor location was defined to be the location of maximum tissue optical index (TOI) which is defined as ctHHb × ctH2O/Bulk Lipid; the TOI has been shown to be a sensitive index for identifying malignant tissue regions.(18) We automatically thresholded the TOI image by the full-width-at-half-maximum (FWHM) to define the tumor area. For all DOSI calculations, we averaged each parameter (e.g., ctHHb) within the same area as the TOI FWHM. Feature-based stratification was preferred to a strict spatial segmentation of lesion area to guard against possible movement of the lesion and/or optically-scanned area. Normal tissue values were taken to be the background of the image. DOSI images were thresholded independently by TOI FWHM for each measurement date. Due to the relatively low spatial resolution, the specific nuances of the lesion contours are likely not meaningful.
Patient Selection
The subject in this case study was placed on neoadjuvant chemotherapy by their attending physician (RM) using a two-stage dose-density therapy schema that was approved by a University Internal Review Board. The subject was a 51 year old female with an initial 60 × 27 mm lesion in the left upper outer quadrant of the breast. Standard biopsy prior to treatment identified the lesion as infiltrating ductal carcinoma. The resulting lesion size post-therapy (see below) was 4mm. Residual tumor appeared on MRI and DOSI and was classified as a partial pathological response.
Measurement and Treatment Schedules
The initial therapy stage consisted of A/C at a dose of 60 mg/m2 (Adriamycin) and 600 mg/m2 (Cytoxan), administered for 2 cycles lasting 2 weeks each. It is more customary to treat with A/C for 4 cycles; however according to the treatment protocol the A/C stage was cut to 2 cycles if a desirable response, assessed by palpation, ultrasound, and/or MRI, was not achieved. The second therapy stage consisted of a treatment cycle lasting 4 weeks with (a) 1 dose weekly Carboplatin (Area Under Curve=2 mg ml−1 mi−1) and Abraxane (100 mg/m2) for 3 weeks with one off week and (b) Bevacizumab (Avastin, 10mg kg−1) in alternate weeks (HER2 negative patients). All chemotherapy decisions were made without feedback from DOSI measurements.
All DOSI measurements and procedures were performed under institution-approved regulatory protocols (Protocol #02-2306; Hsiang, PI). Written informed consent was provided by subjects in order to participate in this study. DOSI measurements occurred throughout the chemotherapy stages. The dates reported are the dates relative to the initial A/C chemotherapy treatment; thus baseline measurements have negative dates as they were performed prior to treatment. Measurements were also performed at the conclusion of all therapies just prior to surgery.
Results
Baseline tumor near-infrared absorption spectra
DOSI-measured NIR absorption spectra generally reveal significant differences between tumor and normal tissues. Figure 3 presents representative absorption spectra from tumor and normal tissue regions for the patient. Malignant and normal tissue spectra are represented by the solid (T) and dotted lines (N), respectively. Briefly, we see that below 850 nm increased hemoglobin absorption (both oxy and deoxy) in the tumor tissues relative to normal tissues.(30–34) At wavelengths near 980 nm, tumors display higher absorption due to increased water (i.e., OH bonds), as well as spectral broadening and shifting that are suggestive of changes in water binding state.(18, 20) The distinctive peak in the normal tissue absorption spectrum at 930 nm is due to high bulk lipid concentration, which is typically lower in tumor tissues.
Figure 3. DOSI-measured near infrared absorption spectra.

Sample near-infrared absorption spectra from normal and malignant breast tissues prior to neoadjuvant chemotherapy for both case study patients.
Our previously-reported measurements of malignant and normal tissues showed statistically-significant alterations in physiology that were consistent with malignancy in a population of 58 breast tumors.(18) Table 1 summarizes DOSI optical imaging biomarkers by comparing malignant and normal tissues within this patient. The TOI composite index was significantly higher in malignant tissues than surrounding normal tissues. The malignant tumor values reported in Table 1 represent a spatial average (i.e., above the threshold), whereas the normal values represent averages of the surrounding non-malignant tissue (i.e., below the threshold). The error bars represent the spatial heterogeneity of the variable within the tissue imaged volume and are not measurement errors.
Table 1.
Tumor functional properties measured by DOSI prior to chemotherapy
| ctO2Hb μM | ctHHb μM | ctH2O (%) | Lipid (%) | TOI | |
|---|---|---|---|---|---|
| Tumor | 15.0 ± 1.0 | 9.0 ± 1.2 | 40.7 ± 5.9 | 51.4 ± 4.2 | 7.7 ± 2.8 |
| Normal | 13.0 ± 2.2 | 6.0 ± 1.1 | 23.0 ± 6.3 | 71.5 ± 9.5 | 2.2 ± 1.1 |
Initial A/C Chemotherapy stage
Three days after the initial A/C treatment we observed a large decrease in tumor ctHHb (Figure 4). In these serial images, the scale is provided immediately to the right of each image; the scan area was similar in each case. Tumor ctHHb levels remained lower 4 days post-treatment. However, ctHHb increased over the course of the next few days. After 1 week, ctHHb returned to baseline values in terms of maximum ctHHb value and the area extent of elevated ctHHb values. We have previously reported that A/C therapy causes a significant decrease in tumor ctHHb and ctO2Hb in responders within only a few days of treatment.(21, 35)
Figure 4. Serial DOSI images: before Bevacizumab.

Serial images of ctHHb taken prior to all treatment (−8 days), as well as on day 3, 4, 5, and 7 after the initial A/C chemotherapy treatment. Each image is scaled independently, with the scale bar immediately to the right of the image. The maximum ctHHb value of the tumor dropped significantly after the treatment (days 3 & 4) but quickly returned to pre-treatment levels shortly thereafter (days 5 & 7). Note that the entire tumor volume was not imaged in this example.
Interestingly, we note that although there was an initial ctHHb decrease, after approximately 6 days ctHHb levels returned to near baseline levels. In a previous study of 11 patients treated with A/C, we found that in cases where ctHHb returns to baseline within, on average, 6 days, the end pathological response was poorer than for those who had significantly decreased levels on day six.(35) The variability in response trajectories highlights the fact that for the best functional view of the tissue, multiple time points may be required, owing to the variability in individual patient responses. The ctHHb ratio (tumor-to-normal) experienced only a modest decrease (1.52 to 1.3). Thus there remained a significant amount of ctHHb at the conclusion of 2 cycles of A/C, which in our experience is still a strong indicator of the presence of disease.(18, 35) The TOI ratio (tumor to normal) had also dropped significantly, but still a discernable lesion signature remained (about 3.5 to 2.5).
Bevacizumab Therapy Stage
Figure 5 displays serial DOSI images acquired after the conclusion of all A/C chemotherapy. The numbers at the top of the images represent days from initial Bevacizmuab and in parenthesis, days from initial A/C. For example, the first DOSI image was taken 7 days prior to the initial Bevacizumab treatment (20 days after the initial A/C treatment), and the second was taken 7 days after this initial Bevacizumab treatment. We observed a ctHHb decrease, as evidenced by the decrease in ctHHb maximum value (12.3 to 9.5). This trend continued for the next few days (11 and 12 days post Bevacizumab treatment). However, we observed that after 2 weeks, the lesion ctHHb maximum values began to approach the day -7 values (i.e., Bevacizumab baseline). Thus we observed a significant decrease in ctHHb, but within 2 weeks the ctHHb values returned to the Bevacizumab pre-treatment levels. Similar temporal behavior in vessel density has been observed in VEGF-targeted studies in late stage pancreatic islet tumors.(36)
Figure 5. Serial DOSI images: after Bevacizumab.

Day −7 refers to a week prior to the initiation of a treatment stage featuring Bevacizumab. The number in parentheses is the day count with respect to the start of all therapy. This patient received Bevacizumab on days 27 and 41. We observed an initial decrease in ctHHb, yet the peak values of ctHHb returned to the day −7 values after approximately 2 weeks.
Entire Therapy Sequence
Figure 6 displays the long-term TOI measurements in Patient #1, expressed as a ratio of tumor to normal. The shaded bars on the top refer to each stage of the therapy: before all treatment (PRE), during two cycles of A/C (AC × 2), during 4 cycles of Bevacizumab (B × 4), after all chemotherapy (END), and before final surgery (SRG). At baseline prior to all treatment, the TOI ratio was 3.5, which is comparable to the average malignant tumor contrast values found in our last population study.(18) At the conclusion of the A/C stage, the TOI ratio dropped significantly, but had not reached normal levels. These findings were consistent with contrast-enhanced MRI, which also showed an incomplete response to the A/C therapy, taken on day 42 of the overall therapy scheme. The Bevacizumab stage demonstrated further decreases in tumor area, as evidenced by the resulting drop of the TOI ratio to about 1.5 just prior to surgery many weeks later. We observed a general and gradual decrease in TOI ratio throughout all the DOSI measurements.
Figure 6. Long-Term tumor response.

Tissue optical index (TOI) ratio (tumor/normal) is plotted over the entire course of treatment.
At the conclusion of the Bevacizumab stage, the TOI ratio dropped significantly to a value of 1.8, and the ctHHb ratio decreased to a still higher-than-normal value of 1.25. In our experience, although these changes from baseline were significant, they are generally indicative of a partial pathological response. These above-normal residual values were confirmed by post-surgical observation: infiltrating ductal carcinoma with maximum size of the invasive component of 4 mm. MRI had also revealed enhancing regions, and thus properly identified a partial pathological response. Thus, for this patient, the final pathological response was only partial, and both MRI and DOSI were able to detect the presence of residual disease. Given the relatively poor spatial resolution (~5–8 mm) generally reported for diffuse optical imaging, our ability to detect a ~4 mm lesion suggests that the spatial extent of functional optical contrast may exceed classic anatomic contrast. (37, 38) These data further support for our previous observations that breast tumor optical contrast extends beyond the confines of tumor size assessed by standard radiological imaging methods such as ultrasound.(39)
Discussion
Current standard-of-care techniques (mammography, ultrasound, palpation) are inadequate to evaluate NAC final pathological response. A recent study evaluating palpation, mammography, ultrasound and MRI showed 19%, 26%, 35%, and 71% agreement, respectively, with final pathological response.(40) Evidence of early tumor anatomical volume change is not a guarantee of a favorable pathological response. For this reason, functional evaluation criteria are of great interest and may be more useful than morphological endpoints. Currently only morphological criteria are standards for evaluating therapeutic efficacy. Functional imaging of tumors from contrast-enhanced MRI, (41) MRS, (9), and Positron Emission Tomography (PET) (14) have shown improved response assessment capabilities over conventional anatomic imaging techniques. However, these functional techniques are difficult for advanced stage cancer patients (lengthy scan times, exogenous contrast), particularly if frequent measurements are desired. In addition, they are expensive. Finally, response assessments are performed infrequently and mainly in later therapy stages. Current scheduling and cost considerations exclude frequent and early monitoring. Dose-density strategies, drug cocktails, multi-stage therapies, and targeted therapies imply that it may become critical to monitor each therapy stage such that the oncologist can “tune” treatments towards individual response.
Our approach offers a potentially cost-effective solution that may help individualize breast cancer treatments and improve both the success and quality of care. DOSI may be particularly effective in the assessment of anti-angiogenic therapies because DOSI is inherently sensitive to hemoglobin through near-infrared absorption and does not require exogenous agents (though it is also compatible with molecular imaging probes). A miniaturized version of the technology is under development in order to further reduce barriers-to-access and ease-of-use.(42)
Therapeutic drug monitoring is ideally-suited for diffuse optical methods because it accentuates the strengths (functional, portable) and offsets the limitations (low spatial resolution). DOSI resolution limits are a consequence of multiple light scattering in a relatively large sample volume. As a result, diffuse optical methods provide macroscopically averaged tissue absorption and scattering properties at depths up to several centimeters. Consequently, the resolution of DOI methods is on the order of a few transport scattering lengths (~5mm–1cm) (37, 38, 43). However, the potential limitations of DOI/DOS in localizing small lesions are not important in characterizing neoadjuvant chemotherapy response in large, palpable stage II-IV tumors. This is due to the fact that DOSI is inherently a functional imaging technique that is highly sensitive to endogenous biochemical composition and tumor pathological response.(44)
Although DOSI lacks the specificity of conventional gene or protein-based biomarkers, measurements report tissue vascular and cellular physiology and metabolism. These quantitative functional endpoints may provide objective measures to predict therapeutic outcome and minimize toxicity in individual patients. Importantly, these results show that frequent, detailed functional imaging can provide new insights into the dynamics of tumor growth and regression. While the composite Tissue Optical Index (TOI) showed a significant overall decrease (~50%) during ~18 weeks of chemotherapy, daily tumor response was clearly sensitive to the mechanism of chemotherapy (i.e. anti-mitotic vs. anti-angiogenic) and time of measurement.
DOSI functional indices changed over 19 separate measurement days in a manner consistent with fluctuating patterns of cellular proliferation and death indicated, in part, by increasing and decreasing levels of ctHHb, respectively. These physiologic variations are difficult to follow in patients using conventional radiological methods and have been previously reported in animal models.(36) This information could be used to help guide clinical decision-making for individual patients. For example, the timing and type of the second stage of therapy could be optimally selected to coincide with phases of cellular proliferation or regression, depending on the desired outcome and drug mechanism. Similarly, timing of surgery could be selected to minimize the possibility of margin error and improve clinical outcome based on tumor physiological status.
Conclusion
In conclusion we have provided evidence that diffuse optical methods may be well-suited to frequent monitoring of chemotherapy response in breast cancer patients over long periods of time. Because DOSI is bedside-capable, it may offer novel opportunities for studying drug mechanisms in individual patients, and ultimately may be a useful tool for the development of drugs and dosing strategies. DOSI in conjunction with other imaging modalities may prove to be a valuable strategy for improving efforts to quantify therapeutic response to improve care in individual patients.
Acknowledgments
This work was supported by the National Institutes of Health under grants P41-RR01192 (Laser Microbeam and Medical Program: LAMMP), U54-CA105480 (Network for Translational Research in Optical Imaging: NTROI), U54CA136400, and NCI-2P30CA62203 (University of California, Irvine Cancer Center Support Grant). Additional support came from the California Breast Cancer Research Program. BLI programmatic support from the Beckman Foundation and the Air Force Research Laboratory, under agreement number FA9550-04-1-0101 is acknowledged. The authors wish to thank Montana Compton and Amanda F. Durkin for their assistance as well as the patient who generously volunteered her time for this study.
This study was presented at the John S. Leigh Memorial Symposium, Philadelphia, PA 2009
Footnotes
Author’s Contributions
A. C. wrote the paper and designed the study.
W. T. performed the DOSI measurements and processed the results.
R. M. provided assistance with study design and treated the case study patient.
D. H. provided assistance with study design and is the PI of the DOSI clinical protocol.
J. B. provided assistance with study design and patient care.
B. T. offered significant scientific oversight, co-writing and detailed proofreading of the manuscript.
Competing Interests
Patents
Bruce J. Tromberg and Albert E. Cerussi report patents, owned by the University of California, related to the technology and analysis methods described in this study. The DOSI instrumentation used in this study was constructed in a university laboratory using federal grant support (NIH).
Corporate
The University of California has licensed DOSI technology and analysis methods to 2 companies, FirstScan, Inc. and Volighten, Inc. for different fields of use, including breast cancer (FirstScan). Drs. Tromberg, Cerussi, and Hsiang are co-founders of Volighten, Inc., each with less than 5% ownership. This research was completed without participation, knowledge, or financial support of either company, and data was acquired and processed from patients by co-authors unaffiliated with either entity.
The IRB and Conflict of Interest Office of the University of California, Irvine have reviewed both patent and corporate disclosures and did not find any concerns. They requested that this information be made known when data from the protocol was presented.
Publisher's Disclaimer: This is a PDF file of an unedited manuscript that has been accepted for publication. As a service to our customers we are providing this early version of the manuscript. The manuscript will undergo copyediting, typesetting, and review of the resulting proof before it is published in its final citable form. Please note that during the production process errors may be discovered which could affect the content, and all legal disclaimers that apply to the journal pertain.
References
- 1.Wolff AC, Berry D, Carey LA, et al. Research issues affecting preoperative systemic therapy for operable breast cancer. J Clin Oncol. 2008;26:806–813. doi: 10.1200/JCO.2007.15.2983. [DOI] [PubMed] [Google Scholar]
- 2.Gralow JR, Zujewski JA, Winer E. Preoperative therapy in invasive breast cancer: reviewing the state of the science and exploring new research directions. J Clin Oncol. 2008;26:696–697. doi: 10.1200/JCO.2007.15.9459. [DOI] [PubMed] [Google Scholar]
- 3.Jones RL, Smith IE. Neoadjuvant treatment for early-stage breast cancer: opportunities to assess tumour response. Lancet Oncol. 2006;7:869–874. doi: 10.1016/S1470-2045(06)70906-8. [DOI] [PubMed] [Google Scholar]
- 4.Fisher B, Brown A, Mamounas E, et al. Effect of preoperative chemotherapy on local-regional disease in women with operable breast cancer: findings from National Surgical Adjuvant Breast and Bowel Project B-18. J Clin Oncol. 1997;15:2483–2493. doi: 10.1200/JCO.1997.15.7.2483. [DOI] [PubMed] [Google Scholar]
- 5.Bahri S, Chen JH, Mehta RS, et al. Residual breast cancer diagnosed by MRI in patients receiving neoadjuvant chemotherapy with and without bevacizumab. Ann Surg Oncol. 2009;16:1619–1628. doi: 10.1245/s10434-009-0441-5. [DOI] [PMC free article] [PubMed] [Google Scholar]
- 6.Baek HM, Chen JH, Nie K, et al. Predicting Pathologic Response to Neoadjuvant Chemotherapy in Breast Cancer by Using MR Imaging and Quantitative 1H MR Spectroscopy. Radiology. 2009 doi: 10.1148/radiol.2512080553. [DOI] [PMC free article] [PubMed] [Google Scholar]
- 7.Zakhireh J, Gomez R, Esserman L. Converting evidence to practice: a guide for the clinical application of MRI for the screening and management of breast cancer. Eur J Cancer. 2008;44:2742–2752. doi: 10.1016/j.ejca.2008.09.008. [DOI] [PubMed] [Google Scholar]
- 8.Ah-See ML, Makris A, Taylor NJ, et al. Early changes in functional dynamic magnetic resonance imaging predict for pathologic response to neoadjuvant chemotherapy in primary breast cancer. Clin Cancer Res. 2008;14:6580–6589. doi: 10.1158/1078-0432.CCR-07-4310. [DOI] [PubMed] [Google Scholar]
- 9.Meisamy S, Bolan PJ, Baker EH, et al. Neoadjuvant chemotherapy of locally advanced breast cancer: predicting response with in vivo (1)H MR spectroscopy--a pilot study at 4 T. Radiology. 2004;233:424–431. doi: 10.1148/radiol.2332031285. [DOI] [PubMed] [Google Scholar]
- 10.Martincich L, Montemurro F, De Rosa G, et al. Monitoring response to primary chemotherapy in breast cancer using dynamic contrast-enhanced magnetic resonance imaging. Breast Cancer Res Treat. 2004;83:67–76. doi: 10.1023/B:BREA.0000010700.11092.f4. [DOI] [PubMed] [Google Scholar]
- 11.Partridge SC, Gibbs JE, Lu Y, et al. MRI measurements of breast tumor volume predict response to neoadjuvant chemotherapy and recurrence-free survival. AJR Am J Roentgenol. 2005;184:1774–1781. doi: 10.2214/ajr.184.6.01841774. [DOI] [PubMed] [Google Scholar]
- 12.Duch J, Fuster D, Munoz M, et al. (18)F-FDG PET/CT for early prediction of response to neoadjuvant chemotherapy in breast cancer. Eur J Nucl Med Mol Imaging. 2009 doi: 10.1007/s00259-009-1116-y. [DOI] [PubMed] [Google Scholar]
- 13.Emmering J, Krak NC, Van der Hoeven JJ, et al. Preoperative [18F] FDG-PET after chemotherapy in locally advanced breast cancer: prognostic value as compared with histopathology. Ann Oncol. 2008;19:1573–1577. doi: 10.1093/annonc/mdn185. [DOI] [PubMed] [Google Scholar]
- 14.Mankoff DA, Dunnwald LK, Gralow JR, et al. Changes in blood flow and metabolism in locally advanced breast cancer treated with neoadjuvant chemotherapy. J Nucl Med. 2003;44:1806–1814. [PubMed] [Google Scholar]
- 15.Schelling M, Avril N, Nahrig J, et al. Positron emission tomography using [(18)F]Fluorodeoxyglucose for monitoring primary chemotherapy in breast cancer. J Clin Oncol. 2000;18:1689–1695. doi: 10.1200/JCO.2000.18.8.1689. [DOI] [PubMed] [Google Scholar]
- 16.Mankoff DA, O’Sullivan F, Barlow WE, et al. Molecular imaging research in the outcomes era: measuring outcomes for individualized cancer therapy. Acad Radiol. 2007;14:398–405. doi: 10.1016/j.acra.2007.01.005. [DOI] [PMC free article] [PubMed] [Google Scholar]
- 17.Tromberg BJ, Pogue BW, Paulsen KD, et al. Assessing the future of diffuse optical imaging technologies for breast cancer management. Med Phys. 2008;35:2443–2451. doi: 10.1118/1.2919078. [DOI] [PMC free article] [PubMed] [Google Scholar]
- 18.Cerussi A, Shah N, Hsiang D, et al. In vivo absorption, scattering, and physiologic properties of 58 malignant breast tumors determined by broadband diffuse optical spectroscopy. J Biomed Opt. 2006;11:044005. doi: 10.1117/1.2337546. [DOI] [PubMed] [Google Scholar]
- 19.Kukreti S, Cerussi A, Tromberg B, et al. Intrinsic tumor biomarkers revealed by novel double-differential spectroscopic analysis of near-infrared spectra. J Biomed Opt. 2007;12:020509. doi: 10.1117/1.2709701. [DOI] [PubMed] [Google Scholar]
- 20.Chung SH, Cerussi AE, Klifa C, et al. In vivo water state measurements in breast cancer using broadband diffuse optical spectroscopy. Phys Med Biol. 2008;53:6713–6727. doi: 10.1088/0031-9155/53/23/005. [DOI] [PMC free article] [PubMed] [Google Scholar]
- 21.Jakubowski DB, Cerussi AE, Bevilacqua F, et al. Monitoring neoadjuvant chemotherapy in breast cancer using quantitative diffuse optical spectroscopy: a case study. J Biomed Opt. 2004;9:230–238. doi: 10.1117/1.1629681. [DOI] [PubMed] [Google Scholar]
- 22.Zhu Q, Kurtzma SH, Hegde P, et al. Utilizing optical tomography with ultrasound localization to image heterogeneous hemoglobin distribution in large breast cancers. Neoplasia. 2005;7:263–270. doi: 10.1593/neo.04526. [DOI] [PMC free article] [PubMed] [Google Scholar]
- 23.Shah N, Gibbs J, Wolverton D, et al. Combined diffuse optical spectroscopy and contrast-enhanced magnetic resonance imaging for monitoring breast cancer neoadjuvant chemotherapy: a case study. J Biomed Opt. 2005;10:51503. doi: 10.1117/1.2070147. [DOI] [PubMed] [Google Scholar]
- 24.Choe R, Corlu A, Lee K, et al. Diffuse optical tomography of breast cancer during neoadjuvant chemotherapy: a case study with comparison to MRI. Med Phys. 2005;32:1128–1139. doi: 10.1118/1.1869612. [DOI] [PubMed] [Google Scholar]
- 25.Pham TH, Coquoz O, Fishkin JB, et al. Broad bandwidth frequency domain instrument for quantitative tissue optical spectroscopy. Rev Sci Instrum. 2000;71:2500–2513. [Google Scholar]
- 26.Bevilacqua F, Berger AJ, Cerussi AE, et al. Broadband absorption spectroscopy in turbid media by combined frequency-domain and steady-state methods. Appl Opt. 2000;39:6498–6507. doi: 10.1364/ao.39.006498. [DOI] [PubMed] [Google Scholar]
- 27.Cerussi AE, Jakubowski D, Shah N, et al. Spectroscopy enhances the information content of optical mammography. J Biomed Opt. 2002;7:60–71. doi: 10.1117/1.1427050. [DOI] [PubMed] [Google Scholar]
- 28.Mourant JR, Fuselier T, Boyer J, et al. Predictions and measurements of scattering and absorption over broad wavelength ranges in tissue phantoms. Appl Opt. 1997;36:949–957. doi: 10.1364/ao.36.000949. [DOI] [PubMed] [Google Scholar]
- 29.Cerussi A, Siavoshi S, Durkin A, et al. Effect of contact force on breast tissue optical property measurements using a broadband diffuse optical spectroscopy handheld probe. Appl Opt. 2009;48:4270–4277. doi: 10.1364/ao.48.004270. [DOI] [PMC free article] [PubMed] [Google Scholar]
- 30.Tromberg BJ, Shah N, Lanning R, et al. Non-invasive in vivo characterization of breast tumors using photon migration spectroscopy. Neoplasia. 2000;2:26–40. doi: 10.1038/sj.neo.7900082. [DOI] [PMC free article] [PubMed] [Google Scholar]
- 31.Pogue BW, Poplack SP, McBride TO, et al. Quantitative hemoglobin tomography with diffuse near-infrared spectroscopy: pilot results in the breast. Radiology. 2001;218:261–266. doi: 10.1148/radiology.218.1.r01ja51261. [DOI] [PubMed] [Google Scholar]
- 32.Franceschini MA, Moesta KT, Fantini S, et al. Frequency-domain techniques enhance optical mammography: initial clinical results. Proc Natl Acad Sci U S A. 1997;94:6468–6473. doi: 10.1073/pnas.94.12.6468. [DOI] [PMC free article] [PubMed] [Google Scholar]
- 33.Chance B, Nioka S, Zhang J, et al. Breast cancer detection based on incremental biochemical and physiological properties of breast cancers: a six-year, two-site study. Acad Radiol. 2005;12:925–933. doi: 10.1016/j.acra.2005.04.016. [DOI] [PubMed] [Google Scholar]
- 34.Taroni P, Danesini G, Torricelli A, et al. Clinical trial of time-resolved scanning optical mammography at 4 wavelengths between 683 and 975 nm. J Biomed Opt. 2004;9:464–473. doi: 10.1117/1.1695561. [DOI] [PubMed] [Google Scholar]
- 35.Cerussi A, Hsiang D, Shah N, et al. Predicting response to breast cancer neoadjuvant chemotherapy using Diffuse Optical Spectroscopy. Proc Natl Acad Sci U S A. 2007;104:4014–4019. doi: 10.1073/pnas.0611058104. [DOI] [PMC free article] [PubMed] [Google Scholar]
- 36.Casanovas O, Hicklin DJ, Bergers G, et al. Drug resistance by evasion of antiangiogenic targeting of VEGF signaling in late-stage pancreatic islet tumors. Cancer Cell. 2005;8:299–309. doi: 10.1016/j.ccr.2005.09.005. [DOI] [PubMed] [Google Scholar]
- 37.Gandjbakhche AH, Nossal R, Bonner RF. Resolution limits for optical transillumination of abnormalities deeply embedded in tissues. Med Phys. 1994;21:185–191. doi: 10.1118/1.597298. [DOI] [PubMed] [Google Scholar]
- 38.Pogue BW, Davis SC, Song X, et al. Image analysis methods for diffuse optical tomography. J Biomed Opt. 2006;11:33001. doi: 10.1117/1.2209908. [DOI] [PubMed] [Google Scholar]
- 39.Li A, Liu J, Tanamai W, et al. Assessing the spatial extent of breast tumor intrinsic optical contrast using ultrasound and diffuse optical spectroscopy. J Biomed Opt. 2008;13:030504. doi: 10.1117/1.2937471. [DOI] [PMC free article] [PubMed] [Google Scholar]
- 40.Yeh E, Slanetz P, Kopans DB, et al. Prospective comparison of mammography, sonography, and MRI in patients undergoing neoadjuvant chemotherapy for palpable breast cancer. AJR Am J Roentgenol. 2005;184:868–877. doi: 10.2214/ajr.184.3.01840868. [DOI] [PubMed] [Google Scholar]
- 41.Warren RM, Bobrow LG, Earl HM, et al. Can breast MRI help in the management of women with breast cancer treated by neoadjuvant chemotherapy? Br J Cancer. 2004;90:1349–1360. doi: 10.1038/sj.bjc.6601710. [DOI] [PMC free article] [PubMed] [Google Scholar]
- 42.No KS, Kwong R, Chou PH, et al. Design and testing of a miniature broadband frequency domain photon migration instrument. J Biomed Opt. 2008;13:050509. doi: 10.1117/1.2998473. [DOI] [PMC free article] [PubMed] [Google Scholar]
- 43.Boas DA, O’Leary MA, Chance B, et al. Detection and characterization of optical inhomogeneities with diffuse photon density waves: a signal-to-noise analysis. Appl Opt. 1997;36:75–92. doi: 10.1364/ao.36.000075. [DOI] [PubMed] [Google Scholar]
- 44.Cerussi A, Hsiang D, Shah N, et al. Predicting response to breast cancer neoadjuvant chemotherapy using diffuse optical spectroscopy. Proc Natl Acad Sci U S A. 2007;104:4014–4019. doi: 10.1073/pnas.0611058104. [DOI] [PMC free article] [PubMed] [Google Scholar]