Abstract
A linear model is used to show that dynamic field gradient focusing (DFGF) can be scaled to preparative capacity, ~O (10 mgs). This paper explains how the preparative-scale DFGF apparatus was designed and fabricated. Scaled-down experiments and mathematical modeling guided material selection and design changes during construction to increase the probability that the prototype preparative-scale DFGF apparatus would perform as intended. The finished prototype successfully focused bovine hemoglobin from an initial concentration of 6.82 to 15 mg/mL and allowed for 86% recovery of injected protein.
1. Introduction
Dynamic field gradient focusing (DFGF) concentrates proteins and separates them according to their electrophoretic mobilities, as demonstrated at the analytical scale (1, 2). Separating proteins by their mobilities, rather than by their isoelectric points, enables DFGF to use native buffers instead of expensive carrier ampholytes. Using native buffers helps to keep proteins soluble at high concentrations, avoiding the precipitation problem often associated with isoelectric focusing (IEF). In addition, using native buffers should allow for recovery of proteins without sacrificing biological activity. Prior work with an analytical-scale DFGF instrument also demonstrates DFGF’s most unique characteristic: the ability to manipulate the focused protein bands during a run to enhance resolution, peak capacity, or recovery as the operator sees fit. That feature should be particularly useful for separating mixtures of highly similar proteins, such as isoforms. A preparative-scale DFGF apparatus can potentially separate milligram quantities of protein isoforms (3), since isoforms have distinct, though small, differences in primary structure, surface charge, or glycosylation that give them unique electrophoretic mobilities.
The theory behind DFGF shows that it belongs to the family of equilibrium-gradient methods (EGMs) (4), which includes IEF and density gradient sedimentation (5, 6). Equilibrium gradient methods rely on a net force that reverses direction at some point in the separation chamber to push analytes to their individual focal points (5). In a vertically oriented DFGF chamber, a constant flow of buffer pumped into the base of the separation chamber pushes analytes upward with a constant velocity. Simultaneously, a computer-controlled electric field gradient imparts a unique downward velocity to each analyte in proportion to the field strength and the analyte’s electrophoretic mobility. The strength of the electric field increases with the height of the separation chamber so that the downward velocity is greatest at the top of the chamber and weakest at the bottom. At the top of the chamber the downward velocity due to the electric field exceeds the counter-flow, so the net velocity pushes the analytes down the chamber. In contrast, the downward velocity at the bottom of the chamber is less than the counter-flow, so the net velocity pushes analytes up the separation chamber. Each analyte focuses in the chamber at the height where its net velocity changes direction.
The preparative-scale DFGF instrument described in this paper originated from the design of the vortex-stabilized electrophoresis chamber (7). The annular nature of the separation chamber in these devices often draws comparisons to the Biostream or the Rotofor, which also possess annular separation chambers. However, the Biostream and the Rotofor function quite differently from the vortex-stabilized electrophoresis chamber, as Ivory has explained in detail (7). In brief, the Biostream only performs zone electrophoresis radially and has no vortices, while the vortex-stabilized electrophoresis chamber separates analytes axially by zone electrophoresis, IEF (8, 9), ITP (submitted to JSS), or true moving bed electrophoresis (10, 11). The Rotofor separates proteins axially, but only by IEF, and it requires long run times because its cooling design limits it to low power densities. The preparative-scale DFGF instrument described in this paper differs from the Biostream, Rotofor, and vortex-stabilized electrophoresis chamber because it was designed specifically to perform DFGF, rather than the more conventional electrophoretic techniques employed by the aforementioned devices.
2. Instrument Design
2.1. Key Scaling Criteria
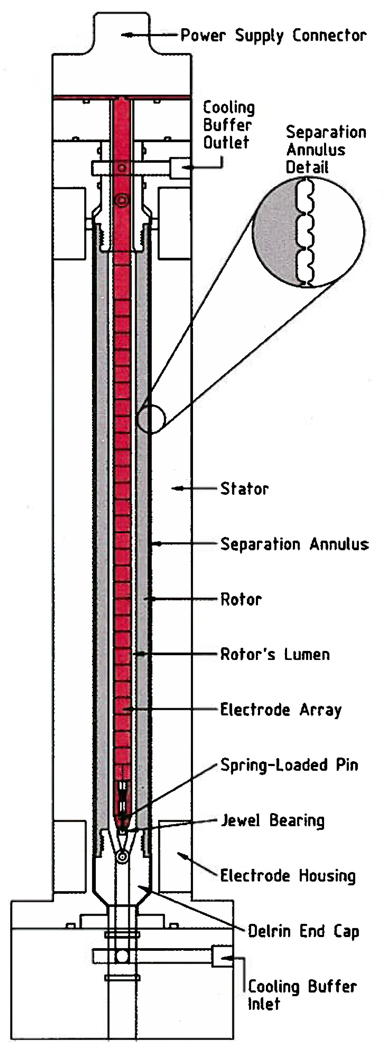
Three key considerations governed the design of the preparative-scale DFGF instrument (3). Two of the criteria, temperature control and peak dispersion, are common to all preparative electrophoresis equipment regardless of their mode of operation (12). The third criterion, specific to DFGF, was to have an adjustable electric field gradient in the separation annulus. Figure 1 shows a cross-section of the preparative-scale DFGF instrument’s separation tower that was designed to satisfy all three criteria (3). The counter-rotating vortices generated by the rotor provide a stable fluid flow profile that controls dispersion in the separation annulus (7). Cooling buffer chilled by an external heat exchanger flows through the rotor’s lumen to keep the ceramic rotor cold, which then cools the separation annulus (7). Prior modeling (3) showed that using ground electrodes in the upper end of the stator and a parabolic voltage profile on the electrode array in the rotor’s lumen generated an electric field in the annular separation chamber capable of resolving milligrams of proteins that differ in electrophoretic mobility by as little as 5%.
Figure 1.
Cross section showing the primary parts of the preparative-scale DFGF instrument’s separation tower.
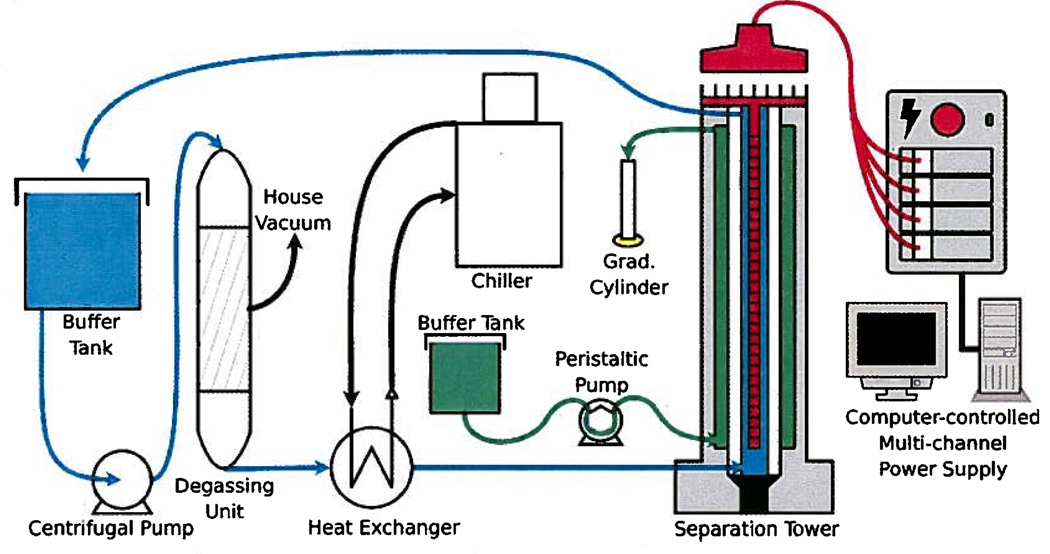
Figure 2 shows several ancillary systems that enable the preparative-scale DFGF instrument to work, specifically equipment for generating the electric field gradient and cooling and degassing the buffer that flows through the rotor’s lumen. All the equipment taken together comprises the preparative-scale DFGF apparatus. The design of the ancillary systems was completed after the rotor’s design was settled because the thermal conductivity and effective electrical conductivity of the rotor influence the passage of heat and electricity, while the geometry of the rotor influences the flow rates in the rotor’s lumen and dispersion in the separation annulus. The design of the novel rotor and multichannel power supply are described next, and the design of the heat exchanger and degassing module can be found in the Supporting Information accompanying this paper.
Figure 2.
Computer-controlled, multichannel power supply that established and maintained the electric field gradient on the 32 electrodes mounted to the electrode array in the center of the rotor. The electrical current passed through the rotor and made an electric field gradient in the separation annulus. A centrifugal pump circulated cooling buffer through a degassing unit, a heat exchanger, and then through the rotor’s lumen so that the buffer could cool the separation chamber and purge electrolysis gases produced on the electrode array. A small peristaltic pump generated the counter-flow in the separation annulus.
2.2. The Rotor
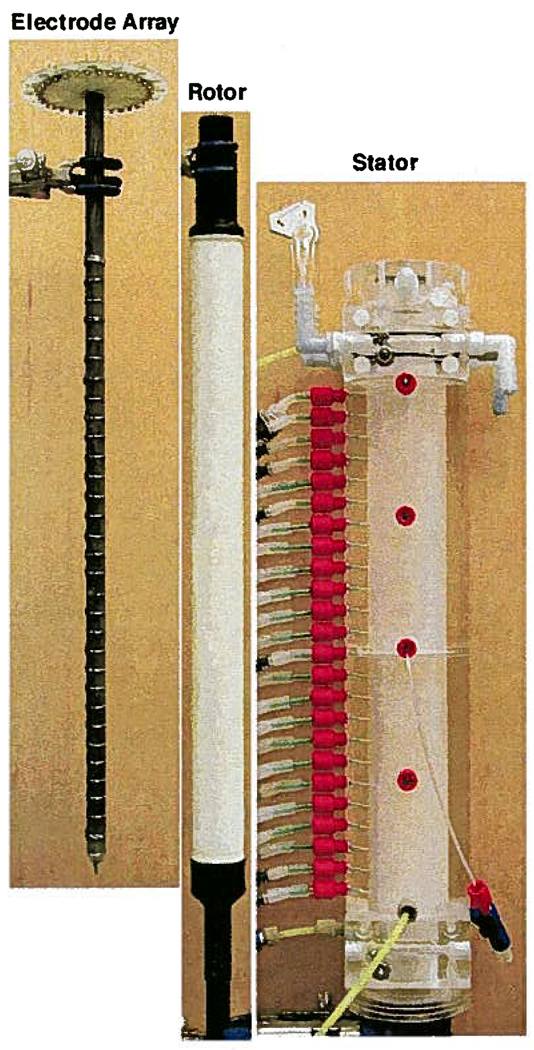
The critical role of the rotor in the preparative-scale DFGF design spurred us to rigorously test the planned rotor design, as detailed in Supporting Information, prior to fabricating the rest of the apparatus. This allowed the rotor’s design to be refined at minimal cost without having to redesign the entire device. The rotors were fabricated in the following manner. Rods of AX05-grade boron nitride (Saint-Gobain, Amherst, NY) were bored out to have 1.27 cm i.d., turned down to have an o.d. of 2.413 cm and cut down to 29.083 cm long. The ends were threaded and then pressure-filled with a low-viscosity epoxy to prevent stress cracks. Delrin end-caps, fabricated according to the drawing in Figure 1 with a ring of holes drilled radially into them to give the cooling buffer access to the rotor’s lumen, were screwed into the rotor. Next, the rotor was mounted in a lathe and a thin, 29 cm long aluminum blade was set 0.35 mm off the surface of the ceramic so that the membrane would have a uniform thickness. The lathe was turned at 60 rpm while the viscous, wet membrane solution was poured over the ceramic portion of the rotor. Soaking the rotor axially in water for 24 h, after removing it from the lathe, accomplished the phase inversion process that formed the asymmetric polysulfone membrane. Figure 3 shows a completed rotor, along with the electrode array and the stator. The three pieces fit together to form the separation tower of the preparative-scale DFGF instrument. The rotor was turned within the stator by 1/17 hp right-angle drive DC gearmotor (Leeson Electric Corporation, Grafton, WI) that provided 19 in.-lbs of torque. The speed of rotation was set at 60 rotations per minute using a DART Controls micro-drive (Zionsworth, IN).
Figure 3.
The electrode array slides into the membrane-coated, porous ceramic rotor. The rotor is sealed into the stator by 2 Viton o-rings on each of the black, Delrin end-caps. The annular gap between the rotor and stator forms the separation annulus. The rear of the stator points to the left to show the sample off-take ports that span the height of the annulus. The counter-flow buffer enters the separation annulus by the lowest port on the rear of the stator and exits out the top port. Samples were injected into the center of the separation annulus through the valve shown in the bottom right. Also visible near the top of the stator is one of the cathodic electrode housings with barbed fittings for connecting the tubes that carry the purge buffer.
2.3. Electric Field Gradient Generation
Previous modeling (3) showed that the desired electric field profiles for swift, high-resolution separations required an adjustable parabolic voltage profile with a peak voltage of 5 kV. Generating a parabolic voltage profile on the electrode array required a multichannel power supply and a series of discrete electrodes on the array in the rotor’s lumen. Each channel had to be individually governed by a central controller in order to maintain a steady voltage profile on the electrodes. A linear model was used to generate the design voltage and amperage specifications for this multi-channel, computer-controlled power supply. The linear model for the electric field gradient (3) was modified and rerun using 32 discrete electrodes on the array instead of one continuous electrode. We selected 32 electrodes with the expectation that no single channel would have to supply an untenable potential or amperage. The results showed that the multichannel power supply needed to provide a total of 5 kV and 140 mA to produce the electric field gradients used in simulated protein separations (3). In particular, the channel for the upper-most electrode on the array needed to provide 1000 V and 57 mA to prevent the formation of a defocusing zone (3) that would smear the protein bands. These requirements turned out to be unachievable with available off-the-shelf technology, so the design had to be scaled back to 150 V and 16 mA per channel.
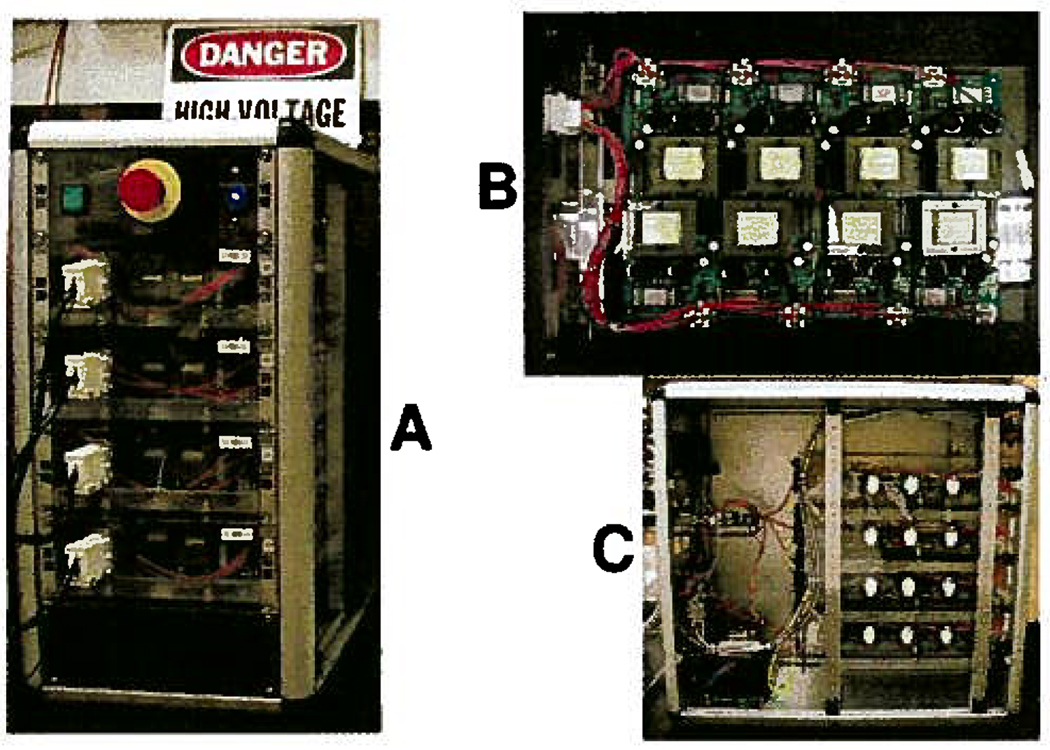
Figure 4 shows the proprietary, commercial-grade multichannel power supply, i.e., electric field controller, co-developed by Protasis Corporation (Marlborough, MA) and Medicept, Inc (Ashland, MA) for our use. For safety, the high voltage circuitry was optically isolated from the communication module and was indirectly turned on through high voltage relays to protect the module and the computer. In addition, the controlling software stepped up the high voltage until the voltage set points were reached, rather than applying the full potential instantly. On the font panel, there was a large, red emergency stop switch to cut the power from the source. All of the electronics were UL certified and also met strict medical electronics standards, i.e., FDA Quality System regulations and ISO 13485:2003.
Figure 4.
Front of the controller (A), showing the large red kill switch for safety. The four white connectors attach the electrode array to the controller. The miniature transformers take up most of the space on the PCB (B). Opening the side of the case (C) shows the communication module to the left of the top two PCBs.
The controller consisted of a communication module and 32 serially connected, individually controlled voltage channels that energized the 32 electrodes on the array inside the rotor. The ground electrode of the electric field controller connected to the cathodic electrodes in the stator. Electrode 1 was the uppermost electrode on the rotor array and electrode 32 was at the bottom of this array, with the intervening electrodes spaced 8.237 mm apart.
The communication module in the controller was an embedded system consisting of a CPU, a TCP/IP communication chip set with an Ethernet port, an RS-232 serial port, and multiplexers. This module communicated with a personal computer through a serial cable. The user specified the voltage for each of the 32 channels using a LabVIEW 6.0 (National Instruments, Austin, TX) program that provided the interface for the communication module. In turn, the communication module distributed the desired voltage settings to the individual voltage control channels.
Each voltage channel had an output range of ±150 V and was regulated by its own microprocessor (Silicon Laboratories, Austin, TX). Connected serially, the total voltage span across the 33-electrode array could reach 4800 V. The controller and all of its channels were capable of polarity switching on-the-fly because each channel was transformer-isolated at the power entry side. Changing polarity in the middle of a run would allow positively and negatively charged molecules to be focused at the same time, which cannot be done in any other electrophoretic instrument. Miniature isolation transformers were custom made to reduce the size of the circuitry and had a 5 kV minimum insulation rating. Power op-amps (Apex Microtechnology Corp., Tucson, AZ) were used for the output stage of the channel and were able to generate or sink 16 mA at 150 V. The 32 power channels were evenly distributed on four printed circuit boards (PCBs). Each PCB was mounted in a standard 9 in. half-rack module and then fit into a rack enclosure, as shown in Figure 4.
The controller set the potential on an array of 32 platinum ring-electrodes shown in Figures 3 and 5. The electric field gradient reached the annular chamber by passing through the membrane-coated rotor that acted as a barrier to prevent the proteins in the sample from touching the electrodes. Cooling buffer pumped through the rotor’s lumen removed Joule heat from the separation annulus and gas bubbles from the electrode surfaces. The Supporting Information contains the design details for the equipment used to cool and degas the cooling buffer.
Figure 5.
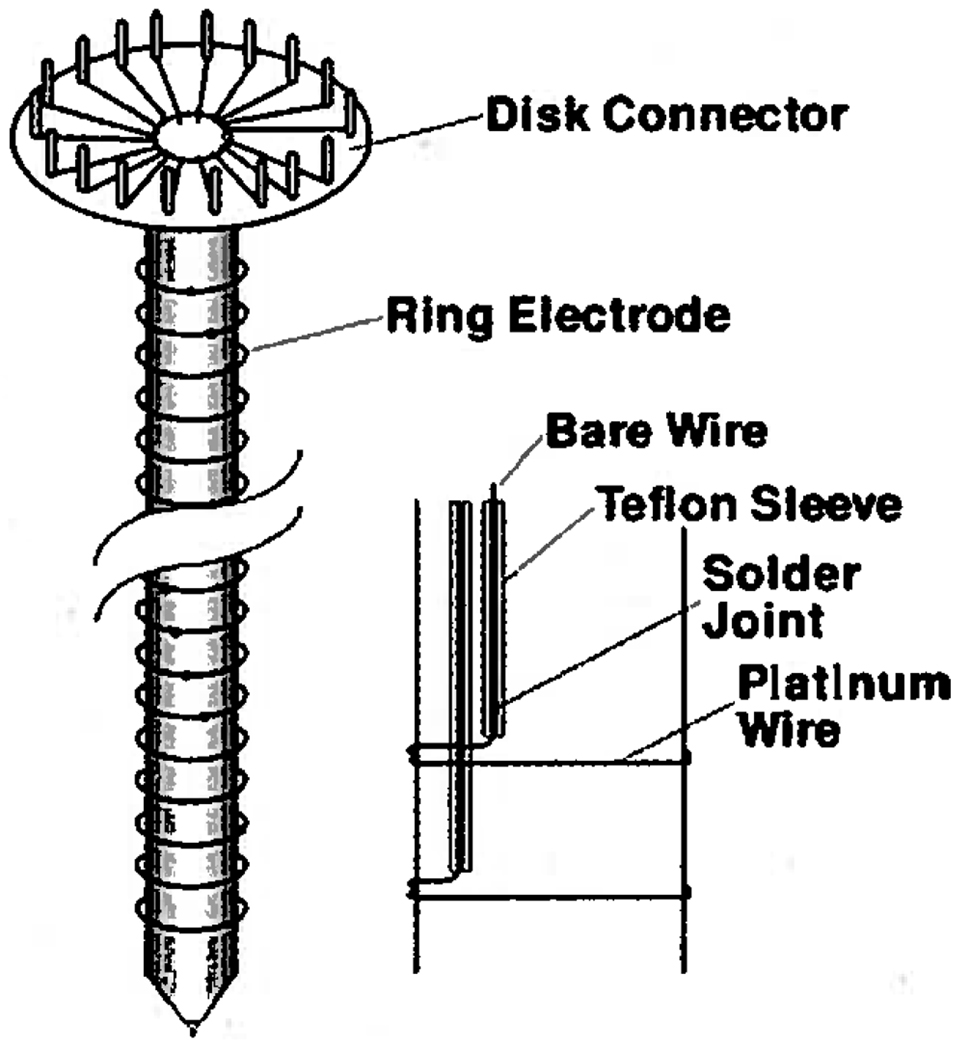
Internal construction of the electrode array. Each electrode connects to a pin on the Disk Connector.
The electrode assembly (Figure 5) consisted of a disk-shaped connector, a 7.62 mm PVC tube, and a series of ring electrodes made by wrapping 0.25 mm o.d. platinum wire (David H. Fell Co., City of Commerce, CA) twice around the rod. One end of each platinum wire entered into the tube where a solder joint made with silver-bearing solder connected the platinum electrode to a 30-gauge wire-wrapping wire (Jonard Industries, Tuckahoe, NY) sleeved in Teflon tubing (PTFE, 0.45 mm i.d., Alpha Wire Company). The Teflon-sleeved wires connected each electrode to a pin mounted on the disk connector at the top of the assembly. Sheathing the connecting wires in Teflon turned out to be essential to the success of this approach because the 0.22 mm thin wall provided insulation up to 7 kV. Subsequently, the wire-filled PVC tube was filled with DP-190 epoxy (3M, St. Paul, MN), after which the bottom cap containing the centering pin was inserted while the epoxy was fluid. The epoxy filling gives the PVC tube added rigidity and protects the solder joints from the buffer. The electrode array slides down the center of the smooth, polysulfone-coated boron nitride rotor and is centered by a spring-loaded steel pin in the end of the array (see Figure 1) which nests in a sapphire bearing located in the rotor’s lower Delrin end-cap.
2.4. Revisions
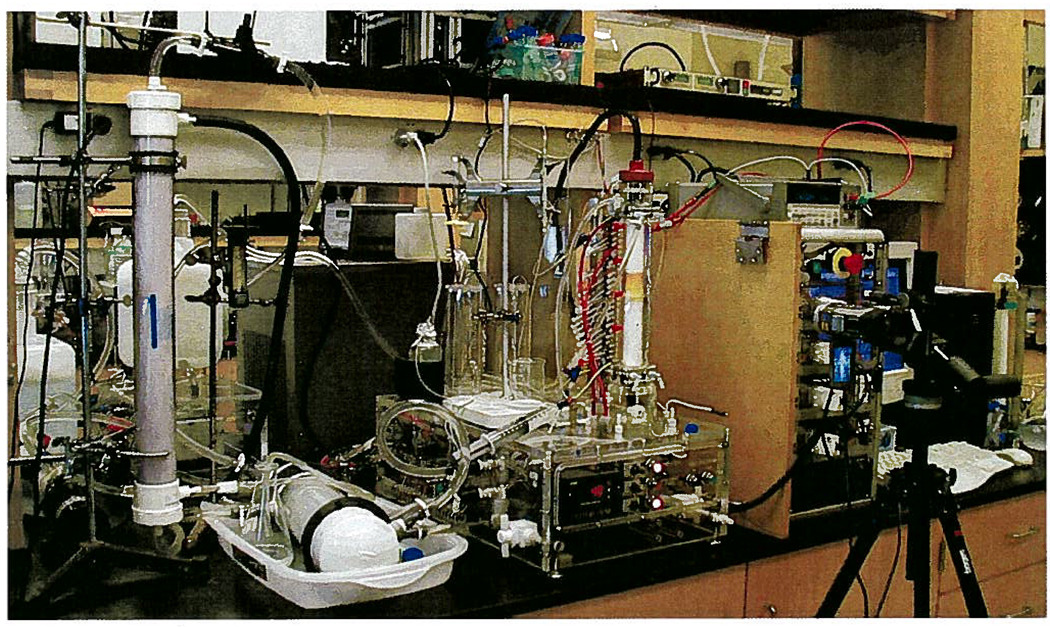
Two unexpected problems arose while testing the completed preparative-scale DFGF apparatus shown in Figure 6. First, the counter-flow in the separation annulus was so fast that bovine hemoglobin (Hb) could not be focused, even after turning off the peristaltic pump. Second, the membrane rose off the surface of the rotor in patches like blisters. The blisters shrank back down somewhat when the electric field was turned off, suggesting that radial electroosmotic flow (EOF) through the rotor was responsible for blistering the membrane. Electroosmotic flow into the rotor would add to the counter-flow provided by the peristaltic pump, explaining why there was a counter-flow when the peristaltic pump was turned off. However, the rotameter (no. 10, Gilmont Instruments, Great Neck, NY) on the outlet of the separation annulus was registering flow even after turning off both the electric field and the peristaltic pump, indicating there was at least a second source to the radial trans-rotor flow.
Figure 6.
The preparative-scale DFGF apparatus corresponding to Figure 2. The 20-L cooling buffer reservoir can be seen on the left edge of the photograph. The hollow-fiber degassing module is vertically mounted on a ring stand in the left fore-ground. The heat exchanger is in a plastic tub to the right of the hollow-fiber module and the large gray chiller can be seen behind the heat exchanger. In the center is the clear, acrylic base and separation tower of the preparative-scale DFGF instrument. The cap on the separation tower connected the electrode array in the rotor’s lumen to the multichannel power supply seen on the right of the preparative-scale DFGF instrument. The Spellman power supply is on the shelf above the multichannel power supply. Directly behind the hollow-fiber module is a 10 L reservoir for the purge buffer that flows through the stator electrode housings. A video camera in the right fore-ground recorded the position of the protein over time.
The sources of the trans-rotor flow were surprising. It turned out that the pressure required for a high axial flow rate of cooling buffer in the rotor’s lumen caused fluid to flow radially through the rotor and into the separation annulus, despite past experiences with AX05 grade boron nitride, which required more than 100 kPa to drive any noticeable radial flow. More testing (data not given) on the rotor confirmed that the EOF was from anode to cathode, opposite from the direction seen while testing boron nitride discs.
Minimizing the radial, trans-rotor flow to allow protein focusing and avoid blistering the membrane required decreasing the flow rate in the rotor’s lumen and altering the surface charge of the ceramic. A combination control valve and flow meter (model B-633, Porter Instrument Company, Hatfield, PA) was installed on the cooling buffer line between the degassing module and the heat exchanger. The flow rate through the rotor’s lumen was decreased to 375 mL/min, at which point no flow was visible in the rotameter on the outlet of the separation annulus, indicating there was no measurable pressure driven radial flow through the rotor.
The linear models used to design the apparatus (3) showed that the slower cooling buffer flow rate could only dissipate 200 W of Joule heat while keeping the entire separation annulus below 24 °C. Still, that was plenty of cooling capacity, considering that modeling the planned run conditions showed only 7 W of Joule heat would be produced.
The EOF into the separation annulus was eliminated by using a mixture of CTAB and SDS (13) to dynamically coat the surface of the rotor with a positive charge. Testing various ratios of CTAB and SDS (data not given) showed that flushing the rotor with cooling buffer containing 0.105 mM CTAB and 0.035 mM SDS and adding the surfactants at the same concentrations to the cooling and counter-flow buffers during the run caused the EOF to reverse direction and flow into the rotor’s lumen. Reversing the direction of the radial, trans-rotor flow so that it went into the rotor allowed us to test whether the apparatus could trap and retain a test protein.
3. Materials and Methods
3.1. Chemicals
The following chemicals were used while testing the preparative-scale DFGF apparatus’ ability to focus a protein. Cetyltrimethylammonium bromide (CTAB) and bovine hemoglobin were purchased from Sigma-Aldrich (St. Louis, MO). Tris base and glacial acetic acid were bought from Fisher Scientific (Fair Lawn, NJ), and sodium dodecylsulfate (SDS) was from Bio-Rad Laboratories (Hercules, CA). Water was obtained from a Barnstead Thermolyne (Dubuque, IA) Nanopure Infinity UV/UF system. The working buffer used in the focusing experiments was mixed in batches of 30 L. Each batch contained 10 mM tris, 0.105 mM CTAB, 0.035 mM SDS, and 2.841 mL of glacial acetic acid dissolved in Nanopure water. The buffer’s pH was 8.8 and its conductivity was 120 µS/cm, both measured at 25 °C. The batch of buffer was split into thee volumes for cooling the rotor, purging the electrolysis gas in the stator electrode housings, and providing the counter-flow.
3.2. Equipment
Protein focusing occurred in the buffer-filled, annular, vortex-stabilized, separation chamber that was formed by the gap between a smooth, polysulfone-coated, porous boron nitride rotor and a grooved, acrylic stator. The grooves in the stator encouraged the formation of counter-rotating vortex pairs that reduced axial dispersion in the separation chamber at the expense of radial mixing. Focusing took place vertically in the 18-mL chamber, which was 29.083 cm long and averaged 0.762 mm wide. A set of 24 off-take ports spanned the height of the separation chamber so that samples could be taken using 1-mL syringes individually attached to each port by 0.75 mm i.d. PEEK tubing (Upchurch Scientific, Oak Harbor, WA). The counter-flow was produced by an Instech (Plymouth Meeting, PA) OEM P625/275 peristaltic pump using 0.762-mm silicone tubing and entered the bottom of the annular chamber by 1.5 mm i.d. FEP tubing (Upchurch Scientific, Oak Harbor, WA). The counter-flow exited at the top of the chamber by the same size tubing and was collected in a 10-mL graduated cylinder. A PC with a PCI-DAS 1002 multifunction A/D I/O board (Measurement Computing, Middleboro, MA) controlled the flow rate of the peristaltic pump using a LabVIEW 6.0 program (National Instruments, Austin, TX). Protein was injected into the annulus at h = 15 cm through 0.75 mm i.d. FEP tubing (Upchurch Scientific, Oak Harbor, WA) using a 1-mL syringe which was connected to the tubing by a luer-lock fitting in a shut-off valve (Upchurch Scientific, Oak Harbor, WA).
A computer-controlled, multichannel power supply adjusted the current leaving the electrodes in the rotor’s lumen to maintain a steady, user-specified electric field gradient in the separation chamber. The two cathodic electrodes housed in the stator were attached to the high-voltage line of a Spellman (Hauppauge, NY) model SL 2PN300 power supply with the polarity reversed to provide a negative potential because channel 1 of the multichannel power supply could not supply enough voltage to keep the electric field gradient from decreasing between the stator electrodes and the uppermost electrode on the array (electrode 1). This arrangement required the two power supplies to share a common ground, so the ground line of the Spellman power supply was connected to the ground line of the multichannel power supply. Dialysis membranes (cat. no. 0866619, Fisher Scientific, Fair Lawn, NJ) with a 6000 MWCO were cut to size and separated the contents of the electrode housings from the annular separation chamber. Equipment for removing the Joule heat and gases generated by the electrical current in the buffer are described in Supporting Information.
3.3. Focusing
The four experimental runs started by preparing 30 L of the working buffer: 0.105 mM CTAB and 0.035 mM SDS in 10 mM Tris acetate buffer at pH 8.8. The 20-L cooling buffer reservoir and 250-mL bottle for the counter-flow buffer were filled with the working buffer, and the balance of the 30 L of working buffer was poured into the 10-L reservoir for purging gases in the stator electrode housings. The March pumps were switched on, the valve connecting the house vacuum to the shell side of the hollow-fiber module was opened, and the air was bled out of all fluid lines. The control valve governing the buffer flow rate through the rotor’s lumen was set to allow 375 mL/min. The peristaltic pump providing the annular counter-flow was set to provide 0.147 mL of buffer per minute. Ten milligrams of Hb dissolved in 1 mL of working buffer was injected into the center of the annular chamber after verifying that the chamber was filled with buffer and free of air bubbles. Then, the electrodes on the array in the rotor and the housings in the stator were switched on. Table 1 lists the electrode height, voltage set at that electrode, and the voltage provided by each channel of the multichannel power supply. The cathodic electrodes in the stator (electrode 1) attached to the Spellman power supply were set to −200 V. The voltage from the first channel of the power supply adds to the potential on electrode 1, the voltage from channel 2 adds to the potential on electrode 2, and so on down the array. After focusing for 2 h the focused protein band was collected using the 1 mL syringes attached to the back of the stator. A digital video camera with a Carl Zeiss Vario-Sonnar T* lens (model DCR-PC120BT, Sony Electronics, Inc., Oradell, NJ) recorded the position of the protein during the run.
Table 1.
Electrode Voltage Settings
| voltage (V) |
|||
|---|---|---|---|
| n | nth electrode height (cm) | nth electrode | nth channel |
| 1 | 27.63 | 0.0 | 0.0 |
| 2 | 26.81 | 50.0 | 50.0 |
| 3 | 25.98 | 98.4 | 48.4 |
| 4 | 25.16 | 145.1 | 46.7 |
| 5 | 24.33 | 190.2 | 45.1 |
| 6 | 23.51 | 233.7 | 43.5 |
| 7 | 22.69 | 275.5 | 41.8 |
| 8 | 21.86 | 315.7 | 40.2 |
| 9 | 21.04 | 354.3 | 38.6 |
| 10 | 20.22 | 391.2 | 36.9 |
| 11 | 19.39 | 426.5 | 35.3 |
| 12 | 18.57 | 460.2 | 33.7 |
| 13 | 17.74 | 492.2 | 32.0 |
| 14 | 16.92 | 522.6 | 30.4 |
| 15 | 16.10 | 551.4 | 28.8 |
| 16 | 15.27 | 578.5 | 27.1 |
| 17 | 14.45 | 604.0 | 25.5 |
| 18 | 13.63 | 627.9 | 23.9 |
| 19 | 12.80 | 650.1 | 22.2 |
| 20 | 11.98 | 670.7 | 20.6 |
| 21 | 11.16 | 689.7 | 19.0 |
| 22 | 10.33 | 707.0 | 17.3 |
| 23 | 9.51 | 722.7 | 15.7 |
| 24 | 8.68 | 736.8 | 14.1 |
| 25 | 7.86 | 749.2 | 12.4 |
| 26 | 7.04 | 760.0 | 10.8 |
| 27 | 6.21 | 769.2 | 9.2 |
| 28 | 5.39 | 776.7 | 7.5 |
| 29 | 4.57 | 782.6 | 5.9 |
| 30 | 3.74 | 786.9 | 4.3 |
| 31 | 2.92 | 789.5 | 2.6 |
| 32 | 2.10 | 790.5 | 1.0 |
3.4. Data Collection and Analysis
The focused Hb band was collected at the end of the run to measure how much of the injected protein could be recovered after focusing in the preparative-scale DFGF instrument. Protein collection at the end of the run started by drawing fractions with the uppermost syringe, followed by the one beneath it until the column had been drained to 3 ports below the bottom of the protein band, e.g., fraction collection would stop after the 15th syringe if the bottom of the protein band was near the 12th sample off-take port. Attempting to fractionate run 1 with no counter-flow led to incomplete sample collection because the protein band was smeared downward as fractions were collected, always leaving a trace of Hb in the column. Therefore the counter-flow was left on during fractionation for runs 2–4 to ensure that all of the protein was collected. The side effect of collecting the protein with counter-flow was that the total collected volume at the end of a run varied from 2.6 to 3.4 mL. The two fractions containing the focused Hb band were pooled with the three fractions above them and the three below to make sure that all of the Hb was withdrawn at the end of the run. The pool of 8 fractions was analyzed at 5x dilution using a Perkin-Elmer (Waltham, MA) VICTOR3 plate reader to measure absorbance at 405 nm. The absorbance reading was compared to a standard curve to find the concentration of Hb in the pooled fractions. The mass recovered at the end of the run was calculated by multiplying the volume of the pooled fractions by the concentration of the pooled fractions. The recovery from the three successful fractionations (runs 2–4) was used to calculate the mean recovery and a 95% confidence interval about the mean, assuming the results were part of a normal distribution.
4. Results
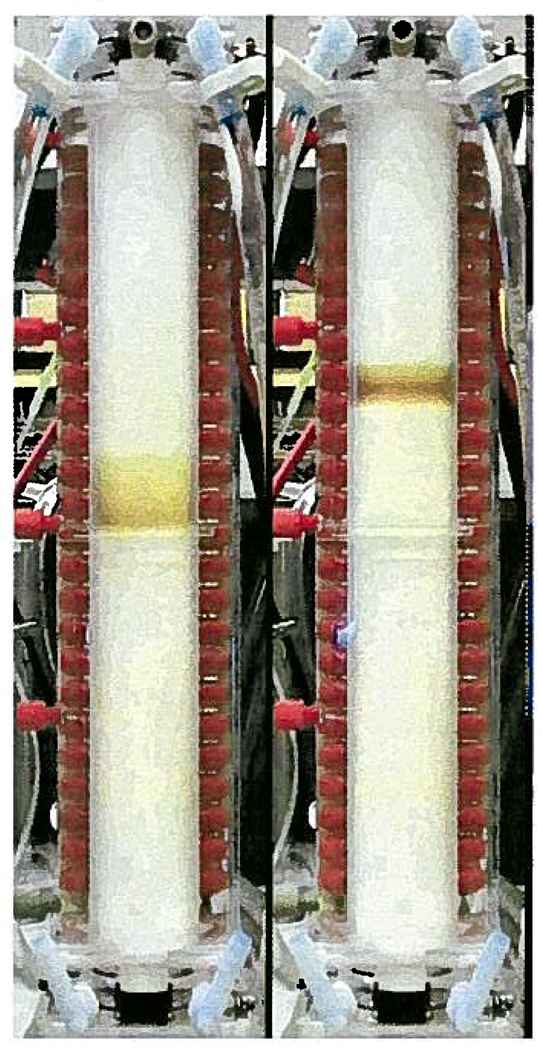
Four Hb focusing experiments were performed to verify that the preparative-scale DFGF apparatus could focus and hold a protein. Frame grabs from the video camera show the Hb when it was injected at the start of run 1 (Figure 7, left side) and after it had focused at the end of the 2-h run (Figure 7, right side). The injected Hb band was 2.42 cm tall, with an average concentration of 6.82 mg/mL. After focusing for 2 h the Hb band was about 1.1 cm tall and had an average concentration of approximately 15 mg/mL. The band clearly shows a darker region in the center where the Hb concentration reached just over 40 mg/mL, assuming the concentration profile was a Gaussian distribution centered in the middle of the protein band with all 10 mg in the visible region of the band. The average concentration of the focused band at the end of the run was 220% greater than the concentration of the band after injection. The injected and focused bands in runs 2–4 all looked similar to Figure 7.
Figure 7.
(Left) Ten milligrams of Hb injected at the start of run 1 with an initial concentration of 6.82 mg/mL. (Right) Focused protein band at the end of the 2 h run showing that the instrument could focus and retain a protein. The ending concentration was 15 mg/mL.
The focusing experiments also provided an opportunity to measure the recovery of protein collected from the annular chamber with a series of syringes. Table 2 shows the data used to calculate the mean recovery. Recall that sample collection was incomplete for run 1, so those data have been discarded. The average recovery for runs 2–4 was 86 ± 13%. Hemoglobin was visibly adsorbed to the membrane in the region between where the protein had been injected and where it focused. Filling the annular chamber with a 20% Tween-20 solution and letting it stand for 15 h pulled most of the Hb back into solution so that after draining the annulus and flushing it three times with buffer the rotor was nearly the same color as before the run.
Table 2.
Pooled Fraction Volumes, Concentrations, and Mass of Hb
| volume (mL) | concn (mg/mL) | mass recovered (mg) | |
|---|---|---|---|
| run 2 | 2.792 | 3.44 | 9.21 |
| run 3 | 3.385 | 2.94 | 8.47 |
| run 4 | 2.607 | 3.59 | 8.16 |
5. Conclusion
This paper described the design and construction of a vortex-stabilized, preparative-scale DFGF apparatus. The prototype preparative-scale DFGF apparatus consistently focused 10 mg of bovine Hb into a band approximately 1.1 cm wide with an average concentration of 15 mg/mL, which was 220% greater than the initial concentration of the Hb band in the separation annulus. On average, 86 ± 13% of the Hb injected could be recovered at the end of a run. Final pooled concentrations of Hb were less than the concentration of the protein in the separation annulus due to gearing the sample collection procedure toward recovering as much protein as possible, rather than maintaining the high protein concentration found in the separation annulus. Although simplistic compared to a protein separation, the process of trying to focus and hold a single protein in the separation annulus provided a straightforward way to determine whether problems were solved and the instrument was performing properly.
There were unexpected developments during the design, construction, and testing of the preparative-scale DFGF apparatus. Voltage and current limitations on the circuitry available to fabricate the computer-controlled, multichannel power supply limited it to producing applied electric fields of 150 V/cm or less, rather than fields as high as 350 V/cm. Also, the individual channels were unable to provide sufficient voltage to prevent the electric field from having a large defocusing zone. Connecting the cathodic electrodes in the stator to an external Spellman power supply in reverse polarity solved this problem. The limitations on the electric field gradient reduced the required cooling capacity of the apparatus from 825 to 7 W. Hence, limiting the cooling buffer’s flow rate to 375 mL/min to prevent buffer from flowing radially through the rotor and into the separation annulus did not have any adverse effects on cooling the annular separation chamber. The rotor itself caused a problem when the surface charge of the completed, membrane-covered ceramic did not have a positive charge as the test discs had. This caused EOF to pump buffer into the annular chamber and prevent Hb from focusing in addition to lifting the polysulfone membrane off the rotor. Dynamically coating the rotor with a CTAB:SDS mixture solved this problem by giving the rotor’s surface and pores a slightly positive charge so that EOF was directed into the rotor’s lumen.
The rotor and multichannel power supply are the two parts of the apparatus most in need of improvement. Increasing the voltage and current output from the multichannel power supply will be possible as technology progresses and circuitry rated for higher voltages and currents becomes available, obviating the need for the extra reversed-polarity power supply. Improving the membrane-coated rotor will take significantly more effort.
Protein adsorption to the membrane needs to be reduced to improve recovery, which will require extensive study and experimentation to find the proper modifying agent. Intensive effort will also be required to find out why the surface charge, and hence the EOF, varied between the test discs and the full length ceramic rotor. Understanding the surface behavior of the boron nitride will allow us to propose and test methods to permanently alter the surface chemistry of the boron nitride to give it a small positive charge, ensuring that EOF is into the rotor’s lumen so it does not push the membrane off the rotor or interfere with focusing proteins.
Eliminating the pressure-driven radial flow through the rotor’s wall could be as simple as decreasing the radius of the electrode array and increasing the inner diameter of the rotor. However, packing 32 high-voltage lines insulated to 5 kV in a tube of less than 7.62 mm diameter will be a challenge. Increasing the inner diameter of the boron nitride is easily done, but this increases the chance that the fragile ceramic will crack under the stress of rotation. Therefore, many expensive miniature rotors with varying wall thickness would need to be tested to find the thinnest wall that will not break under the stress of rotation. The stress testing will be complicated by any lot-to-lot variability in the boron nitride’s properties. Test rotors could also be constructed out of other support materials, such as porous alumina or plastic, which are substantially stronger than boron nitride and would allow for larger inner diameters, at the expense of thermal conductivity. Alumina, though, would be very difficult and expensive to machine, whereas plastic would bring the new challenge of trying to affix and seal a membrane to it.
Making some or all of the previously mentioned improvements will probably be necessary in order for the preparative-scale DFGF instrument to reach the long-term goal of separating protein isoforms. In its present state, the apparatus described in this paper was able to focus and hold one protein at over 40 mg/mL in a native buffer, which suggests that future work focusing and separating multiple proteins should also succeed. The results of future protein separations will demonstrate the limits of the current preparative-scale DFGF instrument. Understanding the limitations of the current design will then allow us to judiciously pursue the improvements that will bring the greatest increase in performance to the preparative-scale DFGF instrument.
Supplementary Material
Acknowledgment
We thank the Washington State University National Institutes of Health Protein Biotechnology Training Program (grant T32GM08336), the National Science Foundation (grant BES 9970972), and Berlex Laboratories (now a subsidiary of Bayer HealthCare Pharmaceuticals) for funding. Protasis Corporation supplied the multichannel power supply. We thank the WSU College of Engineering and Architecture Machine Shop and, in particular, Gary Held for making the many complex, custom parts needed to build the preparative-scale DFGF apparatus. Paul Goiter kindly let us use the plate reader in the WSU Department of Chemical Engineering’s Unit Operations Laboratory.
Footnotes
Supporting Information Available: Evolution of the rotor design Design of cooling and degassing systems. This material is available free of charge via the Internet at http://pubs.acs.org.
References and Notes
- 1.Huang Z, Ivory CF. Digitally controlled electrophoretic focusing. Anal. Chem. 1999;71:1628–1632. [Google Scholar]
- 2.Myers P, Bartle KD. Towards a miniaturised system for dynamic field gradient focused separation of proteins. J. Chromatogr. A. 2004;1044:253–258. doi: 10.1016/j.chroma.2004.04.069. [DOI] [PubMed] [Google Scholar]
- 3.Tracy NI, Ivory CF. Assessing the scalability of dynamic field gradient focusing using linear modeling. J. Sep. Sci. 2007 doi: 10.1002/jssc.200700307. in press, doi 10.1002/jssc.200700301. [DOI] [PMC free article] [PubMed] [Google Scholar]
- 4.Ivory CF. A brief review of alternative electrofocusing techniques. Sep. Sci. Technol. 2000;35:1777–1793. [Google Scholar]
- 5.Giddings JC, Dahlgren K. Resolution and peak capacity in equilibrium-gradient methods of separation. Sep. Sci. 1971;6:345–356. [Google Scholar]
- 6.Wang Q, Tolley HD, LeFebre DA, Lee ML. Analytical equilibrium gradient methods. Anal. Bioanal. Chem. 2002;373:125–135. doi: 10.1007/s00216-002-1286-y. [DOI] [PubMed] [Google Scholar]
- 7.Ivory CF. Preparative free-flow electrofocusing in a vortex-stabilized annulus. Electrophoresis. 2004;25:360–374. doi: 10.1002/elps.200305753. [DOI] [PubMed] [Google Scholar]
- 8.Tracy NI, Ivory CF. Preparative isoelectric focusing of proteins using binary buffers in a vortex-stabilized, free-flow apparatus. Electrophoresis. 2004;25:1748–1757. doi: 10.1002/elps.200305832. [DOI] [PubMed] [Google Scholar]
- 9.Bottenus D, Leatzow D, Ivory CF. Effects of increased voltage on resolution in preparative isoelectric focusing. Electrophoresis. 2006;27:3325–3331. doi: 10.1002/elps.200500939. [DOI] [PubMed] [Google Scholar]
- 10.Thome BM, Ivory CF. Continuous fractionation of enantiomer pairs in free solution using an electrophoretic analog of simulated moving bed chromatography. J. Chromatogr. A. 2002;953:263–277. doi: 10.1016/s0021-9673(02)00097-3. [DOI] [PubMed] [Google Scholar]
- 11.Thome BM, Ivory CF. Increasing the scale of true moving bed electrophoretic separations using filtration to reduce solvent volumetric flows between sections II and III. J. Chromatogr. A. 2007;1138:291–300. doi: 10.1016/j.chroma.2006.10.080. [DOI] [PubMed] [Google Scholar]
- 12.Ivory CF. The prospects for large-scale electrophoresis. Sep. Sci. Technol. 1988;23:875–912. [Google Scholar]
- 13.Wang C, Lucy CA. Mixed cationic/anionic surfactants for semipermanent wall coatings in capillary electrophoresis. Electrophoresis. 2004;25:825–832. doi: 10.1002/elps.200305760. [DOI] [PubMed] [Google Scholar]
Associated Data
This section collects any data citations, data availability statements, or supplementary materials included in this article.


