

Abstract
The rate of synaptic transmission between photoreceptors and bipolar cells has been long known to depend on conditions of ambient illumination. However, the molecular mechanisms that mediate and regulate transmission at this ribbon synapse are poorly understood. We conducted electroretinographic recordings from dark- and light-adapted mice lacking the abundant photoreceptor-specific protein phosducin and found that the ON-bipolar cell responses in these animals have a reduced light sensitivity in the dark-adapted state. Additional desensitization of their responses, normally caused by steady background illumination, was also diminished compared with wild-type animals. This effect was observed in both rod- and cone-driven pathways, with the latter affected to a larger degree. The underlying mechanism is likely to be photoreceptor specific because phosducin is not expressed in other retina neurons and transgenic expression of phosducin in rods of phosducin knock-out mice rescued the rod-specific phenotype. The underlying mechanism functions downstream from the phototransduction cascade, as evident from the sensitivity of phototransduction in phosducin knock-out rods being affected to a much lesser degree than b-wave responses. These data indicate that a major regulatory component responsible for setting the sensitivity of signal transmission between photoreceptors and ON-bipolar cells is confined to photoreceptors and that phosducin participates in the underlying molecular mechanism.
Introduction
The vertebrate retina has a remarkable ability to adapt its sensitivity to dramatic changes in the ambient illumination that occur during the normal diurnal cycle (Shapley and Enroth-Cugell, 1984). Dark and light adaptation take place both in the biochemical phototransduction cascade converting the information coded in incoming photons into electrical activity of rods and cones (Pugh et al., 1999; Fain et al., 2001; Burns and Arshavsky, 2005; Luo et al., 2008) and at essentially every stage of the retinal circuitry (Demb, 2008; Dunn and Rieke, 2008). One intriguing aspect of light adaptation is the regulation of light sensitivity of ON-bipolar cells, the neurons relaying photoreceptor inputs to the inner retina. ON-bipolar cells are very sensitive to light under dark-adapted conditions and can be saturated by light at least 10-fold dimmer than the light required to saturate rods (Dowling, 1967; Green and Powers, 1982; Dunn et al., 2006; Cameron et al., 2008). Sustained illumination causes desensitization of bipolar cells, which results in extension of their operating range. This desensitization is attributable in part to the adaptation mechanisms operating in the phototransduction cascade in photoreceptor outer segments, which ultimately reduce photoreceptor synaptic output. However, additional adaptation mechanisms have been considered to operate within bipolar cells themselves and/or on the level of the photoreceptor-to-ON-bipolar cell synapses (Thoreson, 2007; Snellman et al., 2008), yet the molecular aspects of these mechanisms remain far from understood.
Here we report an unexpected observation that an abundant photoreceptor-specific protein, phosducin, thought previously to regulate phototransduction, participates in regulating the light sensitivity of synaptic transmission between photoreceptors and ON-bipolar cells. This was established by analyzing flash sensitivity and light adaptation in the retinas of phosducin knock-out mice by measuring the electroretinogram (ERG), which monitors the light-evoked activities of retinal cells, including both photoreceptors and bipolar cells in living animals. Phosducin knock-out affected two distinct features of rod- and cone-driven ERG b-waves, which reflect the activation of ON-bipolar cells by photoreceptors (Pugh et al., 1998; Robson and Frishman, 1998). First, the knock-out reduced the dark-adapted sensitivity of flash responses. Second, it diminished the degree of b-wave desensitization observed under sustained background illumination. Both effects were more pronounced for cone-driven than for rod-driven ERG b-waves. In contrast, a-waves, which reflect the activation of phototransduction in photoreceptor outer segments, were essentially unchanged by phosducin knock-out. Combined with our recent study indicating that phosducin knock-out does not affect any feature of light adaptation of rod outer segments (Krispel et al., 2007), these data argue that phosducin has minimal impact on phototransduction and instead is involved, directly or indirectly, in regulating the light sensitivity of synaptic transmission between photoreceptors and ON-bipolar cells. The rescue of the rod-specific ERG b-wave phenotype by transgenic restoration of phosducin in rods of phosducin knock-out mice indicates that the underlying mechanism is confined to photoreceptors. Therefore, phosducin is likely to be a part of a novel presynaptic mechanism responsible for regulating the information flow from rods and cones to ON-bipolar cells.
Materials and Methods
Animals
Mice were handled following an approved protocol from the Institutional Animal Care and Use Committees of Duke University and reared under the normal diurnal cycle. C57BL/6 wild-type (WT) mice were purchased from Charles River. Phosducin knock-out (Pd−/−) mice were described by Sokolov et al. (2004). Transducin γ-subunit heterozygous (Gγ1+/−) mice were described by Lobanova et al. (2008). Transducin α-subunit knock-out (Gαt−/−) mice were provided by J. Lem (Tufts University, Medford, MA). The Gαt−/−Pd−/− double knock-out mice were produced by crossing these two lines.
Generation of transgenic mouse lines expressing wild-type and mutant phosducin on the Pd−/− background
We generated two transgenic mouse lines: one expressing mouse phosducin (tgPd+ mice) and another expressing the mutant phosducin lacking all five previously detected protein kinase A and calmodulin-dependent kinase II (PKA/CaMKII) phosphorylation sites (Thulin et al., 2001) (noPoP+ mice). The pCMV–SPORT 6 plasmid carrying the WT mouse phosducin sequence was purchased from American Type Culture Collection. To generate the noPoP+ mutant, we introduced five alanine substitutions into this cDNA (S6A, S36A, S54A, S71A, and S104A) using the PCR-based site-directed mutagenesis (Quickchange kit; Stratagene). Both constructs were amplified by PCR and extended by C-terminal c-myc epitope coding sequences. The PCR products were cloned at the SalI/BamHI restriction sites into a rod-specific expression vector carrying the mouse opsin promoter and a polyadenylation signal of the mouse protamine gene (Lem et al., 1991). The constructs were confirmed by sequencing. Linear constructs were excised by the KpnI/NotI digest, purified using the Qiagen Gel Extraction kit, and injected into pronuclei of mouse oocytes of superovulated B6SJLF1/J females. Transgene insertion was determined by the PCR analysis of tail DNA. To establish the final mouse lines, the founders were crossed with Pd−/− mice for three generations. For experiments, we used mice of the F3 generation on the Pd−/− background (tgPd+Pd−/− and noPoP+Pd−/−), as well as non-expressing littermate controls also on the Pd−/− background (called tgPd–Pd−/− for both lines).
To confirm that the noPoP phosducin mutant folds as a functionally active protein, we cloned the DNA above into the pET101/D-TOPO expression vector and produced His-tagged recombinant noPoP phosducin in Escherichia coli based on published methods (Blüml et al., 1997). This protein was able to efficiently bind transducin Gβγ-subunits in pull-down binding assays, which indicated that mutations did not affect its overall integrity.
Determination of phosducin expression levels in transgenic mouse lines
Determination of rhodopsin concentration in retina lysates and the expression level of phosducin in transgenic mice were performed as described previously (Lobanova et al., 2008). Samples of retina lysates from tgPd+Pd−/− or noPoP+Pd−/− mice containing known amounts of rhodopsin were subjected to SDS-PAGE alongside with the samples from Pd−/− mice containing the same amount of rhodopsin and mixed with various amounts of the recombinant phosducin standard. Western blots were probed using the sheep anti-phosducin antibody described by Sokolov et al. (2004), and the bands were visualized using fluorescent secondary anti-sheep antibodies (Invitrogen). The fluorescence of the individual bands on the blot was determined using the Odyssey Infrared Imaging System (LI-COR Biosciences). Phosducin content in retina lysates was determined based on the calibration curves obtained with phosducin standards and expressed as a molar ratio with rhodopsin.
To produce the phosducin standard, we obtained the pET15b plasmid (Invitrogen) carrying the coding sequence of N-terminally His6-tagged rat phosducin and the C-terminal c-myc epitope from B. M. Willardson (Brigham Young University, Provo, UT). To precisely match the electrophoretic mobility of the standard with that of the myc-tagged phosducin expressed in the transgenic mice, we subcloned this construct without His6 tag into the pTYB1 vector (New England Biolabs) at the NdeI/SapI restriction sites, which allowed us to use the intein-mediated purification system (IMPACT-CN; New England Biolabs) (Xu and Evans, 2001). The resulting construct encoded the C-terminally myc-tagged phosducin, N-terminally fused to intein. This construct was expressed in E. coli, bound to chitin beads, washed, and cleaved by β-mercaptoethanol to remove the intein tag (for experimental details, see Herrmann et al., 2004). The resulting recombinant phosducin was at least >95% pure, as estimated by SDS-PAGE.
Measurements of cone arrestin and transducin expression levels
For detection of the cone transducin α subunit (cGαt), we generated rabbit antiserum against the cGαt peptide CGIDYAEPSCADAGRQLNNL. The peptide was coupled to the maleinimide-activated keyhole limpet hemocyanin (Pierce), and the conjugate was used to immunize rabbits. Antibodies were purified on a Sulfolink Plus column (Pierce) containing covalently attached peptide. Antibodies against mouse cone arrestin (Arr4) were a gift from C. M. Craft (University of Southern California, Los Angeles, CA). For comparison of protein expression levels, retinas were dissolved in 2% SDS and Tris-HCl, pH 6.8, by sonication. The total protein content of samples was determined using the Dc Protein Assay (Bio-Rad). Samples containing equal amounts of total protein were subjected to Western blotting as described previously (Lobanova et al., 2008) and probed with either of the above antibodies or mouse anti-actin antibody (sc-47778; Santa Cruz Biotechnology). Fluorescent secondary antibodies against mouse and rabbit were from Invitrogen. The fluorescence of the individual bands on the blot was determined using the Odyssey Infrared Imaging System (LI-COR Biosciences), and their densities were quantified using the Odyssey software.
Electron microscopy and immunohistochemistry
Transmission electron microscopy in 0.15-μm-thick retina cross-sections was performed as described by Petters et al. (1997). Immunostaining of the myc-tagged phosducin and its mutant lacking phosphorylation sites was performed as described by Lobanova et al. (2007) using the mouse anti-c-myc primary antibody (1:500; Santa Cruz Biotechnology) and goat anti-mouse Alexa Fluor 488 secondary antibody (1:500; Invitrogen). Hoechst dye was used for nuclear staining (1:1000; Invitrogen). For immunofluorescence localization of cone transducin, eyes were enucleated and fixed for 1 h with 4% formaldehyde in PBS buffer, pH 7.5 (Thermo Fisher Scientific). The anterior portions of the fixed eyes were removed, and the eyecups were further fixed overnight at 4°C. Eyes were rinsed three times in PBS and embedded in 4% low-melt agarose (Invitrogen). Retina cross-sections (100 μm) from the central retina were collected with a vibratome (Microm HM650 V). Floating sections were further incubated in 24-well plates placed on an orbital shaker (Stovall) to ensure complete penetration of antibodies. Sections were incubated for 4 h with blocking solution containing 3% donkey serum and 0.1% Triton X-100 in PBS buffer. For detection of cone transducin, floating sections were incubated overnight with a mixture of the rabbit anti-cGαt antibody and anti-peanut agglutinin lectin antibody tagged with Alexa Fluor 488 fluorophore (Invitrogen). Sections were washed three times with PBS and incubated for 2 h with goat anti-rabbit Alexa Fluor 594 secondary antibody (1:500; Invitrogen). Sections were rinsed three times in PBS, mounted with Fluoromount G (Electron Microscopy Sciences) under glass coverslips, and visualized using a Nikon Eclipse 90i confocal microscope.
Single-cell recordings
Suction electrode recordings of rod outer segment currents in Gγ1+/− mice were performed and analyzed as described by Lobanova et al. (2008). Briefly, mice that had been dark-adapted overnight were killed, and the retinas were dissected under infrared light. Small pieces of retina were placed in a recording chamber and perfused with oxygenated, bicarbonate-buffered Locke's solution at 34–37°C, pH 7.4. Brief flashes (10 ms, 500 nm) of calibrated stimulus strength were delivered to a single rod whose outer segment was drawn into a suction electrode filled with HEPES-based buffer and connected to a current-to-voltage amplifier (Molecular Devices). Signals were filtered (eight-pole Bessel with 30 Hz corner frequency; Frequency Devices) and digitized at 200 Hz acquisition frequency using IgorChart (Wavemetrics).
Electroretinography
General procedures.
ERGs were recorded using the Espion E2 system (Diagnosys) according to published protocols (Saszik et al., 2002). Eight- to twelve-week-old mice were dark adapted overnight and prepared for recordings in darkness using infrared goggles. Mice were anesthetized by intraperitoneal injection of a ketamine/xylazine mixture (75 and 10 mg/kg, respectively). Pupils were dilated with 1% cyclopentolate-HCl and 2.5% phenylephrine (∼2.8 mm in diameter). A drop of the Gonak solution (Akorn) was placed on the cornea. Recordings were performed simultaneously from both eyes with silver loop electrodes supplemented with contact lenses to keep the eyes immersed in Gonak solution. This prevented eyes from drying and cataract development during recording periods of up to 60 min. The reference electrode was a toothless alligator clip wetted with Gonak and attached to the mouse cheek. Mouse body temperature was maintained at 37°C using a Deltaphase Isothermal Pad (Braintree Scientific). ERG signals were sampled at 1 kHz and recorded with 0.15 Hz low-frequency and 500 Hz high-frequency cutoffs.
Light stimuli, calibration, and measurement of rhodopsin isomerization rate.
The light stimuli consisted of brief full-field white flashes delivered by a set of light-emitting diodes (LEDs) (duration, <4 ms) for flash strengths ≤1 cd · s/m2 or a xenon light source for flashes ≥1 cd · s/m2 (flash duration, 5 μs to 2 ms). All flashes were produced by a Ganzfeld stimulator (ColorDome; Diagnosys), either in darkness or on steady blue background light (λmax = 465 nm). Internal calibrations of LED and xenon light sources were verified using a light meter (International Light IL 1700) by applying a train of flashes and measuring the mean luminance. The rate of rhodopsin isomerization evoked by steady background light was determined as reported previously (Lobanova et al., 2007). Briefly, mice were treated as they were for ERG recordings and exposed to background light (10 min) of various intensities. The amount of rhodopsin bleached over the illumination period was determined by removing the retinas and measuring their rhodopsin contents before and after rhodopsin regeneration with 11-cis-retinal (Sokolov et al., 2002). The rate of rhodopsin isomerization was calculated by multiplying the fraction of photoactivated rhodopsin by the total number of rhodopsin molecules per mouse rod [7 × 10⁷ from Lyubarsky et al. (2004)] and dividing this product by the duration of background illumination. For our experimental setup, we found that blue background light of 1 cd/m2 activated ∼800 rhodopsins/rod/s.
Intravitreal injections.
Intravitreal injections of 2-amino-4-phosphonobutyric acid (APB) (Sigma) were performed as described previously (Shirato et al., 2008) to block ON-bipolar cell light responses (Slaughter and Miller, 1981). A solution of APB in sterile saline was prepared freshly and adjusted to neutral pH using NaOH. A volume of ∼1.5 μl was injected with a 30 gauge needle into the vitreous just behind the limbus 1 h before recordings, yielding a final vitreal APB concentration of ∼2 mm based on a vitreal volume of 20 μl.
ERG protocols.
ERG responses in mice, either dark adapted or adapted to blue background light (0.005, 0.1, and 1 cd/m2), were evoked by a series of flashes ranging from 0.0001 to 1000 cd · s/m2. For dim flashes up to 0.1 cd · s/m2, responses of 10 trials were averaged. For 1 cd · s/m2 flash responses, three trials were averaged. For brighter stimuli, responses to single flashes were recorded without averaging. Intervals between individual flashes were chosen to ensure that the retina recovered completely from each flash, i.e., no indications of flash-induced reduction of response amplitudes, enlargement of oscillatory potentials, or shortening of implicit times were observed. Based on these criteria, the interflash intervals were 5 s for the 0.0001–0.1 cd · s/m2 flashes and 15 s for the 0.5 and 1 cd · s/m2 flashes. Recovery times were 30 s after the 1 cd · s/m2 flash, 60 s after the 5 and 10 cd · s/m2 flashes, 120 s after 100 cd · s/m2 flash, and 180 s after the 1000 cd · s/m2 flash. For each mouse, the dark-adapted series were recorded first, followed by the series of increasing intensity of background illumination. Complete adaptation to background light was achieved by a 2 min exposure to steady background before starting the flash series (longer adaptation times did not change the results). To account for any potential changes in response amplitudes that may occur during a recording session attributable to electrode shifts or condition of the subject, mice were dark adapted after the brightest background and a subset of test flashes was applied to verify that the dark-adapted response amplitudes were not significantly changed during the course of experiment. In rare cases when >15% changes were observed, the entire dataset was dismissed. To isolate cone-driven ERG responses, we modified this protocol as follows. Flash strengths for the dark-adapted series were 0.001, 0.005, and 0.01 cd · s/m2 (five trials averaged with 15 s trial interval time), 0.1 and 1 cd · s/m2 (three trials averaged with 15 s trial interval time), and 5, 50, 100, 500, and 1000 cd · s/m2 (single-flash responses). For the light-adapted series, we used background light of 10, 50, 100, and 500 cd/m2 and flashes of 0.1, 1, 5, 50, 100, 500, and 1000 cd · s/m2 (up to 10 trials averaged with interval times of 10 s). The interval time of 10 s was sufficient to ensure complete recovery between the flashes attributable to the fast cone recovery rate.
Data analysis.
To determine a-wave and b-wave amplitudes, ERG data were processed and analyzed using MATLAB software (version R2007a; MathWorks). Rod-driven a-waves were measured from the baseline recorded before the flash to the response at 8 ms. For b-waves, the oscillatory potentials were removed from the signals by 55 Hz fast Fourier transform low-pass frequency filtering because oscillatory potentials obscure the amplitude and position of the b-wave peak, especially under light-adapted condition (Lei et al., 2006). The b-wave amplitude was calculated from the bottom of the a-wave response to the peak of the b-wave peak.
The data points from the a-wave and b-wave stimulus–response curves were fitted by Equation 1 using the least-square fitting procedure (Scientist Software; MicroMath):
 |
The first term of this equation describes rod-mediated responses (index 1), and the second term accounts primarily for responses that were cone mediated (generally observed at the flash intensities ≥1 cd · s/m2 for dark-adapted mice; index 2). Rmax,1 and Rmax,2 are maximal response amplitudes, and I0.5,1 and I0.5,2 are the half-saturating flash intensities. The use of a simple hyperbolic for each curve was adopted with the assumption that stimulus response functions of retina cells increase in proportion to stimulus strength and then saturate in a characteristic way that is adequately described by this function (Robson and Frishman, 1995).
The data points in Figures 6 and 7 were fitted to the following function:
 |
where R/Rdark is the response amplitude normalized to the dark-adapted value, Ib is the background light intensity, Ihalf is the background luminance causing half-maximal reduction of normalized response amplitudes, and n is the Hill coefficient.
Figure 6.

Impaired light adaptation of ERG b-waves in Pd−/− mice probed with saturating flashes. A, Representative ERG responses in WT and Pd−/− mice evoked by a flash of 1 cd · s/m2 photoactivating ∼200 rhodopsin molecules per rod. Up to 10 trials with intertrial times of 15 s were averaged for each condition. Recordings were performed in the dark and after 2 min adaptation to background light of several luminances indicated to the left of the traces. B, C, The amplitudes of b-waves (B) and a-waves (C) were normalized to dark-adapted values (R/Rmax) and plotted as functions of background luminance. Filled symbols represent the data obtained from WT and Pd−/− mouse lines used in the rest of this study. The data are fitted using Equation 2 and plotted as solid lines. Open symbols represent the data obtained from WT (Pd+/+) and Pd−/− littermates. The parameters of all fits and the number of analyzed animals of each type are summarized in Table 4.
Figure 7.

Rescue of the phosducin knock-out phenotype by targeted expression of normal and mutant phosducin in rods of Pd−/− mice. A, Confocal fluorescence images of retina cross-sections stained with anti-myc antibodies (green) from Pd−/− mice, Pd−/− mice transgenically expressing phosducin (tgPd+Pd−/−), and Pd−/− mice expressing the noPoP phosducin mutant (noPoP+Pd−/−). Nuclei are stained with Hoechst dye (blue). B, Quantification of transgenic phosducin expression levels. Samples of retina lysates from tgPd+Pd−/− and noPoP+Pd−/− animals containing known amounts of rhodopsin were subjected to Western blotting alongside with various amounts of recombinant phosducin standard (Pd). The amount of phosducin in each sample was determined from the calibration curves shown in the top row in which the densities of phosducin standard bands are represented by black squares and the densities of phosducin bands from retina lysates by open triangles. The data are taken from one of three similar experiments. C, Representative ERGs from tgPd+Pd−/− mice (black), their littermates negative for the transgene (tgPd–Pd−/−; red), and noPoP+Pd−/− mice (gray) subjected to the experimental protocol described in Figure 6A. D, Averaged amplitudes of b- and a-waves were normalized to dark-adapted values (R/Rmax) and plotted as functions of background luminance. The data are fitted using Equation 2. For comparison, the fitting curve for WT mice from Figure 6B is plotted as a black dashed line in the top. The parameters of all fits and the number of analyzed animals of each type are summarized in Table 4. OS, Outer segment; ONL, outer nuclear layer; OPL, outer plexiform layer; INL, inner nuclear layer; GCL, ganglion cell layer.
Results
Phosducin knock-out results in reduced dark sensitivity and abnormal light adaptation of rod-driven ERG b-waves
To characterize the role of phosducin in dark and light adaptation of photoreceptors and ON-bipolar cells, we recorded ERGs from Pd−/− and WT mice. ERGs are massed field potentials that reflect the combined light-evoked activity of many retinal cells. The negative ERG deflections immediately after the flash stimulus, called a-waves, originate primarily from the suppression of the circulating dark current in rod and cone outer segments. The subsequent positive deflections, called b-waves, originate mainly from the light-induced depolarizing currents in ON-bipolar cells (Pugh et al., 1998; Robson and Frishman, 1998).
Representative ERG recordings from dark- and light-adapted Pd−/− and WT mice are shown in Figure 1A. Mice were subjected to a series of flashes, with the dimmest photoexciting only ∼0.02 rhodopsin molecules (R*) in each rod and the brightest exciting ∼2 × 10⁵ R*. Recordings were conducted in the dark and in the presence of three background light intensities activating rhodopsin at the rates of ∼4, 80, and 800 R*/rod/s. These measurements revealed that phosducin knock-out resulted in reduced amplitudes of dark-adapted b-waves evoked by dim flashes. However, the presence of background light essentially reversed this effect, so that the b-wave amplitudes in Pd−/− mice were larger than in WT mice under most conditions tested. To confirm that b-waves indeed served as adequate readouts of ON-bipolar cell activity in our experiments, we blocked ON-bipolar cell responses with APB, a potent agonist of the mGluR6 receptor localized specifically at the dendritic tips of both rod and cone ON-bipolar cells (Nomura et al., 1994; Masu et al., 1995; Vardi and Morigiwa, 1997). The data shown in Figure 1B confirmed that APB completely eliminated b-waves in both mouse types under all illumination conditions that we used.
Figure 1.
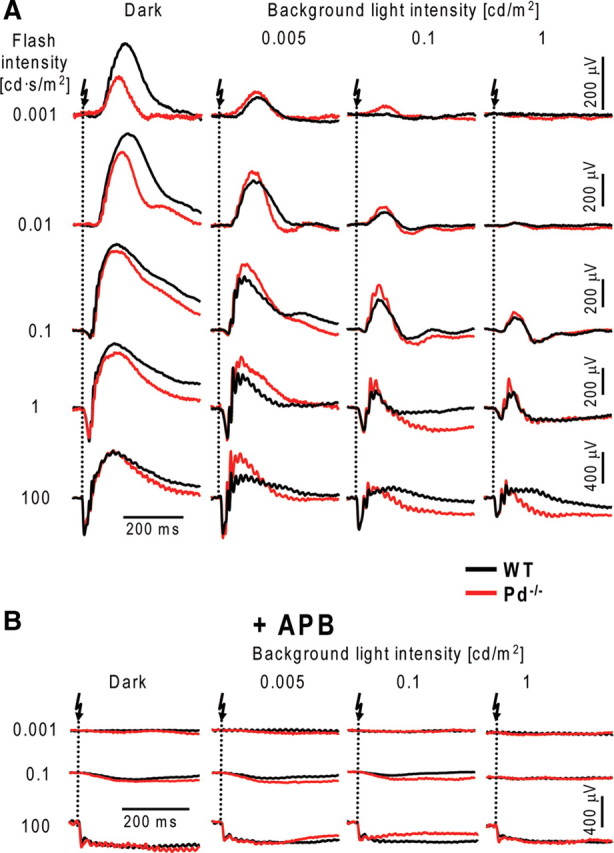
ERG recordings from dark- and light-adapted WT and Pd−/− mice. A, Animals were dark-adapted overnight and anesthetized, and their pupils were dilated. ERG responses evoked by flashes of increasing strength recorded from WT (black) and Pd−/− (red) mice in the dark or in the presence of three background light intensities indicated in the figure. Arrows indicate the time when light flash was applied. Intervals between individual flashes were chosen to ensure that the retina recovered completely from each flash. For each mouse, the dark-adapted series were recorded first, followed by the series of increasing intensity of background illumination. Complete adaptation to background light was achieved by a 2 min exposure to steady background before starting the flash series. B, The same experimental protocol applied to animals after intravitreal injections of APB. The data are taken from 1 of 17 (A) or 3 (B) similar experiments.
ERG data averaged from 17 eyes of Pd−/− and WT animals are presented in Figure 2, A and B. Phosducin knock-out did not affect the absolute values of maximal dark-adapted b-wave amplitudes, Rmax, dark (809 ± 56 and 785 ± 32 μV in WT and Pd−/− mice, respectively; mean ± SEM). To characterize the effects of phosducin knock-out quantitatively, we normalized b-wave amplitudes (R) to the corresponding Rmax, dark values, plotted the resulting ratios as functions of flash strength, and fitted the data to Equation 1 (for the complete set of parameters, see Table 1; note that, for Pd−/− mice, an additional set of recordings was performed in the presence of 0.02 cd/m2 background light). The resulting plots were biphasic, with the first phase reflecting the responses of rod ON-bipolar cells (“the rod-component”) and the second phase reflecting mainly the responses of cone ON-bipolar cells (“the cone-component”) (Toda et al., 1999; Weymouth and Vingrys, 2008). In some plots (Fig. 2A,C), the amplitude of the response was elevated slightly for the weakest stimulus, probably attributable to a small contribution from the positive scotopic threshold response (Saszik et al., 2002). The plots also do not take into account the small contribution of rod signals that enter into cone pathways via the electrical synapse between rods and cones when rods signals are nearing saturation (Abd-El-Barr et al., 2009).
Figure 2.
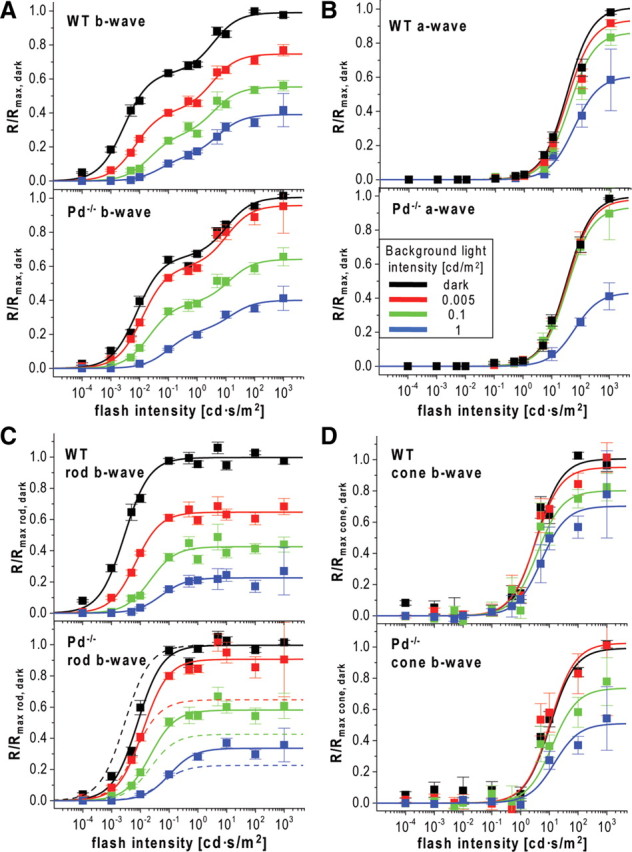
Reduced dark-adapted flash sensitivity and abnormal light adaptation in Pd−/− mice. A, B, Response amplitudes, R, of ERG b-waves (A) and a-waves (B) from WT and Pd−/− mice were normalized to the maximal values measured in the dark (Rmax, dark) and plotted as functions of flash intensities. Data were fitted by Equation 1 using either both terms (A) or a single term (B). The fits are shown as solid lines, and the corresponding parameters are summarized in Table 1. C, D, The rod- and cone-driven components of the b-wave stimulus–response curves in A are plotted individually and normalized to the corresponding maximal amplitudes in the dark. Fits of the WT data from the top in C are replotted as dashed lines in the bottom of C to visualize the difference between WT and Pd−/− mice. Color code: Dark-adapted mice, black; light adapted at 0.005 cd/m2, red; 0.1 cd/m2, green; 1 cd/m2, blue.
Table 1.
Parameters obtained from fitting the data in Figure 2, A and B, to Equation 1
| I0.5,1 (cd · s/m2) | Rmax,1 | I0.5,2 (cd · s/m2) | Rmax,2 | |
|---|---|---|---|---|
| a-wave | ||||
| WT | ||||
| Dark | 30.4 ± 2.1 | 1.01 ± 0.02 | ||
| 0.005 cd/m2 | 30.9 ± 2.6 | 0.94 ± 0.02 | ||
| 0.1 cd/m2 | 36.4 ± 0.7 | 0.86 ± 0.00 | ||
| 1 cd/m2 | 53.0 ± 3.3 | 0.61 ± 0.01 | ||
| Pd−/− | ||||
| Dark | 33.0 ± 1.1 | 1.00 ± 0.01 | ||
| 0.005 cd/m2 | 34.7 ± 1.4 | 0.98 ± 0.01 | ||
| 0.02 cd/m2 | 34.8 ± 2.1 | 1.13 ± 0.03 | ||
| 0.1 cd/m2 | 35.0 ± 1.1 | 0.93 ± 0.01 | ||
| 1 cd/m2 | 62.9 ± 2.5 | 0.43 ± 0.04 | ||
| b-wave | ||||
| WT | ||||
| Dark | 0.003 ± 0.0001 | 0.64 ± 0.01 | 3.7 ± 0.4 | 0.35 ± 0.01 |
| 0.005 cd/m2 | 0.007 ± 0.001 | 0.43 ± 0.01 | 5.0 ± 0.7 | 0.33 ± 0.01 |
| 0.1 cd/m2 | 0.023 ± 0.004 | 0.27 ± 0.02 | 3.8 ± 0.8 | 0.28 ± 0.02 |
| 1 cd/m2 | 0.054 ± 0.016 | 0.14 ± 0.01 | 5.2 ± 0.8 | 0.25 ± 0.01 |
| Pd−/− | ||||
| Dark | 0.008 ± 0.0004 | 0.66 ± 0.01 | 10.6 ± 1.4 | 0.35 ± 0.01 |
| 0.005 cd/m2 | 0.012 ± 0.001 | 0.60 ± 0.01 | 10.6 ± 1.9 | 0.36 ± 0.02 |
| 0.02 cd/m2 | 0.017 ± 0.001 | 0.54 ± 0.01 | 10.6 ± 1.9 | 0.35 ± 0.01 |
| 0.1 cd/m2 | 0.022 ± 0.001 | 0.38 ± 0.01 | 12.6 ± 1.7 | 0.26 ± 0.01 |
| 1 cd/m2 | 0.103 ± 0.021 | 0.22 ± 0.01 | 14.9 ± 4.5 | 0.18 ± 0.01 |
Errors are given as SEM. The data are averaged from 17 eyes of each mouse type.
To better visualize the effects of phosducin knock-out on rod and cone components of b-waves, we plotted average responses for each component separately in Figure 2, C and D. The analysis of the rod-specific b-wave component in Figure 2C revealed two effects of the knock-out. First, the light sensitivity of dark-adapted b-waves (defined as the flash strength evoking half-saturating response amplitude) was reduced by ∼2.7-fold (p = 0.0003 based on the unpaired, two-sample t test), and the b-wave desensitization caused by background light was less pronounced (Fig. 2C, compare solid lines with dashed lines in the bottom).
Normally, b-wave desensitization has two distinct features: an increase in half-saturating light (“stimulus scaling”) and a reduction in the maximal response amplitude (“response compression”) (Dowling, 1967; Green, 1986). To correctly analyze stimulus scaling in Pd−/− mice, we had to account for the fact that the flash sensitivity of their b-waves was already reduced in the dark. Therefore, we normalized the values of half-saturating flash intensities in the presence of background illumination to the corresponding values obtained in the dark (I0.5/I0.5, dark) and compared the resulting ratios to the corresponding parameters obtained from WT mice. Assuming that the mechanisms that cause sensitivity reduction of flash responses in the dark would similarly affect the desensitizing ability of the background light, we also corrected the nominal value of background luminance applied to Pd−/− mice for the same 2.7-fold sensitivity reduction factor. For example, light of 0.005 cd/m2 was calculated to have the effective equivalent of 0.0019 cd/m2. The resulting plots for WT and Pd−/− mice followed similar trends (Fig. 3A), which indicates that stimulus scaling was not significantly affected by phosducin knock-out. On the contrary, b-wave response compression in Pd−/− animals was reduced. This is evident from plotting the normalized values of saturating b-wave amplitudes (Rmax/Rmax rod, dark) as a function of corrected background luminance (Fig. 3B).
Figure 3.
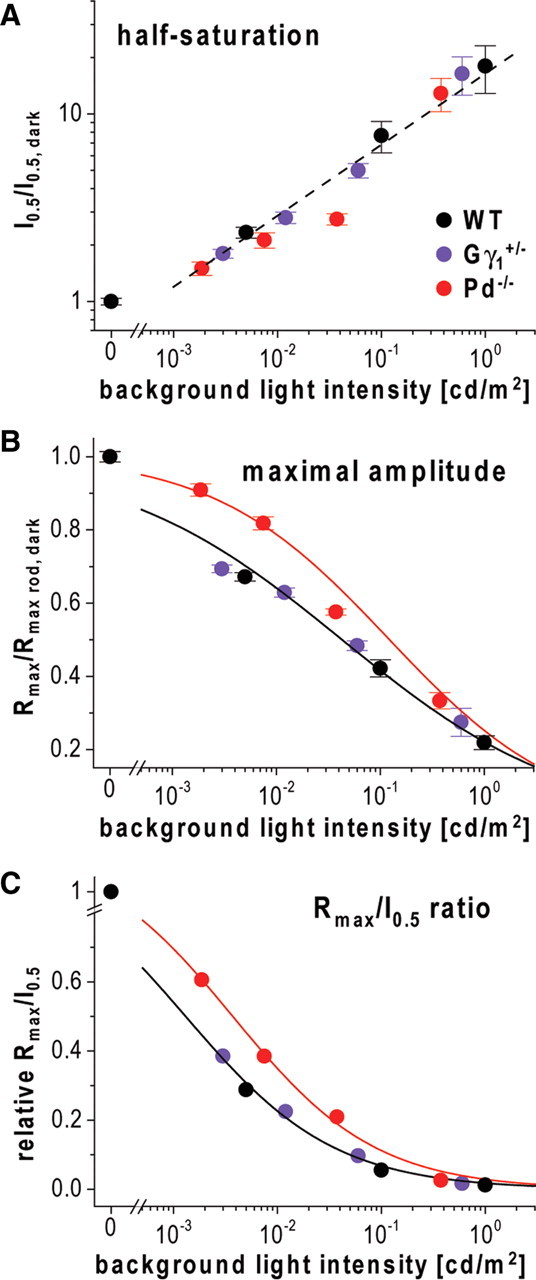
Phosducin knock-out reduces response compression but not stimulus scaling during b-wave light adaptation. A, The values for flashes evoking half-saturating rod-driven b-wave amplitudes, I0.5, taken from Tables 1 and 3 were normalized to the dark-adapted values, I0.5, dark, and plotted as functions of background luminance. The data for WT mice are shown in black, for Pd−/− mice in red and Gγ1+/− mice in violet. The background luminance values for Pd−/− and Gγ1+/− mice were further corrected to account for the reduced dark-adapted b-wave light sensitivity in these animals, as described in Results. The straight dashed line represents the best fit to all three datasets. B, Normalized maximal amplitudes of rod-driven b-wave stimulus–response curves in Tables 1 and 3 (Rmax/Rmax rod, dark) are plotted as functions of background luminance. The values for background strength for Pd−/− and Gγ1+/− mice were corrected as in A. Solid lines represent data fits to Equation 2 (WT and Gγ1+/− combined, Ihalf = 0.043 ± 0.003 cd/m2, n = 0.40 ± 0.02; Pd−/−, Ihalf = 0.085 ± 0.008 cd/m2, n = 0.54 ± 0.03; error bars represent SEM). C, The Rmax/I0.5 ratios for rod-driven b-waves were normalized to their dark-adapted values and plotted as functions of background luminance. The values for background strength in Pd−/− and Gγ1+/− mice were corrected as in A. Solid lines represent data fits to Equation 2 (WT and Gγ1+/− combined, Ihalf = 0.001 ± 0.001 cd/m2, n = 0.60 ± 0.04; Pd−/−, Ihalf = 0.004 ± 0.001 cd/m2, n = 0.63 ± 0.03).
To formally describe the degree of b-wave desensitization caused by phosducin knock-out, we determined the Rmax/I0.5 ratio, according to Saszik et al. (2002). We calculated this ratio at each condition of background illumination and normalized it to the dark-adapted value to account for the difference in the dark sensitivities of WT and Pd−/− mice. The resulting values were plotted as a function of background luminance in Figure 3C, indicating that the 50% reduction of b-wave Rmax/I0.5 ratio in Pd−/− mice required approximately fourfold higher background luminance than in WT animals.
The analysis of cone b-wave components (Fig. 2D) revealed that their sensitivity was also reduced in Pd−/− mice. However, a quantitative analysis of this effect required applying rod suppressing background light or using animal models in which ERG responses lack any rod contributions. These data are presented below in Figures 9–11.
Figure 9.

The sensitivity of dark-adapted cone-driven b-waves and their desensitization by background light are reduced in Pd−/− mice. A, Representative ERG responses evoked by flashes of increasing strength indicated to the left of the graphs recorded from WT (black) and Pd−/− (red) mice in the presence of three background luminance levels (50, 100, and 500 cd/m2). Ten trials averaged with interval times of 10 s, which was sufficient to ensure complete recovery between the flashes attributable to the fast cone recovery rate. B, C, Averaged b-wave amplitudes for each mouse type (n = 5) are plotted as functions of flash strength and fitted to a single term of Equation 1. Dark-adapted cone b-wave amplitudes (black) were calculated from the second term of b-wave stimulus–response curves as in Figure 2D. Flash strengths for the dark-adapted series were 0.001, 0.005, and 0.01 cd · s/m2 (5 trials averaged with 15 s trial interval time), 0.1, 1 and cd · s/m2 (3 trials averaged with 15 s trial interval time), and 5, 50, 100, 500, and 1000 cd · s/m2 (single-flash responses). Fitting parameters are summarized in Table 5.
Figure 10.
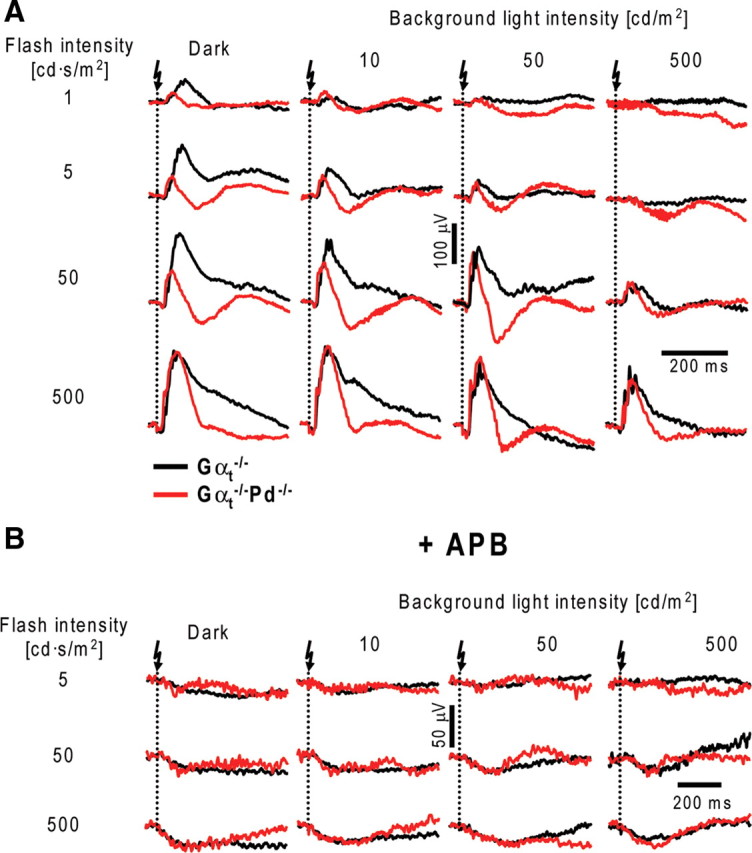
ERGs recorded from dark- and light-adapted Gαt−/− and Gαt−/−Pd−/− mice. A, ERG responses to flashes of increasing strength were recorded from Gαt−/− (black) and Gαt−/−Pd−/− (red) mice in the dark and in the presence of three background luminances (10, 50, and 500 cd/m2). B, The same experimental protocol was applied to animals after intravitreal injections with APB. The data are taken from one of 11 (A) or 3 (B) similar experiments.
Figure 11.

Dark-adapted cone-driven b-waves in Gαt−/−Pd−/− mice are greatly desensitized in the dark. A, B, Averaged b-wave amplitudes recorded from 11 eyes of Gαt−/− (A) and Gαt−/−Pd−/− (B) mice were plotted as functions of flash strength. The data were fitted using a single term of Equation 1, and the fitting parameters are summarized in Table 5. C, The values of b-wave half-saturating flash intensities were plotted as a function of background luminance and fitted with the Weber equation, I0.5 = K × (IB + ID), where K is a constant, IB is the background light intensity, and ID is the intensity at which b-wave dark sensitivity was reduced by a factor of 2 (Saszik et al., 2002). The fitting parameters were K = 0.59 ± 0.02, ID = 3.6 ± 2.4 cd/m2 for Gαt−/− mice (coefficient of determination, R2 = 0.98) and K = 0.17 ± 0.01, ID = 229 ± 7 cd/m2 for Gαt−/−Pd−/− mice (R2 = 0.99). D, The Weber analysis of the inverted Rmax/I0.5 ratios was performed as in C. The fitting parameters were K = 0.0032 ± 0.0002, ID = 3.1 ± 1.2 cd/m2 for Gαt−/− mice (R2 = 0.98) and K = 0.0010 ± 0.0001, ID = 158 ± 1 cd/m2 for Gαt−/−Pd−/− mice (R2 = 0.99). It should be noted that these plots were initially fitted with a generalized Weber relation (Rmax/I0.5)/(Rmax/I0.5)dark = 1/(1 + (Ib/ID)n) (Cameron et al., 2006), where a slope of n = 1 would indicate changes in b-wave sensitivity that were proportional to changes in background luminance, as assumed in the analysis described above. The slopes were actually close to 1 (n = 0.88 ± 0.04 for Gαt−/− and n = 1.02 ± 0.09 for Gαt−/−Pd−/− mice).
The b-wave phenotype of phosducin knock-out mice cannot be explained by a reduced transducin content in their rods
One potential explanation for the decreased sensitivity of rod ERG b-waves in Pd−/− mice is that their rods contain ∼20–30% less transducin than WT rods (Krispel et al., 2007). Single-cell recordings from rods of Pd−/− mice conducted by Krispel et al. (2007) indicated that this reduction in transducin was reflected by ∼1.5-fold reduction in dark-adapted response sensitivity. However, our current ERG data indicate that rod-driven b-waves in Pd−/− mice are ∼2.7-fold less sensitive than in WT mice under dark-adapted conditions. Therefore, the lack of phosducin is likely to affect the synaptic transmission between rods and rod bipolar cells in addition to any effects related to a reduced transducin expression.
To obtain additional evidence that the reduction in transducin content alone cannot explain most phenomena observed in Pd−/− mice, we analyzed the parameters of ERG b-waves in another mouse model, the transducin γ-subunit heterozygous mouse (Gγ1+/−), in which rods are characterized by a similar ∼30–40% reduction in their transducin content (Lobanova et al., 2008). Suction electrode recordings obtained with rods of Gγ1+/− mice (Fig. 4; for complete set of parameters, see Table 2) indicated that the flash sensitivity of their dark-adapted responses was reduced by ∼1.4-fold, very similar to the corresponding reduction in Pd−/− rods (Krispel et al., 2007). ERG recordings from dark-adapted Gγ1+/− mice (Fig. 5) revealed ∼1.7-fold reduction in b-wave flash sensitivity (p = 0.044), which is more in line with the reduction in transducin content than the effect caused by phosducin knock-out. The unpaired, two-sample t test revealed that the remaining difference between the reductions in b-wave sensitivities in Pd−/− and Gγ1+/− mice was statistically significant (p = 0.017). Furthermore, the reduction in transducin content in Gγ1+/− mice did not cause any notable abnormality in response desensitization caused by background light after correcting the data for the reduction in dark-adapted b-wave sensitivity (Fig. 3, violet symbols; Table 3). This is in striking contrast to the fourfold Rmax/I0.5 ratio shift observed in Pd−/− mice (Fig. 3C, red symbols). These data demonstrate that a part of the reduction in dark-adapted b-wave flash sensitivity and the entire reduction of light adaptation caused by the phosducin knock-out do not originate from impaired phototransduction.
Figure 4.

Light responses of individual WT and Gγ1+/− rods. A, B, Families of flash responses from representative WT and Gγ1+/− rods. Flash strengths ranged from 9 to 4000 photons/μm2. C, Normalized response amplitudes as a function of flash strength for the Gγ1+/− rod (open circles) and the wild-type rod (filled circles) shown in B. Points were fitted by saturating exponential functions. Dark currents were 15.5 pA (WT) and 11.8 pA (Gγ1+/−).
Table 2.
Characteristics of dark-adapted mouse rods from Gγ1+/− mice
| E (pA) | Time-to-peak (ms) | τrec (ms) | Integrationtime (ms) | Elementary amplitude (pA) | Io (photons/μm2) | τD (ms) | |
|---|---|---|---|---|---|---|---|
| WT | 14.6 ± 0.9 (18) | 115 ± 6 (18) | 175 ± 11 (18) | 256 ± 12 (18) | 0.95 ± 0.2 (18) | 59.8 ± 3.2 (18) | 227 ± 15 (16) |
| Gg1+/− | 14.8 ± 1.0 (18) | 105 ± 10 (18) | 169 ± 13 (18) | 258 ± 22 (18) | 0.54 ± 0.10 (17) | 81.1 ± 4.6* (18) | 203 ± 24 (13) |
Number of recorded rods are given in parentheses. τrec was determined by fitting a single-exponential function to the final falling phase of the dim flash response, Io is the flash strength that elicited a half-maximal response, and τD is the dominant time constant of photoresponse recovery as defined by Pepperberg et al. (1992).
*p = 0.0004, Student's two-tailed t test with equal variances.
Figure 5.
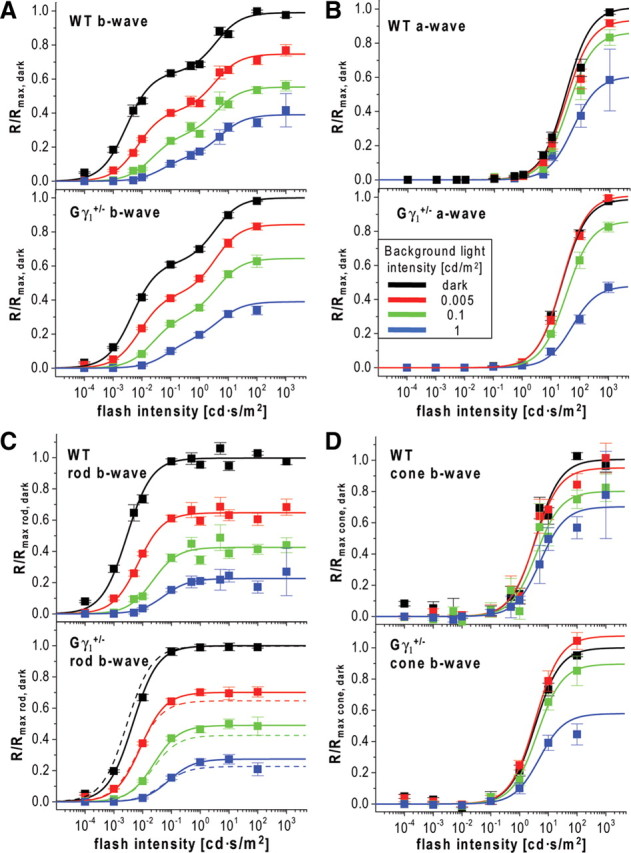
Reduced dark sensitivity and normal light adaptation in Gγ1+/− mice. A, B, Response amplitudes, R, of ERG b-waves (A) and a-waves (B) from WT and Gγ1+/− mice were normalized to the maximal values measured in the dark (Rmax, dark) and plotted as functions of flash strength. Data points were fitted as in Figure 2, A and B. The fits are shown as solid lines, and the corresponding parameters for Gγ1+/− mice are summarized in Table 3. C, D, The rod- and cone-driven components of the b-wave stimulus–response curves in A are plotted individually as in Figure 2C. Color code: Dark-adapted mice, black; light adapted at 0.005 cd/m2, red; 0.1 cd/m2, green; 1 cd/m2, blue.
Table 3.
Parameters obtained from fitting a- and b-wave amplitudes of Gγ1+/− mice to Equation 1
| I0.5,1 (cd · m2) | Rmax,1 | I0.5,2 (cd · s/m2) | Rmax,2 | |
|---|---|---|---|---|
| a-wave | ||||
| Dark | 24.0 ± 0.7 | 0.99 ± 0.01 | ||
| 0.005 cd/m2 | 24.3 ± 0.7 | 1.01 ± 0.01 | ||
| 0.02 cd/m2 | 37.6 ± 1.4 | 0.83 ± 0.01 | ||
| 0.1 cd/m2 | 34.1 ± 0.4 | 0.86 ± 0.00 | ||
| 1 cd/m2 | 54.0 ± 4.5 | 0.48 ± 0.01 | ||
| b-wave | ||||
| Dark | 0.005 ± 0.001 | 0.62 ± 0.01 | 3.4 ± 0.5 | 0.38 ± 0.01 |
| 0.005 cd/m2 | 0.009 ± 0.001 | 0.43 ± 0.05 | 3.5 ± 0.3 | 0.41 ± 0.01 |
| 0.02 cd/m2 | 0.014 ± 0.001 | 0.39 ± 0.01 | 3.7 ± 0.5 | 0.26 ± 0.01 |
| 0.1 cd/m2 | 0.025 ± 0.002 | 0.30 ± 0.01 | 4.1 ± 0.5 | 0.34 ± 0.01 |
| 1 cd/m2 | 0.082 ± 0.019 | 0.17 ± 0.03 | 4.8 ± 3.4 | 0.22 ± 0.02 |
Errors are given as SEM; n = 11.
Unlike b-waves, the absolute dark-adapted sensitivity and adaptation of a-waves were not significantly affected by phosducin knock-out (Fig. 2B). Notably, the ∼1.5-fold light-sensitivity reduction in Pd−/− mice documented by single-cell recordings (see above) (Krispel et al., 2007) was not paralleled by any reliable reduction in the sensitivity of a-waves. The same was true for Gγ1+/− mice (Table 3). Perhaps this reflects the fact that b-waves are better suited for measuring rod-driven responses in dim light at which the suction electrode recordings are the most sensitive to reflect small changes in phototransduction.
Characterization of the phosducin knock-out phenotype using a saturating flash ERG protocol
An alternative ERG protocol for studying light adaptation in the retina is based on applying a single saturating flash presented in the dark and at several background light intensities (Cameron et al., 2006). We used this protocol to analyze light adaptation in WT and Pd−/− mice at the flashes of 1 cd · s/m2 (Fig. 6A). Although the amplitudes of the dark-adapted b-waves were identical, the presence of background light caused much smaller b-wave suppression in Pd−/− mice than in WT controls. The analysis of normalized b-wave amplitudes (R/Rdark) plotted as a function of background luminance and fitted by Equation 2 demonstrated that the background luminance causing a half-maximal reduction of response amplitude in Pd−/− was ∼11-fold higher than in WT animals (0.086 vs 0.008 cd/m2) (Fig. 6B; Table 4). This large shift can be explained by a combination of the 2.7-fold reduction in the effective background luminance, given the dark-adapted sensitivity (Fig. 2C) and the ∼4-fold difference in Rmax/I0.5 ratio reduction (Fig. 3C). Another feature of Pd−/− mice was that the plot in Figure 6B had a steeper slope than the plot for WT mice, as reflected by a larger Hill coefficient (n = 0.61 vs n = 0.38) (Table 4). As a consequence, the range of background luminance causing b-wave desensitization in Pd−/− mice was both shifted and reduced. Overall, the single saturating flash protocol is a rapid and efficient approach to describe the major features of the phosducin knock-out phenotype, which we used in several control experiments outlined in this and the next section.
Table 4.
Parameters obtained from fitting the data in Figures 6, B and C, and 7D to Equation 2
| n | Ihalf (cd/m2) | Rmax | |
|---|---|---|---|
| a-wave | |||
| WT | 0.71 ± 0.03 | 0.20 ± 0.01 | 1.00 ± 0.01 |
| Pd−/− | 0.78 ± 0.08 | 0.12 ± 0.02 | 1.00 ± 0.02 |
| Pd+/+a | 0.70 ± 0.10 | 0.22 ± 0.05 | 0.86 ± 0.02 |
| Pd−/−a | 0.70 ± 0.10 | 0.49 ± 0.12 | 1.18 ± 0.03 |
| TgPd+Pd−/− | 0.71 ± 0.07 | 0.30 ± 0.05 | 1.00 ± 0.01 |
| noPoP+Pd−/− | 0.70 ± 0.03 | 0.30 ± 0.02 | 1.00 |
| TgP−Pd−/− | 0.76 ± 0.06 | 0.46 ± 0.06 | 1.00 |
| b-wave | |||
| WT | 0.38 ± 0.01 | 0.008 ± 0.001 | 1.00 |
| Pd−/− | 0.61 ± 0.03 | 0.086 ± 0.010 | 1.02 ± 0.01 |
| Pd+/+a | 0.38 ± 0.02 | 0.018 ± 0.003 | 0.95 ± 0.00 |
| Pd−/−a | 0.50 ± 0.02 | 0.143 ± 0.012 | 0.99 ± 0.01 |
| TgPd+Pd−/− | 0.37 ± 0.01 | 0.025 ± 0.001 | 1.00 |
| noPoP+Pd−/− | 0.36 ± 0.01 | 0.024 ± 0.001 | 1.00 |
| TgPd−Pd−/− | 0.61 ± 0.02 | 0.215 ± 0.010 | 1.00 |
Errors are given as SEM. The numbers of analyzed eyes were 9 WT, 6 Pd−/−, 4 Pd+/+ littermates, 3 Pd−/− littermates, 7 tgPd−Pd−/−, 5 tgPd+Pd−/−, and 8 noPoP+Pd−/−.
aPd+/+ and Pd−/− littermates obtained from breeding heterozygous Pd+/− animals.
To rule out any possible contributions to ERG recordings arising from the strain differences between WT (C57BL/6J) and Pd−/− mice (mixed C57BL/6J and 129sv backgrounds), we bred heterozygous mice to obtain Pd−/− and Pd+/+ littermates and repeated ERG experiments using the single saturating flash protocol. The results, plotted as open symbols in Figure 6, B and C, and fitted by Equation 2 (Table 4), were very similar to those obtained from non-littermate animals, indicating that the strain difference is not a significant factor in this study. Finally, we should note that the analysis of a-wave amplitudes using this protocol did not reveal a reliable difference between Pd−/− and WT mice (Fig. 6C). This is another indication that phosducin knock-out does not significantly affect phototransduction, at least within the sensitivity limits that a-waves may provide (see above).
Transgenic expression of phosducin or its mutant lacking phosphorylation sites rescues the rod-specific phenotype of phosducin knock-out
All published immunolocalization studies concluded that the localization of phosducin in the retina is restricted to rods and cones (Lee et al., 1988; von Schantz et al., 1994; Sokolov et al., 2004; Chen et al., 2005), which argues that the ERG b-wave phenotype of the Pd−/− mice has a presynaptic origin. However, the spatial resolution of published immunogold data is not sufficient to completely exclude that a portion of phosducin might also be expressed in dendritic tips of bipolar or horizontal cells (Chen et al., 2005), which calls for additional experiments eliminating a possibility that phosducin may act postsynaptically.
We addressed this concern by transgenically expressing a myc-tagged phosducin in Pd−/− mice under the control of the rod-specific rhodopsin promoter. The localization pattern of this construct in retina cross-sections visualized by anti-myc antibodies (Fig. 7A) was similar to that of endogenous phosducin described previously in wild-type retinas (Sokolov et al., 2004), with most immunostaining observed in inner segments and synaptic terminals. Quantification of myc-tagged phosducin expressed in this mouse, conducted by quantitative Western blotting using recombinant myc-tagged phosducin standards (Fig. 7B), revealed that it was expressed at ∼1:50 ± 12 molar ratio to rhodopsin (n = 6), which corresponds to ∼25% of its normal amount in mammalian rods (Sokolov et al., 2004). Testing these mice with the single-flash ERG protocol indicated that this amount was sufficient to provide a nearly complete rescue of the rod b-wave phenotype observed in Pd−/− mice (Fig. 7C,D; Table 4). These data provide additional confirmation for the presynaptic origin of the phosducin knock-out phenotype.
Phosducin is a phosphoprotein, and it has been suggested that its function in rods is regulated by phosphorylation with PKA and/or CaMKII kinases (Lee et al., 1984; Bauer et al., 1992; Yoshida et al., 1994; Thulin et al., 2001; Lee et al., 2004). Therefore, we repeated the transgenic experiment using a construct encoding the myc-tagged phosducin mutant lacking all known phosphorylation sites (we called it noPoP for “no phosphorylation of phosducin”). Immunostaining revealed a pattern similar to that of WT myc-tagged phosducin, although the staining intensity was higher (Fig. 7A). Accordingly, quantitative Western blotting indicated that the expression level of this mutant was higher and identical to that of normal phosducin in WT rods (∼1:13 ± 3 molar ratio to rhodopsin; n = 6) (Fig. 7B). The ERG analysis of these animals revealed that noPoP phosducin rescued the phosducin knock-out phenotype as efficiently as the wild-type transgene (Fig. 7C,D; Table 4), indicating that phosducin phosphorylation is unlikely to play a role in the underlying mechanism.
Phosducin knock-out does not affect the morphology of rod synaptic terminals
We next addressed whether the b-wave phenotype of phosducin knock-out could be associated with any morphological abnormalities of the rod-to-rod bipolar cell synapse. Transmission electron microscopic analysis of three WT and five Pd−/− retinas (at least 15 synapses per retina) did not reveal any notable difference. This was judged from the overall dimension of the synaptic terminal, the appearance and length of synaptic ribbons, the invaginations of horizontal cells and dendritic tips of rod bipolar cells, and the presence of numerous synaptic vesicles. Three randomly chosen images of synapses from each retina type are shown in Figure 8.
Figure 8.
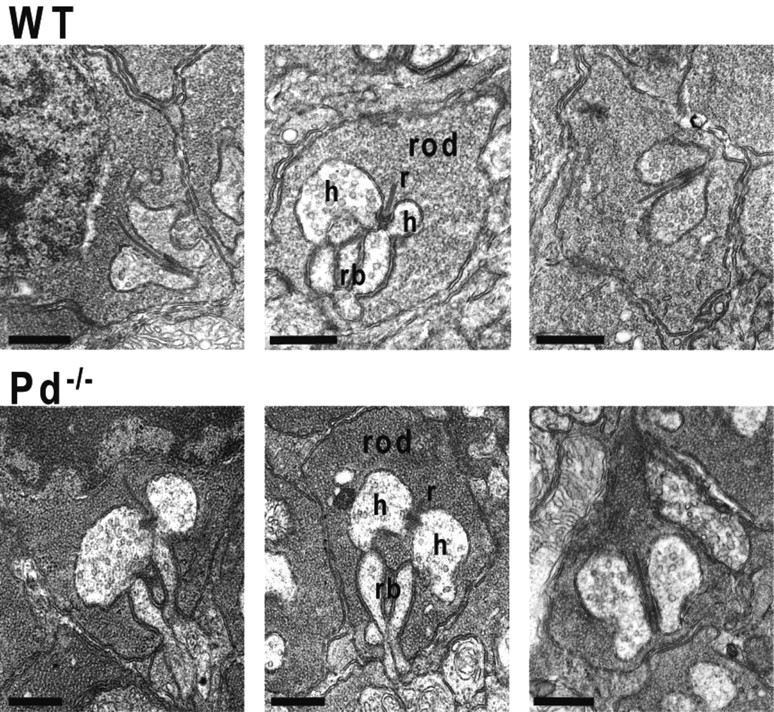
Representative electron micrographs of the rod-to-rod bipolar cell synapses from WT and Pd−/− mice. Three examples of rod synaptic terminals from WT and Pd−/− are chosen from the total of 45 synapses examined for each animal type. r, Ribbon; h, horizontal cell processes; rb, rod bipolar dendritic tip. Scale bars, 500 nm.
Phosducin knock-out affects cone-driven ERG b-waves to a larger degree than rod-driven b-waves
We next studied the effects of phosducin knock-out on cone pathway function. A common approach to isolating cone-driven ERG components is to subject mice to constant bright light sufficient to completely suppress any rod inputs (Lyubarsky et al., 1999; Weymouth and Vingrys, 2008). Representative responses from Pd−/− and WT mice in the presence of background luminance of 50, 100, and 500 cd/m2 (each completely suppressing rod ERGs) are shown in Figure 9A, and the data averaged from five eyes of each type are presented in Figure 9, B and C. The latter panels also contain data for dark-adapted cone b-wave responses recorded from the same animals before their light adaptation and calculated by subtracting the rod b-wave component from the biphasic stimulus–response curve (for details of this analysis, see description of Fig. 2). Overall, the responses of Pd−/− mice appeared as if they were already significantly desensitized in the dark. Both the amplitudes and the light sensitivities of dark-adapted b-waves were reduced compared with WT animals, and background light caused only a small additional desensitization. This was very different from desensitization of WT responses, in which background light reduced the maximal b-wave amplitude and increased the half-saturating flash strength (for a complete set of parameters, see Table 5).
Table 5.
Parameters obtained from fitting the b-wave data in Figures 9, B and C, and 11, A and B, to Equation 1
| I0.5 (cd · s/m2) | Rmax (μV) | |
|---|---|---|
| WT | ||
| Dark | 4.8 ± 0.5 | 348 ± 6.0 |
| 50 cd/m2 | 8.6 ± 1.1 | 201.9 ± 3.9 |
| 100 cd/m2 | 18.2 ± 1.3 | 160.6 ± 1.8 |
| 500 cd/m2 | 60.1 ± 2.5 | 153.5 ± 1.6 |
| Pd−/− | ||
| Dark | 67.5 ± 5.6 | 237.0 ± 5.0 |
| 50 cd/m2 | 30.0 ± 6.2 | 189.0 ± 7.0 |
| 100 cd/m2 | 33.1 ± 1.3 | 205.2 ± 1.8 |
| 500 cd/m2 | 82.0 ± 11.0 | 206.6 ± 7.0 |
| Gαt−/− | ||
| Dark | 2.1 ± 0.2 | 245.8 ± 2.5 |
| 10 cd/m2 | 11.4 ± 1.0 | 217.4 ± 2.9 |
| 50 cd/m2 | 39.1 ± 7.0 | 189.3 ± 7.2 |
| 100 cd/m2 | 57.2 ± 2.6 | 186.5 ± 2.0 |
| 500 cd/m2 | 159.3 ± 12.0 | 166.2 ± 3.6 |
| Gαt−/−Pd−/− | ||
| Dark | 41.4 ± 5.3 | 246.9 ± 6.9 |
| 10 cd/m2 | 43.0 ± 5.2 | 252.5 ± 6.8 |
| 50 cd/m2 | 46.3 ± 4.8 | 209.2 ± 4.9 |
| 100 cd/m2 | 49.5 ± 5.3 | 188.1 ± 4.6 |
| 500 cd/m2 | 124.3 ± 4.5 | 181.4 ± 1.9 |
Errors are given as SEM. The numbers of analyzed eyes were 5 WT, 5 Pd−/−, 11 Gαt−/−, and 11 Gαt−/−Pd−/−.
To investigate this phenomenon more quantitatively, we switched to using transducin α-subunit knock-out mice (Gαt−/−), in which rods are completely unresponsive to light and ERGs are driven exclusively by cones (Calvert et al., 2000). This enabled us to measure dark-adapted cone b-wave responses directly and to include measurements at background light intensities insufficient to completely suppress rods in WT animals. The Gαt−/−Pd−/− double knock-out mice have been shown previously to have normal retina morphology (Lobanova et al., 2008), just as the single Gαt−/− knock-out mice (Calvert et al., 2000) that served as controls. Both mouse types were tested with the complete ERG protocol similar to that used in Figure 2 but using brighter background lights (10, 50, 100, and 500 cd/m2).
A representative set of ERG responses (Fig. 10A) illustrates that b-waves recorded from Gαt−/−Pd−/− mice had reduced dark-adapted flash sensitivity and resisted additional desensitization by background light that was well displayed in control Gαt−/− animals. As in the case of rod b-waves (Fig. 1B), we confirmed that b-waves recorded in this experiment originated primarily from cone ON-bipolar cells by repeating ERG recordings after intravitreal injections of APB, which efficiently abolished b-wave responses under all conditions of illumination in both animal types (Fig. 10B). b-wave amplitudes averaged from 11 Gαt−/−Pd−/− and Gαt−/− eyes were plotted as functions of flash strength (Fig. 11A,B; for a complete set of individual parameters, see Table 5), revealing that the most striking effect of the phosducin knock-out is a ∼20-fold reduction in the sensitivity of dark-adapted cone b-wave responses. Background light caused additional b-wave desensitization in Gαt−/−Pd−/− mice, reaching approximately the same light sensitivity level as Gαt−/− controls for the brightest background applied. Therefore, cone-driven b-waves of Gαt−/−Pd−/− mice behaved approximately normally in the strongly light-adapted state but lacked the ability to regain sensitivity in the dark or at lower levels of background illumination.
To determine whether the desensitization observed in each animal type followed Weber's law, we plotted both b-wave half saturation and the inverse of the Rmax/I0.5 ratio as a function of background luminance (Fig. 11C,D). The data for the Gαt−/− mice followed Weber's law reasonably well (apart perhaps from the Gαt−/− responses recorded at the brightest background). However, Gαt−/−Pd−/− mice displayed not only a major reduction in dark-adapted sensitivity but also a large change in the background luminance that desensitized the b-wave, indicative of a major impairment of light adaptation in cone-driven b-wave responses.
Overall, this phenotype resembles the behavior of rod-driven b-waves, although the extent of the dark-adaptation impairment was significantly larger. We also noted that cone-driven b-waves recorded from Pd−/− mice were characterized by accelerated recovery (particularly in the case of Gαt−/−Pd−/− mice), although we cannot offer a mechanistic explanation to this phenomenon based on available information.
Overall, the analyses of cone-driven b-waves by the two approaches illustrated in Figures 9 and 11 yielded similar results. Interestingly, the maximal dark-adapted cone-driven b-wave amplitudes were nearly identical in Pd−/−, Gαt−/−Pd−/−, and Gαt−/− mice and ∼100 μV smaller than the calculated value for WT animals from Figure 9B. Given that the values of dark-adapted b-wave amplitudes in Figure 9 were calculated but in Figure 11 were directly measured, we consider the latter more reliable. Therefore, we conclude that the maximal amplitude of dark-adapted cone b-waves is not affected by the phosducin knock-out, just as seen for the corresponding parameter in rods.
The cone-specific phenotype of phosducin knock-out cannot be explained by a reduced expression of cone transducin
In the last set of experiments, we investigated whether the large rod/cone difference in the loss of dark-adapted b-wave sensitivity may be explained by a larger reduction in transducin expression level in cones versus rods of Pd−/− mice. This was accomplished by analyzing both intracellular localization and the expression level of cone transducin in retinas of Pd−/− mice. Immunostaining of cone transducin α-subunit in Pd−/− mice indicated that it is normally localized to cone outer segments (Fig. 12A). Quantitative Western blotting revealed that its expression level is actually reduced by ∼43% compared with WT retinas (Fig. 12B) (44 ± 1% reduction in Pd−/− compared with WT mice, n = 2; 42 ± 1% reduction in Gαt−/−Pd−/− compared with Gαt−/− mice, n = 2). This reduction is somewhat more significant than the ∼20% reduction in the content of rod transducin in these animals (Krispel et al., 2007). However, the hyperbolic relation between the outer segment content of transducin and the rate of its activation (Heck and Hofmann, 2001; for review, see Arshavsky et al., 2002) suggests that this 43% reduction could not cause more than a similar reduction in dark-adapted photoreceptor sensitivity, which is insufficient to explain the 20-fold effect on b-wave sensitivity that we observed. Similarly, the large reduction of b-wave desensitization in Gαt−/−Pd−/− mice as reflected in the Weber plots in Figure 11, C and D, is more significant than the reduction in the transducin concentration, suggesting that the underlying mechanism resides downstream from cone outer segments. Finally, the content of the cone-specific isoform of arrestin, Arr4, was normal in Pd−/− mice (Fig. 12B), indicating that the overall health of cones was not affected by the phosducin knock-out.
Figure 12.

The cone-specific Gαt isoform is normally localized to cone outer segments of Pd−/− mice, although at a reduced amount. A, Confocal fluorescence images of retina cross-sections from WT and Pd−/− mice stained with antibodies against the cone-specific Gαt subunit (red) and anti-peanut agglutinin lectin (green) marking the cone cell surface. B, A representative example of quantification of cone Gαt in the retinas of Gαt−/− and Gαt−/−Pd−/− mice. Western blots of retina lysate aliquots from Gαt−/− and Gαt−/−Pd−/− mice containing equal amount of total protein (15 μg) were probed with specific antibodies against cone Gαt. The same samples were probed with antibodies against the cone-specific isoform of arrestin (Arr4) and actin. The densitometry of protein bands, conducted as described in Materials and Methods, revealed a 43% reduction of cone Gαt in Gαt−/−Pd−/− retinas and unchanged amounts of Arr4 and actin. The data are taken from one of four similar experiments.
Discussion
The modulation of bipolar cell sensitivity by light adaptation was discovered from the analysis of ERG b-waves more than four decades ago (Dowling, 1967), yet it remains very poorly understood. Light adaptation at the level of the bipolar cells occurs at background luminance far dimmer than in photoreceptors and are reflected by complex biphasic changes in the gain of bipolar cell response (Dunn et al., 2006). These changes likely occur at both the level of the bipolar cells themselves and/or the level of the photoreceptor-to-bipolar synapse (Thoreson, 2007; Snellman et al., 2008). At higher intensities, light-induced desensitization follows adaptive changes in the phototransduction cascade in photoreceptor outer segments (Dunn et al., 2006). Our current study argues that at least one major underlying mechanism has a presynaptic origin. We report that knock-out of the photoreceptor-specific protein phosducin reduces bipolar cell response sensitivity in the dark and diminishes the degree of response desensitization, which normally takes place during persistent illumination. These effects were observed in both rod- and cone-driven pathways, with the latter affected most significantly.
Established functions of phosducin in photoreceptors
Phosducin is perhaps the most mysterious photoreceptor-specific protein. Discovered more than two decades ago as a major phosphoprotein in rods (Lee et al., 1984, 1987, 1988; von Schantz et al., 1994), it was subsequently shown to interact with multiple βγ-subunits of heterotrimeric G-proteins (Lee et al., 1987, 1992; Müller et al., 1996). However, both the scope and specific role(s) of such interactions remain poorly understood.
Early studies suggested that phosducin contributes to light adaptation in the phototransduction cascade by sequestering the βγ-subunits of transducin and preventing efficient transducin activation by photoexcited rhodopsin (Lee et al., 1984, 1992, 2004). However, this hypothesis was rejected in the study of light adaptation in phosducin knock-out rods (Krispel et al., 2007). Conversely, the same study established that phosducin is involved in the regulation of transducin expression level because rods of phosducin knock-out mice contain 20–30% less transducin than normally. Here we demonstrate that a comparable ∼40% reduction in transducin takes place in cones of these mice. Another function of phosducin, also revealed in the studies of Pd−/− mice, is to facilitate the light-driven translocation of transducin βγ-subunit from rod outer segments (Sokolov et al., 2004), presumably by promoting the dissociation of the βγ-subunits from the disc membranes of rod outer segments (Lee et al., 1992; Yoshida et al., 1994; Kosloff et al., 2008). However, both of these phosducin knock-out phenotypes are relatively modest, which may suggest that the major function of phosducin remains to be uncovered.
Phosducin participates in the regulation of synaptic transmission in rods and cones
The role of phosducin in photoreceptor synaptic transmission was first proposed in Nakano et al., (2001), based on the observation that a fraction of phosducin resides in rod synaptic terminals. However, this idea had not been tested experimentally and in fact phosducin localizes not just to synapses but to all subcellular compartments of the photoreceptor cell (Thulin et al., 1999; Sokolov et al., 2004).
Here we provide the first experimental evidence that phosducin indeed contributes to the regulation of synaptic transmission in photoreceptors. Both rods and cones of phosducin knock-out mice behaved as if they were persistently desensitized. The dark sensitivity of ERG b-waves was reduced by ∼20-fold for the cone-driven and by ∼3-fold for the rod-driven responses, and the extent of response desensitization caused by background light was also diminished for both cell types. We conclude that this phenomenon originates primarily from mechanism(s) in photoreceptors acting downstream from phototransduction, based on the following arguments.
Although phosducin knock-out causes a reduction in transducin content in rods and cones, the degree of this reduction is grossly insufficient to explain the loss of b-wave sensitivity in dark-adapted Pd−/− mice. This is well illustrated by a direct comparison of the light responses in two mouse lines, phosducin knock-out and Gγ1 hemizygote. Both display a similar reduction in transducin content in their rods, causing a nearly identical ∼1.5-fold reduction in the sensitivity of dim flash rod photoresponses recorded by suction electrodes. However, the sensitivity reduction for dark-adapted rod-driven b-waves in Pd−/− mice is 2.7-fold, whereas in Gγ1+/− mice, it is only 1.7-fold. Thus, the sensitivity reduction in the phototransduction cascade of Gγ1+/− mice translates nearly linearly into the sensitivity reduction of their rod-driven b-waves. In contrast, the lack of phosducin strongly amplifies the sensitivity reduction in phototransduction on the level of synaptic transmission. Furthermore, b-wave desensitization by background light is normal in Gγ1+/− mice (after applying appropriate corrections to account for the dark sensitivity reduction) (Fig. 3), whereas in Pd−/− mice this desensitization is diminished. This is despite a complete lack of alteration in light adaptation in the phototransduction of Pd−/− mice documented in exhaustive studies of their rods by suction electrode recordings (Krispel et al., 2007).
Another argument that phosducin regulates photoreceptor output independently of phototransduction is that dark-adapted Pd−/− mice have normal maximal amplitudes of rod- and cone-driven ERG b-waves despite their reduced light sensitivity. However, when a comparable reduction in b-wave sensitivity is caused by persistent illumination in wild-type mice, the maximal b-wave amplitudes are reduced as well. Therefore, the loss of b-wave sensitivity in dark-adapted Pd−/− mice must depend on alternative mechanisms.
Hypotheses on the role of phosducin in synaptic transmission
The mechanisms by which phosducin regulates synaptic transmission are completely unknown. Because the only well documented molecular partners of phosducin are the βγ-subunits of heterotrimeric G-proteins, it is tempting to speculate that synaptic transmission in photoreceptors is regulated by a yet-to-be-identified mechanism involving G-protein action. Indeed, there are multiple indications that G-protein signaling mechanisms distinct from phototransduction may affect photoreceptor synaptic output. For example, Koulen et al. (1999), Higgs and Lukasiewicz (2002), Hosoi et al. (2005), and Koulen et al. (2005) suggested that presynaptic metabotropic glutamate receptors from groups II and III inhibit the glutamate release from photoreceptor synapses, thus imposing a negative feedback loop that restricts the strength of synaptic output in the dark. Another G-protein-coupled receptor found in photoreceptors is the dopamine D4 receptor, which regulates the intracellular cAMP level (Cohen et al., 1992; Jackson et al., 2009). The mechanistic details of how these pathways are organized remain to be explored. One possibility is that Gβγ-subunits could directly act on the synaptic release machinery, a regulatory mechanism documented in other neurons (Blackmer et al., 2001; Yoon et al., 2007, 2008). However the relevance of this Gβγ function to ribbon synapses, which are present in photoreceptors and bipolar cells in the retina and several other cell types, has not been explored yet. Phosducin binding to Gβγ in synaptic terminals could potentially restrict Gβγ availability for the downstream targets. Alternatively, phosducin could sequester Gβγ from their Gα-subunit partners, which could impair their ability to be subsequently activated by the corresponding receptors. Alternatively, phosducin may be engaged in the regulation of Ca2+ dynamics at the synapse. In this case, it would modulate the synaptic output indirectly by affecting the light-induced suppression of vesicle release caused by flash or background light.
Finally, we should note that neither of the above hypothetical mechanisms is likely to rely on phosducin phosphorylation because our data with transgenically expressed noPoP phosducin mutant indicate that phosducin phosphorylation is not required for its role in b-wave modulation. The same likely applies to the previously documented interaction of phosducin with the 14-3-3 protein (Nakano et al., 2001; Thulin et al., 2001) because 14-3-3 interacts specifically with phosphoproteins.
In summary, we have established that the light sensitivity of synaptic output from rods and cones is regulated by a novel phosducin-dependent mechanism. Elucidating the molecular details of this regulation is a challenge for future studies.
Footnotes
This work was supported by National Institutes of Health (NIH) Grants EY10336 (V.Y.A.), EY14047 (M.E.B.), and EY06671 (L.J.F.), NIH Core Grant for Vision Research EY5722 (to Duke University), and a Fight for Sight fellowship (R.H.). We thank P. S. Ferry-Leeper for help in maintaining mouse colonies and Y. Ling for assistance with EM analysis.
References
- Abd-El-Barr MM, Pennesi ME, Saszik SM, Barrow AJ, Lem J, Bramblett DE, Paul DL, Frishman LJ, Wu SM. Genetic dissection of rod and cone pathways in the dark-adapted mouse retina. J Neurophysiol. 2009;102:1945–1955. doi: 10.1152/jn.00142.2009. [DOI] [PMC free article] [PubMed] [Google Scholar]
- Arshavsky VY, Lamb TD, Pugh EN., Jr G proteins and phototransduction. Annu Rev Physiol. 2002;64:153–187. doi: 10.1146/annurev.physiol.64.082701.102229. [DOI] [PubMed] [Google Scholar]
- Bauer PH, Müller S, Puzicha M, Pippig S, Obermaier B, Helmreich EJ, Lohse MJ. Phosducin is a protein kinase A-regulated G-protein regulator. Nature. 1992;358:73–76. doi: 10.1038/358073a0. [DOI] [PubMed] [Google Scholar]
- Blackmer T, Larsen EC, Takahashi M, Martin TF, Alford S, Hamm HE. G protein βγ subunit-mediated presynaptic inhibition: regulation of exocytotic fusion downstream of Ca2+ entry. Science. 2001;292:293–297. doi: 10.1126/science.1058803. [DOI] [PubMed] [Google Scholar]
- Blüml K, Schnepp W, Schröder S, Beyermann M, Macias M, Oschkinat H, Lohse MJ. A small region in phosducin inhibits G-protein βγ-subunit function. EMBO J. 1997;16:4908–4915. doi: 10.1093/emboj/16.16.4908. [DOI] [PMC free article] [PubMed] [Google Scholar]
- Burns ME, Arshavsky VY. Beyond counting photons: trials and trends in vertebrate visual transduction. Neuron. 2005;48:387–401. doi: 10.1016/j.neuron.2005.10.014. [DOI] [PubMed] [Google Scholar]
- Calvert PD, Krasnoperova NV, Lyubarsky AL, Isayama T, Nicoló M, Kosaras B, Wong G, Gannon KS, Margolskee RF, Sidman RL, Pugh EN, Jr, Makino CL, Lem J. Phototransduction in transgenic mice after targeted deletion of the rod transducin α-subunit. Proc Natl Acad Sci U S A. 2000;97:13913–13918. doi: 10.1073/pnas.250478897. [DOI] [PMC free article] [PubMed] [Google Scholar]
- Cameron AM, Mahroo OA, Lamb TD. Dark adaptation of human rod bipolar cells measured from the b-wave of the scotopic electroretinogram. J Physiol. 2006;575:507–526. doi: 10.1113/jphysiol.2006.108027. [DOI] [PMC free article] [PubMed] [Google Scholar]
- Cameron AM, Miao L, Ruseckaite R, Pianta MJ, Lamb TD. Dark adaptation recovery of human rod bipolar cell response kinetics estimated from scotopic b-wave measurements. J Physiol. 2008;586:5419–5436. doi: 10.1113/jphysiol.2008.160028. [DOI] [PMC free article] [PubMed] [Google Scholar]
- Chen J, Yoshida T, Nakano K, Bitensky MW. Subcellular localization of phosducin in rod photoreceptors. Vis Neurosci. 2005;22:19–25. doi: 10.1017/S0952523805221028. [DOI] [PubMed] [Google Scholar]
- Cohen AI, Todd RD, Harmon S, O'Malley KL. Photoreceptors of mouse retinas possess D4 receptors coupled to adenylate cyclase. Proc Natl Acad Sci U S A. 1992;89:12093–12097. doi: 10.1073/pnas.89.24.12093. [DOI] [PMC free article] [PubMed] [Google Scholar]
- Demb JB. Functional circuitry of visual adaptation in the retina. J Physiol. 2008;586:4377–4384. doi: 10.1113/jphysiol.2008.156638. [DOI] [PMC free article] [PubMed] [Google Scholar]
- Dowling JE. The site of visual adaptation. Science. 1967;155:273–279. doi: 10.1126/science.155.3760.273. [DOI] [PubMed] [Google Scholar]
- Dunn FA, Rieke F. Single-photon absorptions evoke synaptic depression in the retina to extend the operational range of rod vision. Neuron. 2008;57:894–904. doi: 10.1016/j.neuron.2008.01.031. [DOI] [PMC free article] [PubMed] [Google Scholar]
- Dunn FA, Doan T, Sampath AP, Rieke F. Controlling the gain of rod-mediated signals in the mammalian retina. J Neurosci. 2006;26:3959–3970. doi: 10.1523/JNEUROSCI.5148-05.2006. [DOI] [PMC free article] [PubMed] [Google Scholar]
- Fain GL, Matthews HR, Cornwall MC, Koutalos Y. Adaptation in vertebrate photoreceptors. Physiol Rev. 2001;81:117–151. doi: 10.1152/physrev.2001.81.1.117. [DOI] [PubMed] [Google Scholar]
- Green DG. The search for the site of visual adaptation. Vision Res. 1986;26:1417–1429. doi: 10.1016/0042-6989(86)90165-3. [DOI] [PubMed] [Google Scholar]
- Green DG, Powers MK. Mechanisms of light adaptation in rat retina. Vision Res. 1982;22:209–216. doi: 10.1016/0042-6989(82)90120-1. [DOI] [PubMed] [Google Scholar]
- Heck M, Hofmann KP. Maximal rate and nucleotide dependence of rhodopsin-catalyzed transducin activation: initial rate analysis based on a double displacement mechanism. J Biol Chem. 2001;276:10000–10009. doi: 10.1074/jbc.M009475200. [DOI] [PubMed] [Google Scholar]
- Herrmann R, Heck M, Henklein P, Kleuss C, Hofmann KP, Ernst OP. Sequence of interactions in receptor-G protein coupling. J Biol Chem. 2004;279:24283–24290. doi: 10.1074/jbc.M311166200. [DOI] [PubMed] [Google Scholar]
- Higgs MH, Lukasiewicz PD. Activation of group II metabotropic glutamate receptors inhibits glutamate release from salamander retinal photoreceptors. Vis Neurosci. 2002;19:275–281. doi: 10.1017/s0952523802192054. [DOI] [PubMed] [Google Scholar]
- Hosoi N, Arai I, Tachibana M. Group III metabotropic glutamate receptors and exocytosed protons inhibit L-type calcium currents in cones but not in rods. J Neurosci. 2005;25:4062–4072. doi: 10.1523/JNEUROSCI.2735-04.2005. [DOI] [PMC free article] [PubMed] [Google Scholar]
- Jackson CR, Chaurasia SS, Zhou H, Haque R, Storm DR, Iuvone PM. Essential roles of dopamine D4 receptors and the type 1 adenylyl cyclase in photic control of cyclic AMP in photoreceptor cells. J Neurochem. 2009;109:148–157. doi: 10.1111/j.1471-4159.2009.05920.x. [DOI] [PMC free article] [PubMed] [Google Scholar]
- Kosloff M, Alexov E, Arshavsky VY, Honig B. Electrostatic and lipid anchor contributions to the interaction of transducin with membranes: mechanistic implications for activation and translocation. J Biol Chem. 2008;283:31197–31207. doi: 10.1074/jbc.M803799200. [DOI] [PMC free article] [PubMed] [Google Scholar]
- Koulen P, Kuhn R, Wässle H, Brandstätter JH. Modulation of the intracellular calcium concentration in photoreceptor terminals by a presynaptic metabotropic glutamate receptor. Proc Natl Acad Sci U S A. 1999;96:9909–9914. doi: 10.1073/pnas.96.17.9909. [DOI] [PMC free article] [PubMed] [Google Scholar]
- Koulen P, Liu J, Nixon E, Madry C. Interaction between mGluR8 and calcium channels in photoreceptors is sensitive to pertussis toxin and occurs via G protein βγ subunit signaling. Invest Ophthalmol Vis Sci. 2005;46:287–291. doi: 10.1167/iovs.04-0963. [DOI] [PubMed] [Google Scholar]
- Krispel CM, Sokolov M, Chen YM, Song H, Herrmann R, Arshavsky VY, Burns ME. Phosducin regulates the expression of transducin βγ subunits in rod photoreceptors and does not contribute to phototransduction adaptation. J Gen Physiol. 2007;130:303–312. doi: 10.1085/jgp.200709812. [DOI] [PMC free article] [PubMed] [Google Scholar]
- Lee BY, Thulin CD, Willardson BM. Site-specific phosphorylation of phosducin in intact retina. Dynamics of phosphorylation and effects on G protein βγ dimer binding. J Biol Chem. 2004;279:54008–54017. doi: 10.1074/jbc.M405669200. [DOI] [PubMed] [Google Scholar]
- Lee RH, Brown BM, Lolley RN. Light-induced dephosphorylation of a 33K protein in rod outer segments of rat retina. Biochemistry. 1984;23:1972–1977. doi: 10.1021/bi00304a014. [DOI] [PubMed] [Google Scholar]
- Lee RH, Lieberman BS, Lolley RN. A novel complex from bovine visual cells of a 33,000-dalton phosphoprotein with beta- and gamma-transducin: purification and subunit structure. Biochemistry. 1987;26:3983–3990. doi: 10.1021/bi00387a036. [DOI] [PubMed] [Google Scholar]
- Lee RH, Whelan JP, Lolley RN, McGinnis JF. The photoreceptor-specific 33 kDa phosphoprotein of mammalian retina: generation of monospecific antibodies and localization by immunocytochemistry. Exp Eye Res. 1988;46:829–840. doi: 10.1016/s0014-4835(88)80035-6. [DOI] [PubMed] [Google Scholar]
- Lee RH, Ting TD, Lieberman BS, Tobias DE, Lolley RN, Ho YK. Regulation of retinal cGMP cascade by phosducin in bovine rod photoreceptor cells. Interaction of phosducin and transducin. J Biol Chem. 1992;267:25104–25112. [PubMed] [Google Scholar]
- Lei B, Yao G, Zhang K, Hofeldt KJ, Chang B. Study of rod- and cone-driven oscillatory potentials in mice. Invest Ophthalmol Vis Sci. 2006;47:2732–2738. doi: 10.1167/iovs.05-1461. [DOI] [PubMed] [Google Scholar]
- Lem J, Applebury ML, Falk JD, Flannery JG, Simon MI. Tissue-specific and developmental regulation of rod opsin chimeric genes in transgenic mice. Neuron. 1991;6:201–210. doi: 10.1016/0896-6273(91)90356-5. [DOI] [PubMed] [Google Scholar]
- Lobanova ES, Finkelstein S, Song H, Tsang SH, Chen CK, Sokolov M, Skiba NP, Arshavsky VY. Transducin translocation in rods is triggered by saturation of the GTPase-activating complex. J Neurosci. 2007;27:1151–1160. doi: 10.1523/JNEUROSCI.5010-06.2007. [DOI] [PMC free article] [PubMed] [Google Scholar]
- Lobanova ES, Finkelstein S, Herrmann R, Chen YM, Kessler C, Michaud NA, Trieu LH, Strissel KJ, Burns ME, Arshavsky VY. Transducin γ-subunit sets expression levels of α- and β-subunits and is crucial for rod viability. J Neurosci. 2008;28:3510–3520. doi: 10.1523/JNEUROSCI.0338-08.2008. [DOI] [PMC free article] [PubMed] [Google Scholar]
- Luo DG, Xue T, Yau KW. How vision begins: an odyssey. Proc Natl Acad Sci U S A. 2008;105:9855–9862. doi: 10.1073/pnas.0708405105. [DOI] [PMC free article] [PubMed] [Google Scholar]
- Lyubarsky AL, Falsini B, Pennesi ME, Valentini P, Pugh EN., Jr UV- and midwave-sensitive cone-driven retinal responses of the mouse: a possible phenotype for coexpression of cone photopigments. J Neurosci. 1999;19:442–455. doi: 10.1523/JNEUROSCI.19-01-00442.1999. [DOI] [PMC free article] [PubMed] [Google Scholar]
- Lyubarsky AL, Daniele LL, Pugh EN., Jr From candelas to photoisomerizations in the mouse eye by rhodopsin bleaching in situ and the light-rearing dependence of the major components of the mouse ERG. Vision Res. 2004;44:3235–3251. doi: 10.1016/j.visres.2004.09.019. [DOI] [PubMed] [Google Scholar]
- Masu M, Iwakabe H, Tagawa Y, Miyoshi T, Yamashita M, Fukuda Y, Sasaki H, Hiroi K, Nakamura Y, Shigemoto R, Takada M, Nakamura K, Nakao K, Katsuki M, Nakanishi S. Specific deficit of the ON response in visual transmission by targeted disruption of the mGluR6 gene. Cell. 1995;80:757–765. doi: 10.1016/0092-8674(95)90354-2. [DOI] [PubMed] [Google Scholar]
- Müller S, Straub A, Schröder S, Bauer PH, Lohse MJ. Interactions of phosducin with defined G protein βγ-subunits. J Biol Chem. 1996;271:11781–11786. doi: 10.1074/jbc.271.20.11781. [DOI] [PubMed] [Google Scholar]
- Nakano K, Chen J, Tarr GE, Yoshida T, Flynn JM, Bitensky MW. Rethinking the role of phosducin: light-regulated binding of phosducin to 14-3-3 in rod inner segments. Proc Natl Acad Sci U S A. 2001;98:4693–4698. doi: 10.1073/pnas.071067198. [DOI] [PMC free article] [PubMed] [Google Scholar]
- Nomura A, Shigemoto R, Nakamura Y, Okamoto N, Mizuno N, Nakanishi S. Developmentally regulated postsynaptic localization of a metabotropic glutamate receptor in rat rod bipolar cells. Cell. 1994;77:361–369. doi: 10.1016/0092-8674(94)90151-1. [DOI] [PubMed] [Google Scholar]
- Pepperberg DR, Cornwall MC, Kahlert M, Hofmann KP, Jin J, Jones GJ, Ripps H. Light-dependent delay in the falling phase of the retinal rod photoresponse. Vis Neurosci. 1992;8:9–18. doi: 10.1017/s0952523800006441. [DOI] [PubMed] [Google Scholar]
- Petters RM, Alexander CA, Wells KD, Collins EB, Sommer JR, Blanton MR, Rojas G, Hao Y, Flowers WL, Banin E, Cideciyan AV, Jacobson SG, Wong F. Genetically engineered large animal model for studying cone photoreceptor survival and degeneration in retinitis pigmentosa. Nat Biotechnol. 1997;15:965–970. doi: 10.1038/nbt1097-965. [DOI] [PubMed] [Google Scholar]
- Pugh EN, Jr, Falsini B, Lyubarsky AL. Photostasis and related phenomena. New York: Plenum; 1998. The origin of the major rod- and cone-driven components of the rodent electroretinogram and the effect of age and light-rearing history on the magnitude of these components; pp. 93–128. [Google Scholar]
- Pugh EN, Jr, Nikonov S, Lamb TD. Molecular mechanisms of vertebrate photoreceptor light adaptation. Curr Opin Neurobiol. 1999;9:410–418. doi: 10.1016/S0959-4388(99)80062-2. [DOI] [PubMed] [Google Scholar]
- Robson JG, Frishman LJ. Response linearity and kinetics of the cat retina: the bipolar cell component of the dark-adapted electroretinogram. Vis Neurosci. 1995;12:837–850. doi: 10.1017/s0952523800009408. [DOI] [PubMed] [Google Scholar]
- Robson JG, Frishman LJ. Dissecting the dark-adapted electroretinogram. Doc Ophthalmol. 1998;95:187–215. doi: 10.1023/a:1001891904176. [DOI] [PubMed] [Google Scholar]
- Saszik SM, Robson JG, Frishman LJ. The scotopic threshold response of the dark-adapted electroretinogram of the mouse. J Physiol. 2002;543:899–916. doi: 10.1113/jphysiol.2002.019703. [DOI] [PMC free article] [PubMed] [Google Scholar]
- Shapley R, Enroth-Cugell C. Visual adaptation and retinal gain controls. In: Osborne N, Chader G, editors. Progress in retinal research. London: Pergamon; 1984. pp. 263–346. [Google Scholar]
- Shirato S, Maeda H, Miura G, Frishman LJ. Postreceptoral contributions to the light-adapted ERG of mice lacking b-waves. Exp Eye Res. 2008;86:914–928. doi: 10.1016/j.exer.2008.03.008. [DOI] [PMC free article] [PubMed] [Google Scholar]
- Slaughter MM, Miller RF. 2-amino-4-phosphonobutyric acid: a new pharmacological tool for retina research. Science. 1981;211:182–185. doi: 10.1126/science.6255566. [DOI] [PubMed] [Google Scholar]
- Snellman J, Kaur T, Shen Y, Nawy S. Regulation of ON bipolar cell activity. Prog Retin Eye Res. 2008;27:450–463. doi: 10.1016/j.preteyeres.2008.03.003. [DOI] [PMC free article] [PubMed] [Google Scholar]
- Sokolov M, Lyubarsky AL, Strissel KJ, Savchenko AB, Govardovskii VI, Pugh EN, Jr, Arshavsky VY. Massive light-driven translocation of transducin between the two major compartments of rod cells: a novel mechanism of light adaptation. Neuron. 2002;34:95–106. doi: 10.1016/s0896-6273(02)00636-0. [DOI] [PubMed] [Google Scholar]
- Sokolov M, Strissel KJ, Leskov IB, Michaud NA, Govardovskii VI, Arshavsky VY. Phosducin facilitates light-driven transducin translocation in rod photoreceptors. Evidence from the phosducin knock-out mouse. J Biol Chem. 2004;279:19149–19156. doi: 10.1074/jbc.M311058200. [DOI] [PubMed] [Google Scholar]
- Thoreson WB. Kinetics of synaptic transmission at ribbon synapses of rods and cones. Mol Neurobiol. 2007;36:205–223. doi: 10.1007/s12035-007-0019-9. [DOI] [PMC free article] [PubMed] [Google Scholar]
- Thulin CD, Howes K, Driscoll CD, Savage JR, Rand TA, Baehr W, Willardson BM. The immunolocalization and divergent roles of phosducin and phosducin-like protein in the retina. Mol Vis. 1999;5:40. [PubMed] [Google Scholar]
- Thulin CD, Savage JR, McLaughlin JN, Truscott SM, Old WM, Ahn NG, Resing KA, Hamm HE, Bitensky MW, Willardson BM. Modulation of the G protein regulator phosducin by Ca2+/calmodulin-dependent protein kinase II phosphorylation and 14-3-3 protein binding. J Biol Chem. 2001;276:23805–23815. doi: 10.1074/jbc.M101482200. [DOI] [PubMed] [Google Scholar]
- Toda K, Bush RA, Humphries P, Sieving PA. The electroretinogram of the rhodopsin knock-out mouse. Vis Neurosci. 1999;16:391–398. doi: 10.1017/s0952523899162187. [DOI] [PubMed] [Google Scholar]
- Vardi N, Morigiwa K. ON cone bipolar cells in rat express the metabotropic receptor mGluR6. Vis Neurosci. 1997;14:789–794. doi: 10.1017/s0952523800012736. [DOI] [PubMed] [Google Scholar]
- von Schantz M, Szél A, van Veen T, Farber DB. Expression of soluble phototransduction-associated proteins in ground squirrel retina. Invest Ophthalmol Vis Sci. 1994;35:3922–3930. [PubMed] [Google Scholar]
- Weymouth AE, Vingrys AJ. Rodent electroretinography: methods for extraction and interpretation of rod and cone responses. Prog Retin Eye Res. 2008;27:1–44. doi: 10.1016/j.preteyeres.2007.09.003. [DOI] [PubMed] [Google Scholar]
- Xu MQ, Evans TC., Jr Intein-mediated ligation and cyclization of expressed proteins. Methods. 2001;24:257–277. doi: 10.1006/meth.2001.1187. [DOI] [PubMed] [Google Scholar]
- Yoon EJ, Gerachshenko T, Spiegelberg BD, Alford S, Hamm HE. Gβγ interferes with Ca2+-dependent binding of synaptotagmin to the soluble N-ethylmaleimide-sensitive factor attachment protein receptor (SNARE) complex. Mol Pharmacol. 2007;72:1210–1219. doi: 10.1124/mol.107.039446. [DOI] [PubMed] [Google Scholar]
- Yoon EJ, Hamm HE, Currie KP. G protein βγ subunits modulate the number and nature of exocytotic fusion events in adrenal chromaffin cells independent of calcium entry. J Neurophysiol. 2008;100:2929–2939. doi: 10.1152/jn.90839.2008. [DOI] [PMC free article] [PubMed] [Google Scholar]
- Yoshida T, Willardson BM, Wilkins JF, Jensen GJ, Thornton BD, Bitensky MW. The phosphorylation state of phosducin determines its ability to block transducin subunitinteractions and inhibit transducin binding to activated rhodopsin. J Biol Chem. 1994;269:24050–24057. [PubMed] [Google Scholar]