

Abstract
Previously, deficiency in the expression of the nuclear orphan receptor TAK1 was found to be associated with delayed cerebellar granule cell migration and Purkinje cell maturation with a permanent deficit in foliation of lobules VI–VII suggesting a role for TAK1 in cerebellum development. In this study, we confirm that TAK1-deficient (TAK1−/−) mice have a smaller cerebellum and exhibit a disruption of lobules VI–VII. We extended these studies and show that at postnatal day 7 (PND7), TAK1−/− mice exhibit a delay in monolayer maturation of dysmorphic calbindin 28K-positive Purkinje cells. The astrocyte-specific glutamate transporter (GLAST) was expressed within Bergmann fibers and internal granule cell layer at significantly lower levels in the cerebellum of TAK1−/− mice. At PND21, Golgi-positive Purkinje cells in TAK1−/− mice displayed a smaller soma (18%) and shorter distance to first branch point (35%). Neuronal death was not observed in TAK1−/− mice at PND21, however, activated microglia were present in the cerebellum suggestive of earlier cell death. These structural deficits in the cerebellum were not sufficient to alter motor strength, coordination, or activity levels; however, deficits in acoustic startle response, pre-pulse startle inhibition, and social interactions were observed. Reactions to a novel environment were inhibited in a light/dark chamber, open-field, and home-cage running-wheel. TAK1−/− mice displayed a plateau in performance on the running-wheel suggesting a deficit in learning to coordinate performance on a motor task. These data indicate that TAK1 is an important transcriptional modulator of cerebellar development and neurodevelopmentally-regulated behavior.
Keywords: Cerebellum, Behavior, GLAST, Granule cells, Motor Activity, Pre-pulse startle
Introduction
Members of the nuclear receptor superfamily play a critical role in the regulation of many physiological processes and have been implicated in multiple pathologies. TAK1 (TR4, NR2C2) with the closely related receptor TR2 (NR2C1) constitute one subclass of nuclear receptors (1–4). TAK1 functions as a positive or negative regulator of transcription by binding as a homodimer or as a heterodimer with TR2 to DNA response elements consisting of direct repeats of the consensus sequence AGGTCA spanned by 1–5 nucleotides (DR1-5) (5–7). Transcriptional regulation by TAK1 is mediated through recruitment of transcription intermediary factors, co-repressors and co-activators that, through their histone deacetylase or acetylase activities, induce changes in chromatin structure (8, 9).
TAK1 is highly expressed in brain, spleen, testis, and hematopoietic cells (1–4, 7). In adult rodent brain, TAK1 is highly expressed in the external granular layer of the cerebral cortex, the pyramidal cells and dentate granule cells of the hippocampus, and cerebellar granule cells (2, 10). During brain development TAK1 is expressed in a temporal and spatial manner (10). In the embryonic and neonatal cerebella, TAK1 expression patterns are correlated with neurogenesis suggesting a role of TAK1 in regulating cerebellum development (10, 11). During normal postnatal development, dynamic changes occur in the laminar architecture of the cerebellum. The external granule layer (EGL) thickens progressively until a peak is reached at approximately PND7 followed by migration of granule cells through the molecular layer (ML) to the internal granule layer (IGL). Granule neuron precursors migrate into the IGL under the guidance of Bergmann fibers expressing the astrocyte specific glutamate transporter, GLAST (12–14). Granule cell survival is compromised and migration does not occur when Bergmann fibers are disordered and atrophic. However, such structural abnormalities may be secondary to a defect in granule cells (15, 16). In addition, disruption of the granule-cell population has a significant effect upon Purkinje cells, resulting in poor alignment and stunted to mis-oriented dendritic trees (13, 17) and Bergmann fibers may influence the dendritic projections of Purkinje cells (18). In various mouse models of cerebellar development, observed alterations in lobules VI–VII are related to deficits in granule cell migration and Bergmann glia maturation (19–24). In this study, we replicate and expand upon the previously reported delayed migration of cerebellar granular neurons as a function of TAK1 deletion (11, 25). We present data suggesting that this alteration is related to significant deficits in the migratory scaffolding and cell signaling of GLAST Altered structural or functional components of brain development can have long-lasting impacts on neural network connectivity. We now show that the developmental delay in granule cell migration and the disarrangement of the cerebellar Purkinje neurons result in long-term behavioral deficits in response to novel environments, social contact, startle reactivity, deficits in pre-pulse startle inhibition, and cerebellar motor learning in the absence of gross changes in motor coordination. These observations are consistent with the conclusion that the transcriptional regulator TAK1 is an important modulator of neurodevelopment and that alterations in the maturation of the cerebellum can be associated with deficits in non-motor behaviors.
Materials and Methods
TAK1−/− mice
TAK1 knockout were generated by deleting a 6 kb region between intron 5 and 9, resulting in the removal of exons 6–9 and a frame shift in exon 10. Mice were backcrossed onto a C57BL/6 background and housed in a semi-barrier facility (21° ±2°C; 50% ±5% humidity; 12-h light/dark cycle). Heterozygous dams were observed during the first 2-weeks post-partum for nest-building (shredding of 2″×2″ cotton neslett), localization of pups, and, pup retrieval. Suckling was determined by nipple attachment and presence of milk band in the pups. Body weights and whole brain wet weights were recorded at postnatal day (PND) 21 and 4 months of age (n=10–16). All animal studies were conducted according to protocols approved by the Institutional Animal Care and Use Committee at the NIEHS.
Histological Evaluation
Based upon previous studies suggesting PND7 as an age showing cellular alterations in the TR4 null cerebellum (11, 25), related morphological features were examined at this age in TAK1−/− mice. Brains were excised, immersion fixed in 4% paraformaldehyde/phosphate buffer (PFA/PB) for 10 h, rinsed, cryoprotected in 30% sucrose/PBS, and embedded in OCT compound. Cryostat sagittal sections (20 μm) were collected through the entire cerebellar structure. This allowed for a set of sections consistent with orientation and plane of cut for sampling. Sections containing lobules VI–VII were identified and 6 sections for each brain were randomly selected for immunostaining for each antibody. Samples were rehydrated in 1×Automation Buffer (AB; Biomed Corp., Foster City, CA). Endogenous peroxidase activity was blocked with 3% H2O2, avidin-biotin activity quenched (Vector Laboratories, Burlingame, CA), and non-specific protein binding quenched with 10% normal goat serum. Sections were incubated 18 h at 4°C with rabbit anti-calbindin D28 (1:500; Chemicon Intl. Temecula, CA) to identify cerebellar Purkinje cells. Antibody binding was developed using a Vectastain® Elite ABC kit (Vector Labs) and visualized with 3,3′-diaminobenzidine (DAB). Sections were counterstained with hematoxylin QS (Vector Labs). Cryosections were incubated in guinea pig-anti-GLAST (1:1000; Chemicon Intl.) for 2 h at RT followed by incubation with goat anti-guinea pig IgG-biotin conjugate (1:1000; Vector Labs) or streptavidin-Alexafluor-488 (Molecular Probes, Eugene, OR). To examine the localization of new neurons with fibers positive for GLAST, mice were injected with bromodeoxyuridine (BrdU; 10 μg/kg, ip; Sigma) at PND2 and brain tissue collected at PND7. Rehydrated cryosections (20 μm, 8/animal, n=6) were treated with 1% sodium borohydride, Image iT-Fx signal enhancer (Molecular Probes, Eugene, OR), and non-specific protein binding quenched (M.O.M. peroxidase immunodetection kit; Vector Labs). Sections were incubated overnight at 4°C with 1:10,000 mouse anti-BrdU (Chemicon, Intl.) and detected with anti-mouse IgG-Alexafluor-594 conjugate (Molecular Probes). Sections were then incubated with anti-GLAST and cover-slipped with ProLong-antifade containing DAPI (Invitrogen). At PND21, microglia were identified on the basis of morphological criteria of size and ramification of cells stained by binding of isolectin B4 (IB4) from Griffonia simplicifolia (Sigma, St. Louis, MO) as previously reported (26, 27) including pre-incubation for 30 min in 1X Automation Buffer (Biomedia Corp, Foster City, CA) containing 0.1 M CaCl2, MgCl2, MnCl2, and 0.1% Triton X-100 and visualized by DAB. Five randomly selected sections through the cerebellum of each mouse (n=5) were examined for microglia morphology within the cerebellar cortex. Staining for cresyl violet, hematoxylin, and luxol fast blue was conducted to examine general cerebellar architecture, neurons, and myelin.
Golgi-Cox Staining
To examine dendritic arborization of Purkinje neurons, serial sagittal cryosections (50 μm) through the entire PND21 brain were stained with FD Rapid GolgiStain kit™ by FD NeuroTechnologies, Inc. (Ellicott City, MD). Six randomly selected cerebellar sections from each brain were matched for plane of cut and evaluated by 2 investigators blind to genetic background. Twenty randomly selected Golgi stained Purkinje neurons within lobules VII or IV–V anterior to the primary fissure were visualized for morphological features, arborization and measured for soma size and length to first branching. Golgi stained neurons, that were not Purkinje neurons but showed a clear cell soma and projections, were measured for soma size and complexity of branching as defined by the number of branch points.
Microscopy
Light and fluorescence microscopy was performed with a Leica DMRBE microscope (Wetzlar, Germany) equipped with epifluorescence and motorized Z-control. Digital images were acquired using a SpotRT™ cooled, charged-couple device camera (Diagnostic Instruments, Sterling Heights, MI) by Metamorph™ software (Universal Imaging Co., Downingtown, PA). Digital fluorescent images were captured as black and white monochrome images and pseudocolored. GLAST fluorescent images were pre-processed using a background subtraction algorithm, no-neighbors deblurring, and exclusive thresholding. The amount of fluorescent pixels in the total area was determined by image segmentation and expressed as per mm2 and as % total area (AutoQuant Imaging, Inc., Watervliet, NY). Non-fluorescent images were collected using the Aperio Scanscope T2 Scanner (Aperio Technologies, Inc. Vista, CA), viewed using Aperio Imagescope v. 6.25.0.1117, and morphometric measurements of layer width and cell size were collected using Metamorph™ software.
Neurobehavioral assessments
At 4 months of age, male mice (n=10; one pup/litter) were ranked for general appearance, response to handling, righting reflex, hindlimb placement, and gait using a battery to assess reflex behaviors of mice (28, 29). Hindlimb clasping, a dyskinetic posture whereby mice clasp their limbs tightly into their abdomen when suspended, was assessed. Mice were scored 0) hind limbs fully splayed, 1) an intermediate posture, 2) completely clasped into the stomach. Assessments of gross motor coordination, strength, and position orientation were conducted. 1) Inverted Screen. Individual mice were placed on stiff mesh screen (8″×8″), inverted 180° and latency for the mouse to fall or climb to top of screen was recorded (1-min-cutoff). 2) Negative Geotaxis. An elevated 18″×18″ screen inclined at a 45° angle was used for negative geotaxis (30). Mice were placed head-up on the screen, turned 180° and latencies to movement, orientation to a head-up position, or fall were recorded over 1 min. 3) RotoRod. Individual mice were placed on a rotating rod apparatus (ENV-576M; Med Associates Inc., Georgia, VT) and rotation (incremental from 4–40 rpms) initiated. Latency to fall from the rod was recorded for 2 consecutive daily 1-min sessions.
Locomotor and Exploratory Activity
Locomotor activity was recorded in 5-min-epochs over 30 min (Opto-Max Activity photocell device, Columbus Instruments, Columbus, OH). For exploratory activity and response to novel environment, mice were placed in the large start chamber (Gemini II shuttle boxes; San Diego Instruments, San Diego, CA) under ambient light for a 60 sec acclimation period. Illumination was increased and the door between the two chambers opened. The location of the mouse within the start chamber and the latency to cross into the smaller dark chamber were recorded over two consecutive daily sessions.
Running Wheel
As measures of long-term motor function, cerebellar learning, and diurnal cycle, individual adult mice were placed in home cages with free access to a running-wheel (Mini-Mitter®; Respironics Co., Bend, OR). Wheel rotations were recorded in 1-h epochs continuously over 9-days. Food and water were available ad libitum.
Startle Response/Prepulse Startle Inhibition (PPI)
Startle reactivity to auditory stimuli (40 msec duration and a broad sound frequency spectrum) was recorded using a SR-LAB, (San Diego Instruments, San Diego, CA) apparatus. PPI of the auditory startle response was measured to assess sensorimotor gating (31), as the ability of the nervous system to inhibit a motor response to sensory input (32). Movements initiated by programmed auditory stimuli (40 msec duration) were transduced into startle amplitude. A 20 min session began with a 5 min acclimation period followed by three consecutive blocks of test trials. The first and last blocks consisted of six pulse-alone trials. The middle block contained 52 pulse alone, prepulse+pulse, and no-stimulus trials in a pseudo-randomized order. A no stimulus (background white noise only) interval was incorporated to measure basal movement of the animal. Test trials were separated randomly by variable 15 msec inter-trial intervals and auditory pulses were presented randomly. Each trial started with a 50 msec null period and ended with a 200 msec recording period. Prepulse stimuli were 20 msec long and presented 100 msec before the 120 dB startle.
Social Behavior
A rectangular, 3-chambered open-access plexiglass box was used to assess social behavior as described previously (33). After a 5 min exploration period, the amount of time spent in each chamber, the time spent sniffing the ‘stranger”, and the number of “sniffing bouts” (>5 sec) were recorded.
Statistical analysis
Two group analyses were conducted using Student’s t-tests. Categorical data was analyzed by Chi Square. Behavioral data was analyzed by one-way ANOVA or Mann-Whitney-U test for non-parametric data. Prepulse startle response, locomotor activity, and running wheel activity were analyzed by repeated measures ANOVA. Statistical significance was set at p< 0.05. Wheel activity data was modeled using a sigmoidally transformed cosine curve (34) and the amplitude (maximum amount of activity) determined.
Results
TAK1−/− phenotype
To obtain further insights into the nervous system functions of TAK1, we generated TAK1 null mice on a C57BL/6 background. Heterozygous pairs were used to generate TAK1−/− mice. Approximately 50% of the TAK1−/− embryos were resorbed during development, while full necropsy of surviving TAK1−/− mice did not identify any gross morphological or histological differences compared to WT. No pup loss occurred during the lactational period. As any developmental process can be influenced by the interactions between the dam and pups, we examined aspects of maternal/pup behavior. TAK1+/− and WT dams were similar in nest building, pup retrieval, and nursing. In TAK1−/− offspring, Chi Square analysis showed no alterations in response to handling, righting reflex, hindlimb placement, and gait. There was no evidence of tremor, either constitutive or induced by handling, as has been reported for TR4−/− mice on a C57BL/6 × 129SvEv hybrid background (25, 35). TAK1−/− showed lower body weights at weaning that were significant by 4 months-of-age, (WT = 25–35g (n=11); TAK1−/− = 22–29 grams (n=10); p<0.05) and brain weight (PND 21 = 10% ±2%; 4 months = 20% ±5% decrease; p<0.05). Consistent with reports on TR4−/− mice, the cerebellum was smaller in size and an absence of the intercrural fissure that normally separates folia VI and VII of the cerebellum was seen in TAK1−/− mice (Figure 1A). This was confirmed across multiple planes of cut of the cerebellum in all mice at all ages examined (n=20).
Figure 1.

(A) Representative images of the wet brain of WT and TAK1−/− mice. A. Representative image of the extracted brain and Luxol fast blue (LFB) staining of the cerebellum in PND21 mice demonstrating the decreased overall size of the cerebellum and the loss of distinct lobules (bracket for lobules VI–VII). (B–C) Representative images at PND7 of hematoxylin stained 20 μm thick cryosections demonstrate a smaller molecular layer (ML) (190 μm for WT vs 100 μm for TAK1−/−) and a smaller (180 μm for WT vs 110 μm for TAK1−/−), more compact internal granular layer (IGL), and no gross differences in the width or compaction of the external granular layer (EGL) in the TAK−/− mice. Scale bar = 50μm.
PND7 Cerebellum
Examination of the TAK1−/− cerebellum at PND7 (n=6), showed a thinner (40% decrease, p<0.05) and less well-defined ML throughout the cerebellum, as compared to WT (Figure 1B–C). The width of the EGL was not significantly different between the two groups of mice, whereas the IGL was significantly (p<0.05) decreased by 35% in the TAK1−/− mice (Figure 1C). In postnatal development of the cerebellum, the active migration occurring at PND7 is reflected in a diffuse staining pattern for both calbindin 28K (36, 37) and GLAST (18). By PND7, Purkinje cells begin to establish a monolayer alignment (18). This transition was evident in WT and TAK1−/− mice, with TAK1−/− Purkinje cells showing less of a monolayer alignment than what is normally seen in the adult. The monolayer was easily distinguished in the WT but was less distinctive in the TAK1−/− mice (Figure 2A–B). Previous reports on the TR4−/− mice demonstrated a severe shunting of the Purkinje cells at PND7 that was transient and dissipated by PND14 (38). When morphological features of calbindin 28K-positive (28K+) Purkinje cells were examined at PND7, we did not observe severe shunting, however, the dendritic projections did not demonstrate a distinct linear organization, but rather showed a dysmorphic pattern in TAK1−/− mice (Figure 2B–C). Analysis of z-stack images through thick sections indicated shorter processes (15% ±3%; p<0.05), as compared to WT.
Figure 2.

Representation immunohistochemical staining for calbindin 28K+ (brown-DAB) (arrows) counterstained with hematoxylin (blue) in PND7 cerebellum. Cryostat sagittal sections (20 μm) were collected through the entire cerebellar structure. This allowed for a set of sections consistent with orientation and plane of cut for sampling. Sections containing lobules VI–VII were identified and 6 sections for each brain were randomly selected for immunostaining. (A) Low magnification image of calbindin 28K+ immunostaining of cells within the cerebellum showing staining in the Purkinje neurons (long arrows) and within the IGL consistent with previous reports of expression during early postnatal development (36). (B) Higher magnification images of calbindin 28K demonstrate the monolayer organization of Purkinje neurons (brown; bracket) in the WT mice and the slight disarray of linear organization (short arrows) within TAK−/− mice. C. Representative high magnification image of individual Purkinje neurons immunopositive for calbindin 28K (magnification of inset box in A). Scale bars = 50 μm.
Deficit in GLAST immunostaining in TAK1−/− mice
In normal cerebellar development, the granule cells utilize Bergmann fibers of the Golgi epithelial cells for migration through the ML and past the developing Purkinje cells. During this process, the folia of the cerebellum are established. During normal postnatal development, the rod-like domain of Bergmann fibers is immunopositive for GLAST. Cells that had incorporated BrdU on PND2 were found in contact with GLAST+ fibers in both the TAK1−/− and WT mice (Figure 3). In WT mice, the rod-like domain of Bergmann fibers positive for GLAST showed a distinct linear organization (Figure 3); however, in the TAK1−/− mice, immunostaining for GLAST (Figure 4A–B) and normal linear organization were diminished (Figure 3). Quantitation of the fluorescent signal for protein indicated significantly less GLAST in the TAK1-null cerebellum (Figure 4C). This deficit was observed in both the rod-like domains of Bergmann fibers as well as processes within the granule cell layer. This pattern suggests that the deficit in GLAST expression, whether representing a structural or signaling component, contributes to the altered migration of granule neurons and the developmental delay seen in the TAK1−/− mice. When we compared the level of fluorescent signal in the cerebellum to levels observed in the hippocampus (WT= 8.3 ±2; TAK1−/− = 7.6 ±1.9) or cortex (WT = 6.4 ±2.3; TAK1−/− = 5.9 ±2.1), which also rely on GLAST fibers and signaling for neuronal migration, no significant difference was noted in the TAK1−/− mice.
Figure 3.
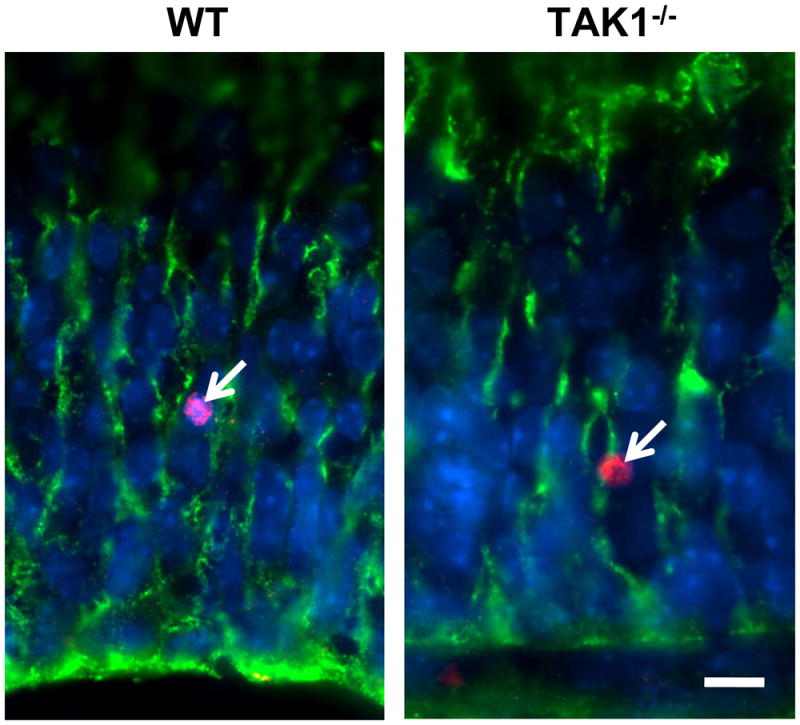
Immunohistochemical staining for GLAST+ glia in the cerebellum lobule VI and location of BrdU+ cells. Representative immunofluorescent staining for BrdU+ cells (red) within the cerebellum along GLAST+ radial fibers (green) in WT and TAK−/− mice at PND7. Mice were injected with BrdU (10 μg/kg, ip) at PND2 and examined at PND7 as described in the Methods section. Scale bar = 10 μm.
Figure 4.

Immunostaining for GLAST in the cerebellum detected with (A) DAB (brown) or (B) immunofluorescence (red). Cryostat sagittal sections (20 μm) were collected through the entire cerebellar structure. This allowed for a set of sections consistent with orientation and plane of cut for sampling. Sections containing lobules VI–VII were identified and 6 sections for each brain were randomly selected for immunostaining. Immunoreactivity was detected in the rod-like domain of Bergmann fibers and within the fibers throughout the IGL consistent with the normal staining pattern at PND7 (18). (B–C) In samples matched for plane of cut and orientation integrated intensity of GLAST staining (mean ± SD; n=3) was determined. Z-stack fluorescent images were collected of multiple sections from 3 animals per group and processed under identical conditions, maximum projection images prepared, and inclusive thresholding set. Integrated intensity values, defined as the sum of all intensity values for all pixels in a region of interest (ROI), were collected from the thresholded images (mean ± SD). (C) Consistent with the visual representation, integrated intensity values for GLAST demonstrated an approximate 50% decrease (p<0.05) in immunostaining in the TAK−/− mice at PND7. Scale bar = 25 μm.
Golgi staining
Given the altered architecture of the Purkinje cell processes observed at an early age of PND7, we examined Golgi stained Purkinje cells in the cerebellum at a slightly older age (PND21), after the normal migration of cerebellar granule cells. Examination of 6 sections per mouse, matched to plane of cut, showed no gross difference as a function of genotype in the morphology of Golgi-positive (Golgi+) cells within the cerebellar VI–VII lobules (Figure 5). The general arborization and orientation of the neuronal dendritic field were not grossly altered in the TAK1−/− mice. Soma size and branch point were determined from z-stack images of 10 Purkinje cells per lobule per section. Golgi+ Purkinje cells showed, on average, an 18% (±4%) decrease in soma size. From sampling across multiple cells, littermates showed no gross differences in the Purkinje cell dendritic field. The length of the apical dendrite to first branch point was decreased by 35% ±5% in the TAK1−/− mice. This is not unexpected given the smaller overall size of the cerebellum as some adjustment would be required. However, alterations in synaptic connectivity cannot be ruled-out simply due to the proportional size of the cerebellum. A similar pattern was observed within the IV–V lobules where the soma size was decreased by 15% ±2%. In addition to the Purkinje neurons, large Golgi+ cells within the cerebellum were 30% ±5% smaller in the TAK1−/− mice (Figure 5C) and the soma of smaller branched Golgi+ cells were decreased (15% ±5%) and found to display longer and less complex branches as compared to WT (Figure 5D; branch points WT = 5 ±1; TAK1−/− = 2 ±1).
Figure 5.

Representative Golgi-Cox staining (FD Rapid GolgiStain) in the cerebellum of PND21 WT and TAK1−/− mice. Serial sections of the entire cerebellum were stained, imaged and matched for plane of cut. (A) Low magnification image of the cerebellum in WT and TAK1−/− mice. Scale bar = 250 μm (B–D) Six randomly selected cerebellar sections from each brain were matched for plane of cut and evaluated by 2 investigators blind to the genetic background. (B) Twenty randomly selected Golgi stained Purkinje neurons within lobules VII or IV–V anterior to the primary fissure were visualized for morphological features, overall arborization and measured for soma size and length to first branching. In TAK1−/− mice, Golgi+ Purkinje neurons showed a 20% decrease in soma size and 20 ±5% decrease in apical dendrite to first branch point; however total arborization of individual cells did not appear to be grossly altered. (C–D) Golgi stained neurons that were not Purkinje neurons, were selected in a similar manner. (C) Representative type of Golgi stained cell. (D) Representative morphology of Golgi cell measured for soma size and complexity of branching (number of branch points on an individual cell). Soma size was not significantly altered; however, branching was significantly decreased (p<0.05) by approximately 40%. Scale bar = 25 μm.
Microglia Morphology
As the primary immune cell of the brain, microglia respond to cell death signals for phagocytosis of debris. They contribute to the formation of brain structures during the developmental process of pruning. Given previous reports suggesting an increase in cerebellar granule cell death in TR4−/− mice (25), we examined the microglia response within the cerebellum at PND21 as an indicator of focal cell death. IB4-stained microglia displayed thin, ramified processes in the WT cerebellum (Figure 6). In the PND21 TAK1−/− mouse an increase was observed in ramified process bearing microglia and in clusters of microglia (long arrow; Figure 6). The increase in amoeboid microglia (short arrow; Figure 6) was suggestive of activation and phagocytic activity possibly as an indicator of cellular death within the cerebellum.
Figure 6.

Representative images of Griffonia simplicifolia isolectin B4 staining for microglia in the cerebellum of PND21 WT and TAK1−/− mice. Minimal staining of microglia with thin ramified processes was seen in the WT mice. TAK1−/− mice showed an increased staining of IB4+ (brown – DAB) microglia characterized by ramified microglia with shortened, thick processes (long arrow) and a limited number of amoeboid microglia (short arrow). Hematoxylin counterstain (blue) shows IGL location. Scale bar = 50 μm.
Luxol Fast Blue staining for myelin
Previous work suggested that the developmental process of myelination is altered within the brains of TR4−/− mice (39). As myelination continues well into the adolescent life of the animal, adult mice were examined for any changes in Luxol fast blue staining of the myelin sheaths within the cerebellum and internal capsule. For each myelinated area, sections were matched for plane of cut by anatomical landmarks and multiple sections were examined to ensure appropriate comparison of staining across sections and animals. The staining pattern indicated significant smaller myelinated tracts within the cerebellum of TAK1−/− mice (Figure 7A). The cortico-pontine-cerebellar tracts represent cortical axons that leave the cortex, descending in the internal capsule along with pyramidal tract fibers. These axons synapse with cells in the pons that send projections to the cerebellum. Luxol fast blue staining indicated a smaller yet more compact internal capsule (Figure 7B).
Figure 7.
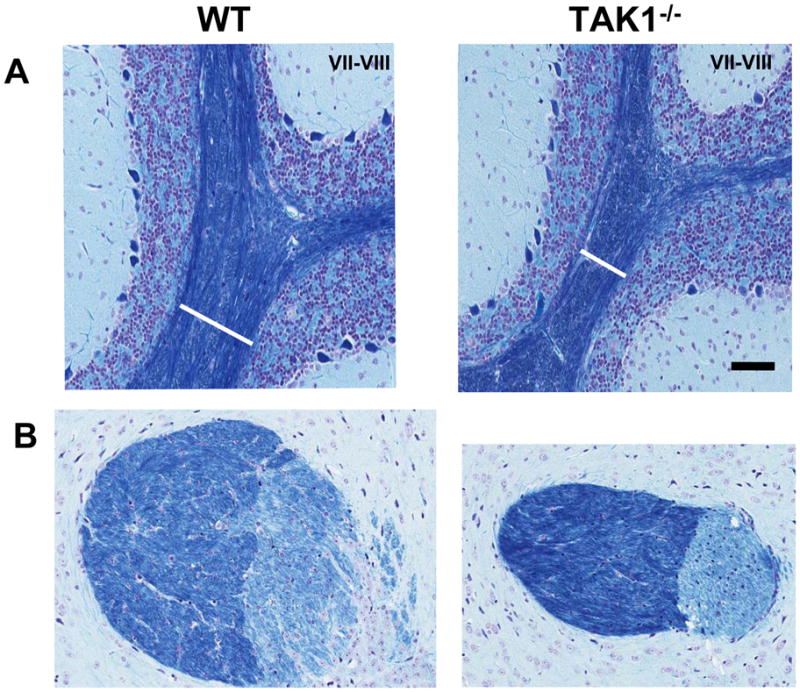
Representative images of Luxol-fast blue staining in adult mice. Cryostat sagittal sections (20 μm) were collected through the entire cerebellar structure. This allowed for a set of sections consistent with orientation and plane of cut for sampling. Sections containing lobules VI–VII were identified and 6 sections for each brain were randomly selected for immunostaining. (A) In samples matched for plane of cut and orientation the width of the myelin tracts (white bar = region of interest identified as between lobules VII and VIII) were significantly (p<0.05) smaller in the TAK1−/− mice as compared to WT. (B) Luxol-fast blue staining indicated a smaller and more compact internal capsule in the TAK1−/− mice as compared to WT. Scale bar = 50 μm.
Behavioral Assessments
Motor Coordination
Gross alterations in gait were not detected in the adult TAK1−/− mice. Earlier reports on TR4−/− mice suggested a deficit in narrow ledge-balancing and wire-hanging (35). Consistent with the type of hindlimb requirements for these tasks, a difference was seen in hindlimb clasping. In WT mice, the hindlimbs orient straight down or slightly extended (median score of 0.5) while the hindlimbs are pulled toward the body in the TAK1−/− mice (median score of 2 as defined in Methods section). Performance on motor tasks, such as the inverted screen and negative geotaxis would not be influenced by “hindlimb clasping” and were not altered in the TAK1−/− mice. The average latency for the inverted screen was 13 ±4 sec for WT and 15 ±4 sec for TAK1−/−. For negative geotaxis: latencies to first movement (WT = 17 ±5; TAK1−/− =14 ±4), orientation of head upward (WT=22 ±3; TAK1−/− =21 ±4), or fall from screen (WT=30± 3;TAK1−/− =28 ±4) were not altered.
Roto-rod performance is a reliable, simple test for gross motor coordination and balance and has often been found to be deficient with gross damage to the cerebellum. Consistent with the minimal structural compromise in cerebellar architecture, we did not find a deficit in roto-rod performance in the TAK1−/− mice. Using a progressive rpm increase protocol, WT mice displayed a median latency to fall of 30 sec (range 10–57) occurring at a median latency of 8 rpms (range 5–12). The response in TAK1−/− mice showed higher variability with a median latency of 75 sec (range 42–110) and median rpm of 14 (range 10–19). Both of which were significantly higher than WT (p<0.05). On the second test, WT mice showed a significant improvement with a median latency to fall of 85 sec (range 65–105) and TAK1−/− mice showed a median latency to fall of 95 sec (range 75–120).
Locomotor and exploratory activity
The total level of locomotor activity was not altered in the TAK1−/− mice (Figure 8A). A normal pattern of activity habituation over the test session was similar between TAK1−/− and WT mice (Fig. 8A) in that activity levels decreased over the 30-min test session. In the WT mouse, the percent time spent in the margin or perimeter of the chamber increased over the session while the TAK1−/− mice displayed similar margin time across the entire session (Figure 8B).
Figure 8.

Motor activity and light/dark preference. (A) Total ambulatory activity in adult WT and TAK1−/− (KO) mice (4 months of age) over 30 min. (B) Total time (sec) spent in the periphery of the activity chamber (margin time) in 5 min epochs over 30 min. (C) Light-dark preference. Latency (sec) of adult mice to enter the dark chamber from a larger brightly illuminated chamber over 2 trials. Data are represented as mean ± SD. * indicates significantly different from WT mice (p< 0.05).
The light/dark test is based on spontaneous exploratory behavior of rodents and their innate aversion to brightly illuminated areas. An increased latency to enter the preferred dark chamber can be due to increased exploratory activity or elevated anxiety represented by freezing behavior in the illuminated chamber. WT mice displayed a normal preference for the dark chamber with an average entry latency of 12 sec (Figure 8C). A significantly increased latency to enter the dark chamber (26 sec) was observed in TAK1−/− mice (Figure 8C). Observations determined that the increased latency was due to freezing behavior within the light chamber. TAK1−/− mice adapted to the environment and, upon the second trial, freezing behavior was no longer evident and latency to enter the dark chamber was similar to WT (Figure 8C).
Running wheel
Upon placement into the new environment, (Day 1; 11:00–17:00), TAK1−/− mice showed significantly less activity during the initial 6 h (p< 0.05; Figure 11A) as compared to WT. In both WT and TAK1−/− mice, a normal diurnal cycle was observed with increased activity during the dark-cycle (18:00-6:00) and minimal activity during the light-cycle (6:00–18:00) (Figure 9A). The normal pattern of increased wheel-running over the course of 9 days is associated with the ability of the animal to learn the appropriate motor coordination and speed to adjust its movements to control/balance the wheel allowing for a full forward motion (40). In WT mice, activity level during the dark cycle continued to increase over the 9-day test period (Figure 9A). In TAK1−/− mice, activity during the dark cycle was similar to WT mice for the first 4 days; however, peak activity level was reached by day 4 and this level of activity continued until day 9 (Figure 9A). The plateau in level of performance on the running wheel by the TAK1−/− mice could reflect a physical maximum activity level; however, analysis of the data suggested that the maximum number of rotations within any 1-h epoch of time could be similar between groups. Additional analysis of the running-wheel-activity (Figure 9B) showed that the amplitude of activity was significantly reduced in TAK1−/− mice. The time of day for maximum activity (tmax); at which increasing activity reached half the amplitude (t1/2 up) was not altered; however, the time for decreasing activity (t1/2 down) was significantly increased in the TAK1−/−. The number of hours per day during which the mice had higher activity levels was increased in TAK1−/− mice with a corresponding decrease in time spent at lower activity levels.
Figure 11.

Social behavior of TAK−/− (KO) and WT mice. (A) Contact - The total time (sec) out of a total of 300 sec that the mouse spent in contact with an unfamiliar mouse. Bouts – the number of distinct contacts the test mouse had with the unfamiliar mouse. *indicates significant difference as compared to WT mice (p<0.05). (B) Total time (sec) out of 300 sec that the mouse spent in each of the 3 compartments of the test apparatus. Compartments: M – containing an unfamiliar mouse in wire container; C– center chamber; E – chamber containing an empty wire container. Data are represented as mean ± SD. * indicates significant difference as compared to the center compartment within each background strain (p< 0.05).
Figure 9.

Home cage running wheel activity. (A) Mean total activity in the home cage running wheel during the dark and light periods over 9 days. (B) Further analysis of components of the running wheel activity as described in the Methods section. The amplitude of activity, Tmax – the hour at which the animal reached maximum activity level; T1/2 up – the hour of the day for initiating running; T1/2 down – the hour of the day for decreasing activity; the hours within a day for high activity and the concurrent hours for low activity. TAK−/− (KO; n=10) and WT mice (n=10). Data represents mean ± SEM. * indicates significantly different from WT mice (p< 0.05).
Startle Response, PPI, and Social Behavior
Given the lack of gross changes in motor behavior, we considered other behaviors reflective of cerebellar contributions to higher order functions. Alterations in lobules VI and VII have been reported in human neurodevelopmental disorders, such as autism (41) and a decreased size of the cerebellum occurs in subjects with schizophrenia in which deficits in auditory pre-pulse inhibition (42, 43) and low levels of social approach (44) are characteristic. Thus, we examined these endpoints using paradigms designed for mice (45).
Acoustic startle is recorded as a motor reflex response to an intense, loud noise stimulus. The initial startle response amplitude to a 120 dB tone was significantly lower in the TAK1−/− mice as compared to the response elicited from WT mice (Figure 10A). Habituation to the 120 dB stimulus was calculated as the change in response amplitude from the initial block of 6 stimuli to the last block of 6 stimuli. WT mice exhibited a significant habituation (P<0.05), while habituation in the TAK1−/− mice was significantly less (Figure 10B). The acoustic startle response is reduced when a pre-pulse stimulus is presented before the main startle stimulus. This PPI of the auditory startle response was measured to assess sensorimotor gating and the ability of the nervous system to inhibit a motor response to sensory input (32, 46). While the startle response amplitude was lower in TAK1−/− mice, PPI was detected and was significantly less as compared to WT (Figure 10C). A decreased startle response can modify the interpretation of a deficit in PPI; however, in the mouse, sensorimotor gating processes are not generally linked to the startle reactivity given that the level of PPI is independent of the magnitude of the startle response (47). Activity levels during the test session are measured as “no-stimulus responses” and were similar between groups (Figure 10D). No correlation between startle response amplitude and body weight was found indicating that the lower startle response in TAK1−/− mice was not due to the lower body weight. T-max was similar between both groups of mice suggesting no difference in latency to respond to the stimulus (data not shown). No significant difference in startle response to a stimulus intensity of 90 dB was observed suggesting that the deficit in startle was not directly due to a hearing deficit; however, further evaluation would be required for assessment of auditory acuity.
Figure 10.

Startle response and pre-pulse startle inhibition. (A) Startle response amplitude to a 120dB tone measured in adult TAK1−/− (KO) and WT mice. Data represents the mean startle response amplitude as measured within the first block of 6 trials ± SD (n=10). (B) Habituation to the auditory stimuli calculated as a percent change between the initial startle response indicated in (A) and the mean startle response over the last block of six 120 dB trials. (C) Prepulse startle inhibition (PPI) across 3 prepulse stimulus intensities. (D) Basal movement of mice during the no stimulus trials. Data represent the mean ± SD (n=10) * indicates significantly different from WT mice (p≤ 0.05).
Social interaction tests assess the identification and preference of contact with an interactive presence. Social contact assessment showed that WT mice displayed a normal preference for the compartment containing the unfamiliar mouse and emitted contact bouts with the unfamiliar mouse (Figure 11A–B). In comparison, TAK1−/− mice displayed no preference for the compartment containing the unfamiliar mouse. This was evident in the relatively uniform time spent in each chamber (Figure 11B) resulting in significantly lower total amount of time spent in contact with an unfamiliar mouse as well as significantly less number of contact bouts for the TAK1−/− mice as compared to WT (Figure 11A).
Social interaction tests assess the identification and preference of contact with an interactive presence. Social contact assessment showed that WT mice displayed a normal preference for the compartment containing the unfamiliar mouse and emitted contact bouts with the unfamiliar mouse (Figure 11A–B). In comparison, TAK1−/− mice displayed no preference for the compartment containing the unfamiliar mouse. This was evident in the relatively uniform time spent in each chamber (Figure 11B) resulting in significantly lower total amount of time spent in contact with an unfamiliar mouse as well as significantly less number of contact bouts for the TAK1−/− mice as compared to WT (Figure 11A).
Discussion
TAK1−/− (TR4−/−) mice exhibit a decreased size of the cerebellum and a diminished foliation of lobules VI–VII (11, 25, 35, 38). In the rodent brain, TAK1 is highly expressed in the cerebellar granule cells (2, 10) and it has been proposed that the decrease in size is related to a loss of cerebellar granule neurons and a developmental delay in neuronal migration (38). We found similar differences in the cerebellum of TAK1−/− mice with regards to size, foliation, and an apparent delay in granule cell migration. We now provide evidence that the overall difference in the development of the cerebellum is related to interactions between Bergmann fibers expressing GLAST and the migrating granule neurons that normally express TAK1. We also demonstrate that this alteration in the cerebellum is not sufficient to significantly affect gross motor coordination or strength. Neurobehavioral alterations observed in TAK1−/− mice suggest that the absence of TAK1 significantly affects the network pathways from the cerebellum to cortical and association areas that provide adaptive control for motor learning, sensory discrimination, and some complex cognitive tasks (48, 49).
Granule cell survival is compromised and migration does not occur when Bergmann fibers are disordered and atrophic; however, this abnormality may be secondary to a defect in granule cells (15, 16). For example, neuronal migration is slowed in mice lacking the gliotrophic factor, astrotactin (50, 51), in cerebellar granule neurons. Moreover, the slightly narrower ML containing migrating granule cells with a rounded morphology (52), is reminiscent of the pattern displayed in the TAK1−/− mice during post-natal development (11). It is possible that, similar to astrotactin, the absence of TAK1 expression in migrating cerebellar granule cells causes a loss of appropriate signaling interactions with Bergmann fibers resulting in structural abnormalities and defects in migration. Interestingly, in Zic1 heterozygous mice, the patterning of the cerebellum and the diminished foliation of the VI–VII lobule are similar to that seen in the TAK1−/− mice. Zic genes have zinc-finger domains similar to Gli proteins that act as transcriptional regulators in hedgehog signaling and may regulate the activation of Notch signals. DNER is a novel Notch ligand and can stimulate Deltex-dependent Notch signaling for maturation of Bergmann glia in the cerebellum (22). DNER knockout mice show an absence of the intercrural fissure in the VI–VII lobule and a narrower ML during development (23). These models demonstrate the importance of the Bergmann fibers in cerebellar development and suggest that the slight disorganization of the Bergmann fibers observed in the cerebellum of TAK1−/− mice is a significant contributing factor to the deficits observed.
Earlier work on the TR4−/− mouse, reported a developmental delay with a severe but transient shunting of Purkinje cells at PND7 (1, 25). When we examined TAK1−/− mice at this age, we did not observe shunting; however, we did observe a shortened and a slightly dysmorphic pattern of process extensions of Purkinje neurons and a delay in forming a normal monolayer arrangement. The cells still appeared to project across the ML, presumably to target neurons. The tips of growing Purkinje cell dendrites align parallel and attach to the rod-like domain of Bergmann fibers (18). Thus, altered contact or signaling from Bergmann fibers expressing GLAST can contribute to the morphological disarrangement of the Purkinje cells observed in the TAK1−/− mice at PND7. By PND21, Golgi stained Purkinje cells in TAK1−/− mice displayed a smaller soma but no evidence of being dysmorphic; however, further examination showed a decrease fielding the length of the first branch point of the apical dendrite. While such a finding would normally suggest a developmental disruption, clear interpretation of these findings is confounded by the proportional decrease in size of the entire cerebellum and the possibility that these deficits are simply the result of the physically smaller area.
During development, not only do Bergmann fibers provide structural support for neuronal migration but, by way of their affinity for developing Purkinje cells, they can also regulate synapse formation and activity (18). As a glutamate transporter, GLAST (53) is involved in Purkinje cell synapse development, motor coordination, and protection against excito-toxicity (54). Diminished labeling of GABA neurons (35) and decreased inhibitory signaling in the cerebellum (11) may be related to diminished protection from glutamate signaling with decreased GLAST expression in TAK1−/− mice. Inhibitory signaling within the cerebellum also occurs through the large spontaneously active Golgi cell interneurons that modulate the activity of the mossy fiber to granule cell excitatory synapses and influence signals via the Purkinje cell (55, 56). Thus, the absence of complexity of branching of Golgi interneurons could contribute to the decreased inhibitory signaling in the cerebellum previously reported (11). In addition, an altered balance in excitatory and inhibitory signaling would contribute to an alteration in the functional network projections to the forebrain.
The specificity of deficits in the foliation of the VI–VII lobule remains a question. The formation of cerebellar folia is derived from expansive proliferation of granule cells in the external granule layer (EGL) and through interactive communication with Purkinje cells (57). Previous studies suggested that the absence of foliation of lobules VI–VII was due to decreased proliferation and increased death of cerebellar granule cells (11, 25, 35, 38). Lobules VI–VII are phylogenetically the most recently derived part of the cerebellum (58) with a role in emotion, language, working memory, and executive functions (59). Alterations in lobules VI–VII have been reported in human neurodevelopmental disorders with characteristic deficits in auditory pre-pulse inhibition (42, 43) and social approach (44). TAK1−/− mice exhibited significant deficits in these specific endpoints. The response to auditory stimuli was decreased, which could represent a deficit in the motor response or a reduced behavioral reactivity to environmental stimuli. In addition, a deficit was observed in the integration of signals for auditory pre-pulse inhibition suggestive of impairment in information processing (60). When we examined social interactive behavior of the TAK1−/− mice, a pattern of diminished interactions was observed characterized by an absence of the normal preference for contact with an unfamiliar mouse. Whether these behaviors are due to changes in the cerebellum or dependent upon network interactions between the cerebellum and cortical structures will require further experimentation. However, an alteration in communication between the two structures is possible given the smaller myelin tracts within the cerebellum and internal capsule. The smaller cerebellum prompted investigation of behaviors related to cerebellar function, such as motor coordination. In a battery of tests to screen for gross changes in motor strength, coordination, and activity, adult TAK1−/− mice were similar to WT mice, consistent with the minimal changes in the architecture of the cerebellum. We did, however, identify a hindlimb clasping response in TAK1−/− mice that could account for deficits in narrow ledge-balancing and wire-hanging reported for TR4−/− mice (35). While motor coordination is linked to cerebellar functioning, this structure also provides adaptive control for motor learning, balance, sensory discrimination, and some complex cognitive tasks (48, 49, 61, 62). Thus, given the lack of gross motor deficits, we examined other behavioral tasks that incorporate a motor component. Our data suggest that morphological alterations occurring during the development and maturation of the cerebellum result in altered neural circuitry not only within but also originating from the cerebellum. TAK1−/− mice display alterations in more complex behaviors, such as deficits in exploration in a novel environment, cerebellar motor learning, and auditory sensory gating. By examining different components of the running-wheel behavior, we were able to detect differences in the TAK1−/− mice. In the absence of changes in gross motor performance, we speculate that the plateau observed in the running-wheel represents a deficit in motor coordination to control/balance the wheel for an extended period of time. The initial decreased activity with the introduction of a running wheel to the home-cage suggested a diminished level of exploratory behavior in a novel environment consistent with both locomotor activity and passive avoidance performance. In addition, the increase in time spent in high levels of activity and the delay in termination of the activity raise the possibility of an activity-dependent repetitive behavior in TAK1−/− mice.
One could present arguments for, as well as, against the specificity of the behavioral changes to the structural alterations in the cerebellum. While the cerebellum is involved in multiple aspects of behavior, cell-cell interactions during development related to GLAST expression and neuronal migration also occur in other brain regions specifically, the cortex and hippocampus. Thus, while the dramatic decrease in GLAST immunoreactivity in the cerebellum was not observed in these structures at the age examined, TAK1 is also expressed in neurons of these regions and developmental alterations may contribute to the neurobehavioral effects observed in the current study. Overall, these observations support the concept that TAK1 has a pivotal role in brain development and suggest that the developmental alterations in the cerebellum of the TAK1−/− mice provide an excellent model to enhance our understanding of developmental neuronal-glial interactions and its impact on neurobehavioral functions.
Acknowledgments
The authors thank Dr. Randy Thresher, UNC/Chapel Hill, NC for generating TAK1−/− mice; Ms. Laura M. Degraff for technical assistance; Dr. Fu Du for the Golgi staining, and Drs. Gordon Flake (NIEHS) and Robert Berman (University of California/Davis) for comments. This research was supported by the Division of Intramural Research at the National Institute of Environmental Health Sciences, NIH (Z01-ES-101586; Z01-ES-021164).
Abbreviations
- BrdU
bromodeoxyuridine
- CAPS2
Ca2+-dependent activator protein for secretion 2
- DAB
3,3′-diaminobenzidine
- DNER
delta/notch-like epidermal growth factor repeat
- EGL
external granular layer
- GLAST
L-glutamate/L-aspartate transporter
- IGL
internal granular layer
- MZ
marginal zone
- ML
molecular layer
- NMDA
N-methyl-D-aspartic acid
- PND
postnatal day
References
- 1.Chang C, Da Silva SL, Ideta R, Lee Y, Yeh S, Burbach JP. Human and rat TR4 orphan receptors specify a subclass of the steroid receptor superfamily. Proc Natl Acad Sci U S A. 1994;91:6040–4. doi: 10.1073/pnas.91.13.6040. [DOI] [PMC free article] [PubMed] [Google Scholar]
- 2.Hirose T, Fujimoto W, Tamaai T, Kim KH, Matsuura H, Jetten AM. TAK1: molecular cloning and characterization of a new member of the nuclear receptor superfamily. Mol Endocrinol. 1994;8:1667–80. doi: 10.1210/mend.8.12.7708055. [DOI] [PubMed] [Google Scholar]
- 3.Yoshikawa T, DuPont BR, Leach RJ, Detera-Wadleigh SD. New variants of the human and rat nuclear hormone receptor, TR4: expression and chromosomal localization of the human gene. Genomics. 1996;35:361–6. doi: 10.1006/geno.1996.0368. [DOI] [PubMed] [Google Scholar]
- 4.Hirose T, O’Brien DA, Jetten AM. Cloning of the gene encoding the murine orphan receptor TAK1 and cell-type-specific expression in testis. Gene. 1995;163:239–42. doi: 10.1016/0378-1119(95)00414-2. [DOI] [PubMed] [Google Scholar]
- 5.Lee YF, Pan HJ, Burbach JP, Morkin E, Chang C. Identification of direct repeat 4 as a positive regulatory element for the human TR4 orphan receptor. A modulator for the thyroid hormone target genes. J Biol Chem. 1997;272:12215–20. doi: 10.1074/jbc.272.18.12215. [DOI] [PubMed] [Google Scholar]
- 6.Yan ZH, Karam WG, Staudinger JL, Medvedev A, Ghanayem BI, Jetten AM. Regulation of peroxisome proliferator-activated receptor alpha-induced transactivation by the nuclear orphan receptor TAK1/TR4. J Biol Chem. 1998;273:10948–57. doi: 10.1074/jbc.273.18.10948. [DOI] [PubMed] [Google Scholar]
- 7.Hirose T, Apfel R, Pfahl M, Jetten AM. The orphan receptor TAK1 acts as a repressor of RAR-, RXR- and T3R-mediated signaling pathways. Biochem Biophys Res Commun. 1995;211:83–91. doi: 10.1006/bbrc.1995.1781. [DOI] [PubMed] [Google Scholar]
- 8.Yang Y, Wang X, Dong T, Kim E, Lin WJ, Chang C. Identification of a novel testicular orphan receptor-4 (TR4)-associated protein as repressor for the selective suppression of TR4-mediated transactivation. J Biol Chem. 2003;278:7709–17. doi: 10.1074/jbc.M207116200. [DOI] [PubMed] [Google Scholar]
- 9.Nakajima T, Fujino S, Nakanishi G, Kim YS, Jetten AM. TIP27: a novel repressor of the nuclear orphan receptor TAK1/TR4. Nucleic Acids Res. 2004;32:4194–204. doi: 10.1093/nar/gkh741. [DOI] [PMC free article] [PubMed] [Google Scholar]
- 10.van Schaick HS, Rosmalen JG, Lopes da Silva S, Chang C, Burbach JP. Expression of the orphan receptor TR4 during brain development of the rat. Brain Res Mol Brain Res. 2000;77:104–10. doi: 10.1016/s0169-328x(00)00046-2. [DOI] [PubMed] [Google Scholar]
- 11.Chen YT, Collins LL, Chang SS, Chang C. The roles of testicular orphan nuclear receptor 4 (TR4) in cerebellar development. Cerebellum. 2008;7:9–17. doi: 10.1007/s12311-008-0006-3. [DOI] [PubMed] [Google Scholar]
- 12.Hatten ME. New directions in neuronal migration. Science. 2002;297:1660–3. doi: 10.1126/science.1074572. [DOI] [PubMed] [Google Scholar]
- 13.Rakic P, Sidman RL. Weaver mutant mouse cerebellum: defective neuronal migration secondary to abnormality of Bergmann glia. Proc Natl Acad Sci U S A. 1973;70:240–4. doi: 10.1073/pnas.70.1.240. [DOI] [PMC free article] [PubMed] [Google Scholar]
- 14.Shibata T, Yamada K, Watanabe M, Ikenaka K, Wada K, Tanaka K, Inoue Y. Glutamate transporter GLAST is expressed in the radial glia-astrocyte lineage of developing mouse spinal cord. J Neurosci. 1997;17:9212–9. doi: 10.1523/JNEUROSCI.17-23-09212.1997. [DOI] [PMC free article] [PubMed] [Google Scholar]
- 15.Goldowitz D. The weaver granuloprival phenotype is due to intrinsic action of the mutant locus in granule cells: evidence from homozygous weaver chimeras. Neuron. 1989;2:1565–75. doi: 10.1016/0896-6273(89)90045-7. [DOI] [PubMed] [Google Scholar]
- 16.Hamre KM, Goldowitz D. meander tail acts intrinsic to granule cell precursors to disrupt cerebellar development: analysis of meander tail chimeric mice. Development. 1997;124:4201–12. doi: 10.1242/dev.124.21.4201. [DOI] [PubMed] [Google Scholar]
- 17.Ross ME, Fletcher C, Mason CA, Hatten ME, Heintz N. Meander tail reveals a discrete developmental unit in the mouse cerebellum. Proc Natl Acad Sci U S A. 1990;87:4189–92. doi: 10.1073/pnas.87.11.4189. [DOI] [PMC free article] [PubMed] [Google Scholar]
- 18.Yamada K, Fukaya M, Shibata T, Kurihara H, Tanaka K, Inoue Y, Watanabe M. Dynamic transformation of Bergmann glial fibers proceeds in correlation with dendritic outgrowth and synapse formation of cerebellar Purkinje cells. J Comp Neurol. 2000;418:106–20. [PubMed] [Google Scholar]
- 19.Dahmane N, Ruiz i Altaba A. Sonic hedgehog regulates the growth and patterning of the cerebellum. Development. 1999;126:3089–100. doi: 10.1242/dev.126.14.3089. [DOI] [PubMed] [Google Scholar]
- 20.Lewis PM, Gritli-Linde A, Smeyne R, Kottmann A, McMahon AP. Sonic hedgehog signaling is required for expansion of granule neuron precursors and patterning of the mouse cerebellum. Dev Biol. 2004;270:393–410. doi: 10.1016/j.ydbio.2004.03.007. [DOI] [PubMed] [Google Scholar]
- 21.Aruga J, Inoue T, Hoshino J, Mikoshiba K. Zic2 controls cerebellar development in cooperation with Zic1. J Neurosci. 2002;22:218–25. doi: 10.1523/JNEUROSCI.22-01-00218.2002. [DOI] [PMC free article] [PubMed] [Google Scholar]
- 22.Eiraku M, Tohgo A, Ono K, Kaneko M, Fujishima K, Hirano T, Kengaku M. DNER acts as a neuron-specific Notch ligand during Bergmann glial development. Nat Neurosci. 2005;8:873–80. doi: 10.1038/nn1492. [DOI] [PubMed] [Google Scholar]
- 23.Tohgo A, Eiraku M, Miyazaki T, Miura E, Kawaguchi SY, Nishi M, Watanabe M, Hirano T, Kengaku M, Takeshima H. Impaired cerebellar functions in mutant mice lacking DNER. Mol Cell Neurosci. 2006;31:326–33. doi: 10.1016/j.mcn.2005.10.003. [DOI] [PubMed] [Google Scholar]
- 24.Sadakata T, Kakegawa W, Mizoguchi A, Washida M, Katoh-Semba R, Shutoh F, Okamoto T, Nakashima H, Kimura K, Tanaka M, Sekine Y, Itohara S, Yuzaki M, Nagao S, Furuichi T. Impaired cerebellar development and function in mice lacking CAPS2, a protein involved in neurotrophin release. J Neurosci. 2007;27:2472–82. doi: 10.1523/JNEUROSCI.2279-06.2007. [DOI] [PMC free article] [PubMed] [Google Scholar]
- 25.Collins LL, Lee YF, Heinlein CA, Liu NC, Chen YT, Shyr CR, Meshul CK, Uno H, Platt KA, Chang C. Growth retardation and abnormal maternal behavior in mice lacking testicular orphan nuclear receptor 4. Proc Natl Acad Sci U S A. 2004;101:15058–63. doi: 10.1073/pnas.0405700101. [DOI] [PMC free article] [PubMed] [Google Scholar]
- 26.Harry GJ, Funk JA, Lefebvre d’Hellencourt C, McPherson CA, Aoyama M. The type 1 interleukin 1 receptor is not required for the death of murine hippocampal dentate granule cells and microglia activation. Brain Res. 2008;1194:8–20. doi: 10.1016/j.brainres.2007.11.076. [DOI] [PMC free article] [PubMed] [Google Scholar]
- 27.Harry GJ, Kraft AD. Neuroinflammation and microglia: considerations and approaches for neurotoxicity assessment. Expert Opin Drug Metab Toxicol. 2008;4:1265–77. doi: 10.1517/17425255.4.10.1265. [DOI] [PMC free article] [PubMed] [Google Scholar]
- 28.Fox MW. Environmental factors influencing stereotyped and allelomimetic behavior in animals. Lab Anim Care. 1965;15:363–70. [PubMed] [Google Scholar]
- 29.Fox WM. Reflex-ontogeny and behavioural development of the mouse. Anim Behav. 1965;13:234–41. doi: 10.1016/0003-3472(65)90041-2. [DOI] [PubMed] [Google Scholar]
- 30.Harry GJ, Tilson HA. The effects of postpartum exposure to triethyl tin on the neurobehavioral functioning of rats. Neurotoxicology. 1981;2:283–96. [PubMed] [Google Scholar]
- 31.Dulawa SC, Geyer MA. Effects of strain and serotonergic agents on prepulse inhibition and habituation in mice. Neuropharmacology. 2000;39:2170–9. doi: 10.1016/s0028-3908(00)00030-7. [DOI] [PubMed] [Google Scholar]
- 32.Geyer MA, McIlwain KL, Paylor R. Mouse genetic models for prepulse inhibition: an early review. Mol Psychiatry. 2002;7:1039–53. doi: 10.1038/sj.mp.4001159. [DOI] [PubMed] [Google Scholar]
- 33.Moy SS, Nadler JJ, Magnuson TR, Crawley JN. Mouse models of autism spectrum disorders: the challenge for behavioral genetics. Am J Med Genet C Semin Med Genet. 2006;142C:40–51. doi: 10.1002/ajmg.c.30081. [DOI] [PubMed] [Google Scholar]
- 34.Marler MR, Gehrman P, Martin JL, Ancoli-Israel S. The sigmoidally transformed cosine curve: a mathematical model for circadian rhythms with symmetric non-sinusoidal shapes. Statistics in Medicine. 2006;25:3893–904. doi: 10.1002/sim.2466. [DOI] [PubMed] [Google Scholar]
- 35.Chen YT, Collins LL, Uno H, Chou SM, Meshul CK, Chang SS, Chang C. Abnormal cerebellar cytoarchitecture and impaired inhibitory signaling in adult mice lacking TR4 orphan nuclear receptor. Brain Res. 2007;1168:72–82. doi: 10.1016/j.brainres.2007.06.069. [DOI] [PMC free article] [PubMed] [Google Scholar]
- 36.Alcantara S, Ferrer I, Soriano E. Postnatal development of parvalbumin and calbindin D28K immunoreactivities in the cerebral cortex of the rat. Anat Embryol (Berl) 1993;188:63–73. doi: 10.1007/BF00191452. [DOI] [PubMed] [Google Scholar]
- 37.Iacopino AM, Rhoten WB, Christakos S. Calcium binding protein (calbindin-D28k) gene expression in the developing and aging mouse cerebellum. Brain Res Mol Brain Res. 1990;8:283–90. doi: 10.1016/0169-328x(90)90041-b. [DOI] [PubMed] [Google Scholar]
- 38.Chen YT, Collins LL, Uno H, Chang C. Deficits in motor coordination with aberrant cerebellar development in mice lacking testicular orphan nuclear receptor 4. Mol Cell Biol. 2005;25:2722–32. doi: 10.1128/MCB.25.7.2722-2732.2005. [DOI] [PMC free article] [PubMed] [Google Scholar]
- 39.Zhang Y, Chen YT, Xie S, Wang L, Lee YF, Chang SS, Chang C. Loss of testicular orphan receptor 4 impairs normal myelination in mouse forebrain. Mol Endocrinol. 2007;21:908–20. doi: 10.1210/me.2006-0219. [DOI] [PubMed] [Google Scholar]
- 40.Willuhn I, Steiner H. Motor-skill learning-associated gene regulation in the striatum: effects of cocaine. Neuropsychopharmacology. 2006;31:2669–82. doi: 10.1038/sj.npp.1300995. [DOI] [PubMed] [Google Scholar]
- 41.Cook EH, Jr, Courchesne RY, Cox NJ, Lord C, Gonen D, Guter SJ, Lincoln A, Nix K, Haas R, Leventhal BL, Courchesne E. Linkage-disequilibrium mapping of autistic disorder, with 15q11-13 markers. Am J Hum Genet. 1998;62:1077–83. doi: 10.1086/301832. [DOI] [PMC free article] [PubMed] [Google Scholar]
- 42.Perry W, Minassian A, Lopez B, Maron L, Lincoln A. Sensorimotor gating deficits in adults with autism. Biol Psychiatry. 2007;61:482–6. doi: 10.1016/j.biopsych.2005.09.025. [DOI] [PubMed] [Google Scholar]
- 43.McAlonan GM, Daly E, Kumari V, Critchley HD, van Amelsvoort T, Suckling J, Simmons A, Sigmundsson T, Greenwood K, Russell A, Schmitz N, Happe F, Howlin P, Murphy DG. Brain anatomy and sensorimotor gating in Asperger’s syndrome. Brain. 2002;125:1594–606. doi: 10.1093/brain/awf150. [DOI] [PubMed] [Google Scholar]
- 44.Dawson G, Webb S, Schellenberg GD, Dager S, Friedman S, Aylward E, Richards T. Defining the broader phenotype of autism: genetic, brain, and behavioral perspectives. Dev Psychopathol. 2002;14:581–611. doi: 10.1017/s0954579402003103. [DOI] [PubMed] [Google Scholar]
- 45.Moy SS, Nadler JJ. Advances in behavioral genetics: mouse models of autism. Mol Psychiatry. 2008;13:4–26. doi: 10.1038/sj.mp.4002082. [DOI] [PubMed] [Google Scholar]
- 46.Swerdlow NR, Shoemaker JM, Stephany N, Wasserman L, Ro HJ, Geyer MA. Prestimulus effects on startle magnitude: sensory or motor? Behav Neurosci. 2002;116:672–81. doi: 10.1037//0735-7044.116.4.672. [DOI] [PubMed] [Google Scholar]
- 47.Paylor R, Crawley JN. Inbred strain differences in prepulse inhibition of the mouse startle response. Psychopharmacology (Berl) 1997;132:169–80. doi: 10.1007/s002130050333. [DOI] [PubMed] [Google Scholar]
- 48.Boyden ES, Katoh A, Raymond JL. Cerebellum-dependent learning: the role of multiple plasticity mechanisms. Annu Rev Neurosci. 2004;27:581–609. doi: 10.1146/annurev.neuro.27.070203.144238. [DOI] [PubMed] [Google Scholar]
- 49.Ito M. Control of mental activities by internal models in the cerebellum. Nat Rev Neurosci. 2008;9:304–13. doi: 10.1038/nrn2332. [DOI] [PubMed] [Google Scholar]
- 50.Rio C, Rieff HI, Qi P, Khurana TS, Corfas G. Neuregulin and erbB receptors play a critical role in neuronal migration. Neuron. 1997;19:39–50. doi: 10.1016/s0896-6273(00)80346-3. [DOI] [PubMed] [Google Scholar]
- 51.Zheng C, Heintz N, Hatten ME. CNS gene encoding astrotactin, which supports neuronal migration along glial fibers. Science. 1996;272:417–9. doi: 10.1126/science.272.5260.417. [DOI] [PubMed] [Google Scholar]
- 52.Adams NC, Tomoda T, Cooper M, Dietz G, Hatten ME. Mice that lack astrotactin have slowed neuronal migration. Development. 2002;129:965–72. doi: 10.1242/dev.129.4.965. [DOI] [PubMed] [Google Scholar]
- 53.Nicholls D, Attwell D. The release and uptake of excitatory amino acids. Trends Pharmacol Sci. 1990;11:462–8. doi: 10.1016/0165-6147(90)90129-v. [DOI] [PubMed] [Google Scholar]
- 54.Watase K, Hashimoto K, Kano M, Yamada K, Watanabe M, Inoue Y, Okuyama S, Sakagawa T, Ogawa S, Kawashima N, Hori S, Takimoto M, Wada K, Tanaka K. Motor discoordination and increased susceptibility to cerebellar injury in GLAST mutant mice. Eur J Neurosci. 1998;10:976–88. doi: 10.1046/j.1460-9568.1998.00108.x. [DOI] [PubMed] [Google Scholar]
- 55.De Schutter E, Vos B, Maex R. The function of cerebellar Golgi cells revisited. Prog Brain Res. 2000;124:81–93. doi: 10.1016/s0079-6123(00)24009-0. [DOI] [PubMed] [Google Scholar]
- 56.Ueno S, Tsukamoto M, Hirano T, Kikuchi K, Yamada MK, Nishiyama N, Nagano T, Matsuki N, Ikegaya Y. Mossy fiber Zn2+ spillover modulates heterosynaptic N-methyl-D-aspartate receptor activity in hippocampal CA3 circuits. J Cell Biol. 2002;158:215–20. doi: 10.1083/jcb.200204066. [DOI] [PMC free article] [PubMed] [Google Scholar]
- 57.Goldowitz D, Hamre K. The cells and molecules that make a cerebellum. Trends Neurosci. 1998;21:375–82. doi: 10.1016/s0166-2236(98)01313-7. [DOI] [PubMed] [Google Scholar]
- 58.Kelly RM, Strick PL. Cerebellar loops with motor cortex and prefrontal cortex of a nonhuman primate. J Neurosci. 2003;23:8432–44. doi: 10.1523/JNEUROSCI.23-23-08432.2003. [DOI] [PMC free article] [PubMed] [Google Scholar]
- 59.Stoodley CJ, Schmahmann JD. Functional topography in the human cerebellum: a meta-analysis of neuroimaging studies. Neuroimage. 2009;44:489–501. doi: 10.1016/j.neuroimage.2008.08.039. [DOI] [PubMed] [Google Scholar]
- 60.Dirks A, Groenink L, Schipholt MI, van der Gugten J, Hijzen TH, Geyer MA, Olivier B. Reduced startle reactivity and plasticity in transgenic mice overexpressing corticotropin-releasing hormone. Biol Psychiatry. 2002;51:583–90. doi: 10.1016/s0006-3223(01)01323-3. [DOI] [PubMed] [Google Scholar]
- 61.Fiez JA. Cerebellar contributions to cognition. Neuron. 1996;16:13–5. doi: 10.1016/s0896-6273(00)80018-5. [DOI] [PubMed] [Google Scholar]
- 62.Gao JH, Parsons LM, Bower JM, Xiong J, Li J, Fox PT. Cerebellum implicated in sensory acquisition and discrimination rather than motor control. Science. 1996;272:545–7. doi: 10.1126/science.272.5261.545. [DOI] [PubMed] [Google Scholar]