Abstract
Androgen deprivation therapy is the most common treatment option for advanced prostate cancer. Almost all prostate cancers recur during androgen deprivation therapy, and new evidence suggests that androgen receptor activation persists despite castrate levels of circulating androgens. Quantitation of tissue levels of androgens is critical to understanding the mechanism of recurrence of prostate cancer during androgen deprivation therapy. A liquid chromatography atmospheric pressure photoionization tandem mass spectrometric method was developed for quantitation of tissue levels of androgens. Quantitation of the saturated keto-steroids dihydrotestosterone and 5-α-androstanedione required detection of a novel parent ion, [M + 15]+. The nature of this parent ion was explored and the method applied to prostate tissue and cell culture with comparison to results achieved using electrospray ionization.
Keywords: APPI, Prostate cancer, Androgen, Tandem mass spectrometry, Dihydrotestosterone, Dutasteride
Introduction
The American Cancer Society estimated that 192,280 new cases of prostate cancer (CaP) and 27,360 deaths related to CaP would occur in 2009.1 Androgen deprivation therapy (ADT) offers palliation for advanced CaP2, but no significant improvements have been made in the 60 years since its discovery. CaP recurs eventually in almost all cases treated by ADT and these cases of recurrent CaP respond poorly to all known therapies and usually cause death. Recurrent CaP has historically been thought of as androgen-independent because CaP recurs during ADT. Evidence of androgen receptor (AR) activation in recurrent CaP has led to hypotheses involving altered cellular androgen metabolism and AR-signaling. In addition, growing evidence suggests that intracrine synthesis of testicular androgens allow AR activation in recurrent CaP.3, 4 However, low tissue concentrations of testicular androgens in the castrate male necessitate sensitive analytical techniques for study of changes in androgen metabolism that occur in response to ADT.
Radioimmunoassay (RIA) was used for the detection and quantitation of androgens in prostate tissues by Mohler, et al., who found that levels of testosterone (T) were similar in CaP recurrent during ADT and androgen stimulated CaP and benign prostate hyperplasia.5 Dihydrotestosterone (DHT), the preferred ligand of AR, concentrations were reduced during ADT, but still averaged 1.45 nM in recurrent CaP, a concentration sufficient to activate normal androgen receptor. RIA requires pre-separation of the targeted androgens, which can lead to analyte loss, and is subject to interference via non-specific binding. Liquid chromatography tandem mass spectrometry (LC/MS/MS) offers advantages over RIA, which include simpler sample preparation and greater reproducibility, accuracy, and specificity.6 The presence of DHT in ADT recurrent CaP tissue suggested by RIA measurement was confirmed using LC/ESI/MS/MS. 7
In androgen responsive tissues, intracellular T acts as a prohormone that is converted to DHT. In the prostate, the enzyme steroid 5α-reductase (SRD5A; EC 1.3.99.5) (http://www.genome.jp/kegg/pathway/map/map00150.html) metabolizes testosterone to DHT. SRD5A inhibitors, finasteride against SRD5A type 2 and dutasteride against SRD5A types 1 and 2, have proven useful for treatment of benign prostate enlargement and are under investigation for prostate cancer prevention and treatment of androgen-stimulated and recurrent CaP.8-13 Continued investigation of new therapies for benign and malignant prostate disease requires accurate measurement of T, DHT and other androgens in prostate tissue.
Determination of T and DHT in samples using LC/ESI/MS/MS is quite sensitive, but the necessity of measuring tissue androgens in small samples, such as prostate biopsies and microdissected radical prostectomy specimens, limits the usefulness of existing methods. In addition, more sensitive detection and quantification of other steroid compounds is important to fully characterize tissue metabolism of androgens. For example, quantitation of androstenedione (ASD), 5α-androstan-3α, 17β-diol (5α-diol), 5-androsten-3β-ol-17-one (dehydroepiandrosterone, DHEA), 5α-androstanedione (5α-ASD), and 5α-androstan-3α-ol-17-one (androsterone, AND) is important for understanding the origin and fate of potential AR ligands, especially during androgen deprivation therapy. The characterization of the entire androgen metabolism pathway has become more important because drugs, such as abiraterone14 and VN124/TOK00115, both of which are in clinical trials, have been developed that interfere with synthesis of DHT from adrenal androgens. The monitoring of multiple androgens in prostate tissue may raise the limits of quantitation (LOQ) of the individual analytes when using a quadrupole mass analyzer. Therefore, research into intracrine metabolism of steroid hormones in prostate and other hormonally-responsive cancers requires improved sensitivity of detection of low levels of androgens and other steroid hormones in biological samples.
A number of articles reporting improved MS sensitivity for steroids have appeared in the literature. Zhao, et al., reported the simultaneous quantification of steroid hormones in human testicular fluid using an LC/ESI/MS/MS method.16 They reported improved limits of quantitation (S/N>5) of 0.1 ng/mL for T and of 0.02 ng/mL for DHT (on a Micromass Quattro triple-quadrupole). Atmospheric pressure photoionization (APPI)17-20 has been reported to increase sensitivity for unsaturated keto-steroids. For example, Guo, et al., reported the quantitation of 12 steroids using isotope dilution LC/APPI/MS/MS on either a Sciex API300021 or 5000.22 These 12 analytes included analytes that are implicated in androgen metabolism, such as T, ASD, and DHEA, with limits of detection on the newer instrument (3 SDs over the baseline noise) of 1.5, 1.5, and 10.0 pg/mL, respectively. Recently, Zhang and co-workers used direct derivatization (dansylation) to quantitate four steroids: testosterone, 11-ketotestosterone, estradiol and ethinyl estradiol. They reported results from 10 μL of fish plasma with an LOQ of 1 ng/mL for T (S:N = 8).23 The authors note that the 10 μL sample size is 5-50 fold less than most published methods. These results, although on instruments of different vintages, indicate increased sensitivity for T under APPI conditions than with ESI. Several studies have utilized APPI to identify and quantitate steroids22, 24-27, but none of these included DHT as an analyte. The omission of DHT in these reports may be due to the poor yield of DHT [M + H]+ ions from the APPI source, and illustrates a limitation of the use of APPI for comprehensive steroid quantification.
In this study, we report an LC/APPI/MS/MS method for the quantification of seven intracellular androgens. The requisite sensitivity for the saturated keto-steroids DHT and 5α-ASD is achieved through the selection of a novel [M + 15]+ parent ion. The origin of this ion is also reported.
Materials
Chemicals
Deuterated T and DHT (d3-16,16,17α) were purchased from CDN isotopes (Pointe-Claire, Quebec, CA). 1,2,4,5-d4-DHT, 5α-androstan-3-one, 5α-cholestan-3-one, 5β-cholestan-3-one, and 5α-dihydroprogesterone were purchased from Steraloids (Newport, RI). ASD, 5α-diol, T, DHEA, 5α-ASD, DHT, AND, d3-methanol, and formic acid (88%, ACS reagent grade) were purchased from Sigma-Aldrich (St. Louis, MO). Ethanol was obtained from Pharmco (Brookfield, CT). Ammonium formate and HPLC grade toluene were purchased from Fisher Scientific (Fairlawn, NJ). Methanol was purchased from Caledon Laboratories (Georgetown, Ontario, Canada). Deionized water was obtained from a Hydro Services Picopure 2 water system (Durham, NC).
Methods
Chromatography
An Agilent 1100 capillary LC system (Santa Clara, CA) was used for separation. The column was a Luna 3 μm C18(2) 100 Å from Phenomenex (Torrance, CA) with dimensions 150 × 2 mm. Solutions were filtered through a 0.45 μm pore size membranes using a vacuum aspirator. Millipore (Bedford, MA) HAWP mixed cellulose ester membranes were used for aqueous solutions and Alltech (Deerfield, IL) PTFE membranes were used for methanolic solutions. Mobile phase A was 2 mM ammonium formate, pH 3.1, in water, and mobile phase B was 2 mM ammonium formate, pH 3.1, in methanol. Stock solutions of 20 mM ammonium formate were prepared by dissolving 120 mg ammonium formate in 500 mL of water or methanol, followed by the addition of 307 μL formic acid. Stocks were kept at 4°C and were diluted and filtered prior to use. Diluted solutions were discarded after one week. Stocks were discarded after four weeks. Gradient elution was performed at a flow rate of 175 μL/min and a column temperature of 60 °C. The gradient was run from 65% B at 0 min. to 80% B at 2.25 min., to 95% B at 13 min, 100% B at 13.1 min then reduced to 65% B at 17.5 min.
Mass Spectrometry
Mass spectrometry was performed on an MDS Sciex API-3000 triple quadrupole instrument. A Turbo IonSpray source was used for ESI experiments, a PhotoSpray source was used for dopant assisted APPI experiments, and a heated nebulizer source was used for APCI experiments. A Gilson 305 pump was used to deliver toluene as dopant for APPI at 20 μL/min. All experiments were performed in the positive ion mode. The source voltage was set to 4500 V for ESI and 1375 V for APPI. Source temperature was set to 350° C. Nitrogen auxiliary gas was delivered at 75 psi for APPI experiments and a flow rate of 7 L/min for ESI experiments.
Source parameters and ion pairs used for SRM quantitation and confirmation varied with the ionization technique used (Table 1). All ions were singly charged. Two parent / fragment pairs were monitored for each analyte. The more abundant pair was used for quantitation and the second pair was used for identity confirmation. Acquisition was split into three time windows, with ASD, T, 5α-diol, and DHEA eluting in the first window, 5α-ASD and DHT in the second, and AND in the third. Dwell time was increased by monitoring SRM pairs only during the time a target analyte elutes, which reduced background noise levels. Dwell times were adjusted for a minimum of 16 data points across each chromatographic peak. The LOQs were defined as a signal to noise ratio > 3. For determination of the calibration curves, samples were reconstituted in 100 μL of 65% acetonitrile. The injection volume was 12 uL and the amounts injected on-column were 0.5 - 150 pg for ASD and T, 5 – 1500 pg for Adiol, 10 – 3000 pg for DHEA and DHT, 40 – 12000 pg for 5α-ASD, and 2 - 600 pg for AND. Analyses were performed in triplicate.
Table 1.
Instrument parameters and limits of detection (S/N > 3) for ESI and APPI of targeted androgens
| Compound | rT (min) | Ionization | LOD (pg) | Parent | Fragment | DP (V)a | FP (V)b | CE (V)c |
|---|---|---|---|---|---|---|---|---|
| ASD | 7.4 | ESI | 1 | 287.2 | 97.0 | 28 | 135 | 32.5 |
| APPI | 0.5 | 287.2 | 97.0 | 28 | 115 | 32.5 | ||
| T | 8.3 | ESI | 1 | 289.2 | 97.0 | 28 | 135 | 33 |
| APPI | 0.5 | 289.2 | 97.0 | 28 | 115 | 33 | ||
| 5α-diol | 8.3 | ESI | 20 | 308.2 | 273.2 | 28 | 160 | 11.5 |
| APPI | 5 | 273.2 | 255.2 | 20 | 100 | 21 | ||
| DHEA | 9.1 | ESI | 40 | 289.2 | 271.2 | 31 | 155 | 14 |
| APPI | 10 | 253.2d | 197.1d | 30 | 100 | 30 | ||
| 5α-ASD | 9.8 | ESI | 10 | 289.2 | 271.2 | 34 | 160 | 17 |
| APPI | 20 | 303.2 | 253.2 | 26 | 120 | 25 | ||
| DHT | 10.3 | ESI | 3 | 291.2 | 255.2 | 42 | 175 | 22 |
| APPI | 5 | 305.2 | 255.2 | 29 | 135 | 24 | ||
| AND | 11.6 | ESI | 4 | 291.2 | 255.2 | 22 | 110 | 20 |
| APPI | 2 | 273.2 | 255.2 | 21 | 85 | 20 |
DP = declustering potential
FP = focusing potential
CE = collision energy
Although [M + H – H2O]+ was the most abundant ion formed by DHEA, [M + H – 2(H2O)]+ was found to be a preferable parent ion for SRM quantitation due to high yield of m/z 197 fragment
Results and Discussion
In our previous quantitative study of T and DHT in recurrent CaP specimens,7 we were successful at quantifying suitably low levels of T and DHT using electrospray ionization. However, as our interest included quantitation of the components of the androgen cycle and in specific sub-areas of CaP tissue, the increased number of components to be analyzed and the reduced tissue sample amounts led us to explore means of improving our quantitation limits. Steroids, especially α,β-unsaturated keto-steroids, have been reported to form [M + H]+ ions efficiently under APPI conditions.20, 24 APPI has also been reported to reduce background levels compared with ESI.20 Finally, APPI tends to be less susceptible to matrix effects.26, 28 For these reasons, we decided to explore the applicability of APPI for analysis of tissue androgens.
For the initial experiment, we analyzed a solution containing 2 ng each of T and DHT and monitored the masses of the [M + H]+ ions of each. The selected ion chromatograms (SIC) of the [M + H]+ ions of T and DHT using APPI (Supplemental Fig. 1A and 1B, respectively) compared to ESI (Supplemental Fig. 1C and 1D, respectively) showed that the overall ion currents of T obtained by APPI and ESI were comparable (6.96e6, ESI; 6.66e6, APPI). However the S:N for T by APPI was five-fold greater than that for T by ESI. In contrast, the ion current of the DHT [M + H]+ ion was a factor of five greater by ESI (1.05e6) than by APPI (0.2e6). APPI noise levels were roughly half that of ESI, leading to a 2.5 fold decrease in S:N via APPI vs. ESI. A similar decrease in DHT sensitivity using APPI was reported by Yamamoto, et al.24
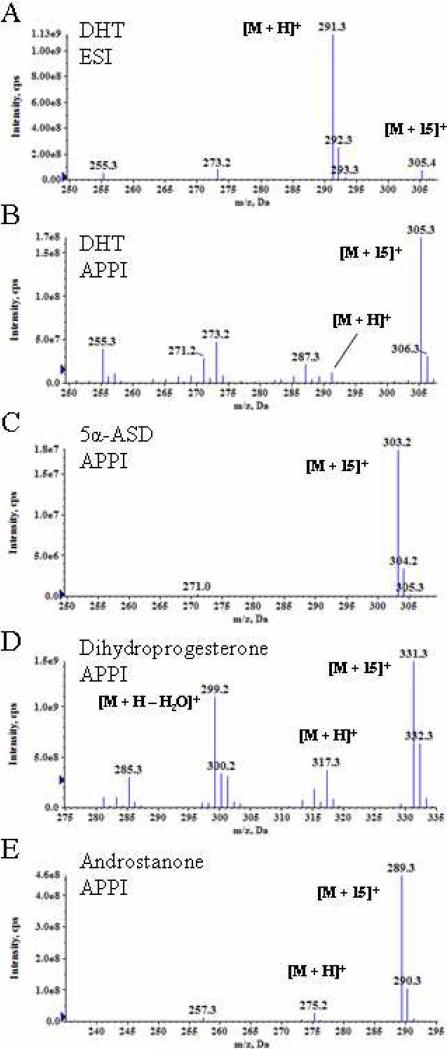
The full scan mass spectra of DHT under ESI (Fig. 1A) and APPI conditions (Fig. 1B) were acquired and inspected to see if water loss, as has been noted for sterols12, could explain, at least in part, the loss in sensitivity under APPI conditions. Electrospray ionization of DHT in a water : methanol solution resulted in an abundant protonated DHT ion (Fig. 1A). Although a minor amount of [M + H - H2O]+ was observed in the APPI spectrum (Fig. 1B), the most abundant ion observed was an ion with a mass 14 Da (m/z 305) above the mass of protonated DHT (m/z 291). This is in contrast to the behavior of T where a protonated ion was observed using both APPI and ESI (data not shown). The data suggested that a reaction occurred during the APPI process. The androgens of interest also contained a second saturated keto-steroid, 5α-ASD. Examination of the APPI mass spectrum of 5α-ASD identified an [M + 15]+ ion as the parent ion (Fig. 1C). Furthermore, the saturated keto-steroids 5α-dihydroprogesterone (Fig. 1D) and 5α-androstan-3-one (Fig. 1E) form [M + 15]+ ions when subjected to dopant assisted photoionization. Thus, this ionization mechanism appears general for α,β-saturated-keto-steranes. The simpler saturated ketones cyclohexanone and 2-octadecanone were also investigated and found to form [M + 15]+ ions under these conditions. The APPI spectra of α,β-saturated sterols, 5α-diol, DHEA and AND were dominated by the [M + H - H2O]+ ions (data not shown). No significant peak due to formation of an [M + 15 – H2O]+ ion was observed in the spectra of the hydroxy-ketosteroids, DHEA or AND.
Figure 1.
The mass spectra of 5α-reduced androgens using ESI and APPI conditions. A) ESI) spectrum of DHT. The APPI spectra of B) DHT, C) 5α-ASD, D) dihydroprogesterone and E) 5α-androstan-3-one.
Origin and behavior of the [M + 15]+ ion
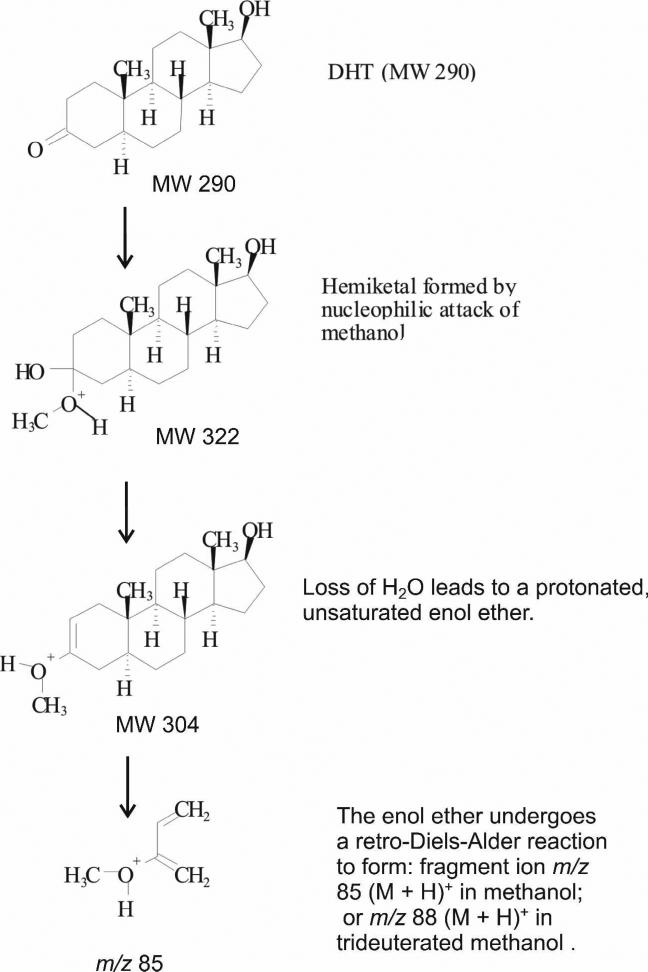
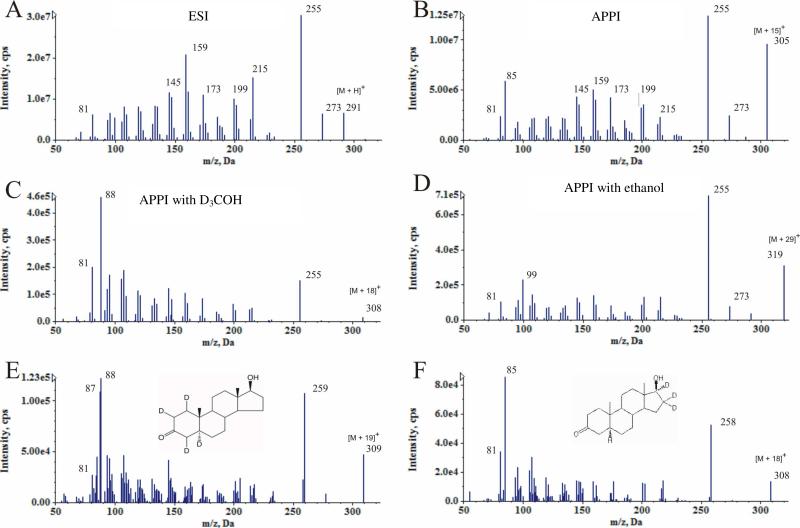
A likely potential source of the [M + 15]+ ion is via reaction of the keto-sterane in the APPI source with methanol from the chromatographic mobile phase. Nucleophilic attack of the keto oxygen by methanol would result in a hemiketal. Subsequent protonation and dehydration would yield the observed [M + 15]+ ion (Scheme A; note that protonation may occur at steps other than that used for illustrative purposes). The product ion spectrum of the ESI produced [M + H]+ ion of DHT (Fig. 2A) is similar to the product ion spectrum of the APPI produced [M + 15]+ ion of DHT (Fig. 2B). However, a fragment of m/z 85 which is absent in the [M + H]+ product spectrum is present in the [M + 15]+ product spectrum. The APPI parent ion mass shifts to [M + 18]+ in trideutero-methanol (Fig. 2C) and to [M + 29]+ in ethanol (Fig. 2D), confirming alkyl addition from the mobile phase and the identity of the [M + 15]+ parent ion as [M + CH3]+.
Scheme A.
Figure 2.
Product spectra of DHT. A) ESI produced [DHT + H]+. B) APPI produced [DHT + 15]+. C) DHT in trideutero-methanol. D) DHT in ethanol. E) 1,2,4,5-d4-DHT. F) 16,16,17-d3-DHT.
Further evidence for the structure of the [M + 15]+ ion is provided by the m/z 85 fragment ion. This fragment ion also shifts with the change in mobile phase, indicating it contains the modified portion of the parent molecule. In addition, the fragment is observed at m/z 88 from 1,2,4,5-d4-DHT (Fig. 2E) but remains at m/z 85 in the CID spectrum of 16,16,17-d3-DHT (Fig. 2F). Thus the modification is confirmed to be in the A-ring of DHT. A proposed fragment structure is shown in the Scheme. The m/z 85 ion was used as the confirmatory ion and the base fragment ion, m/z 255 for DHT and m/z 253 for 5α-ASD, was used for quantitation.
The most abundant species in the APPI spectrum of 5α-cholestan-3-one is the [M + 15]+ ion but [M - 17]+ is the most abundant for 5β-cholestan-3-one (Supplemental Figure S2). We hypothesize that the formation of this ion occurs through initial formation of the [M + CH3]+ which then undergoes loss of CH3OH due to steric hindrance in the β-isomer. This behavior may be useful for assessing the stereospecificity of syntheses of saturated keto products.
LC optimization
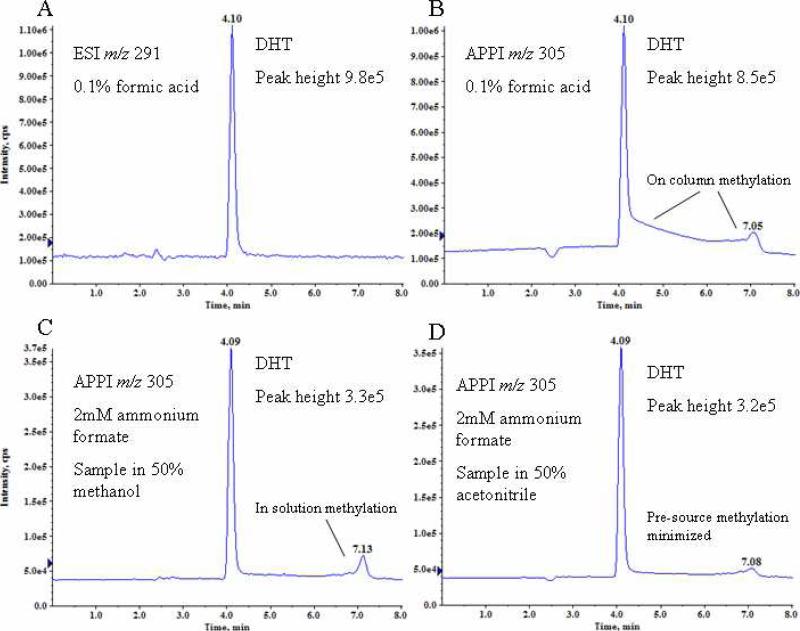
Experimental evidence suggests methylation occurs both in the APPI source and during chromatography when using methanolic solutions. 85% methanol was used for isocratic chromatography experiments. The primary [M + 15]+ ion peak observed with APPI is at the same retention time (4.1 min) as the [M + H]+ peak observed with ESI (Fig. 3A, 3B), which suggests that methylation occurs within the APPI source. However, when chromatography was performed with 0.1% formic acid mobile phase modifier and APPI, an elevated level of [M + 15]+ continued to elute after the DHT chromatographic peak (Fig. 3B, tailing peak). A second [M + 15]+ maximum was observed before the baseline returned to background level. This behavior was not observed under the same chromatographic conditions when monitoring the [M + H]+ species in conjunction with ESI (Fig. 3A). Taken together, these data indicate that the methylation of keto-steranes occurred both on the chromatography column and in the APPI source. When 2 mM ammonium formate was used as a mobile phase modifier, on-column methylation was minimized (Fig. 3C). Even with the addition of 2 mM ammonium formate, however, a second [M + 15]+ peak was observed in the chromatogram (7.1 min) when the analyte was solvated in 50% methanol prior to injection. The peak was eliminated when the analyte was solvated in 50% acetonitrile (Fig. 3D). This in-solution methylation would be unobserved in methods utilizing ESI and SIM or SRM targeting the [M + H]+ species and has potential to negatively impact the sensitivity and reproducibility of such methods.
Figure 3.
Extracted ion chromatograms of DHT in 85% methanol. A) [DHT+H]+ using 0.1% formic acid mobile phase modifier and ESI; B) Methylated DHT adduct [DHT+CH3]+ using APPI , peak tailing was due to on-column methylation of DHT; C) Methylated DHT adduct [DHT+CH3]+ using APPI and ammonium formate buffer showed minimized on-column methylation and improved peak shape; D) Methylated DHT adduct [DHT+CH3]+ using APPI and solvation of DHT in acetonitrile rather than methanol eliminated the secondary methylated DHT chromatographic peak.
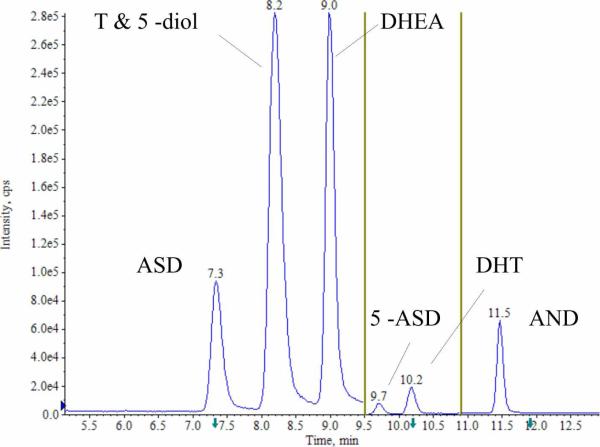
Peak height was reduced to ~40% in ammonium formate modified buffer compared to formic acid modified mobile phase (Fig. 3B, 3C). However, a linear calibration was achieved for DHT with ammonium formate solution, which could not be achieved in formic acid solution. Using ammonium formate as the mobile phase modifier, a gradient LC method was developed that achieved baseline separation of all analytes except T and 5α-diol in 13 minutes (Fig. 4). These two analytes differ in mass and coelution was deemed acceptable given the low interference potential.
Figure 4.
LC/ESI/MS/MS total ion chromatogram demonstrated baseline separation for six of seven androgens, ASD, T, DHEA, 5α-ASD, DHT and AND. 5α-diol co-eluted with T but can be discriminated based upon mass. The vertical bars represent transitions to new SRM acquisition windows.
SRM quantitation
The limits of quantitation by selected reaction monitoring (SRM) of the transitions under optimized instrument parameters for the seven androgens studied are shown in Table 1. Linear calibration curves were obtained under APPI conditions for ASD, T, 5α-Diol, DHEA, 5α-ASD DHT, and AND. Calibration ranges were 0.5 - 150 pg on column for ASD and T, 5 – 1500 pg for 5α-Diol, 10 – 3000 pg for DHEA and DHT, 40 – 12000 pg for 5α-ASD, and 2 - 600 pg for AND. The coefficient of determination was >0.994 for all analytes. Concentrations were calculated based on the ratio of the area of the analyte chromatographic peak to the area of the internal standard peak. The limit of quantitation was defined as a peak height 3 times that of the peak to valley noise (S/N > 3) and less than 15% variation in calculated concentrations. APPI detection levels for the saturated keto-androgens using these parameters were within 2-fold of those obtained by ESI, while detection levels improved 2-4-fold for the other target analytes.
Application to CaP cell culture and rat prostate tissue
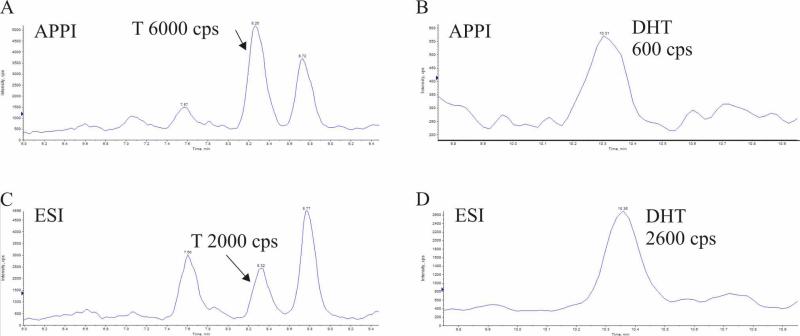
The LC/APPI/MS/MS method was applied for analysis of androgens in cell culture and rat prostate tissue and compared to LC/ESI/MS/MS. The APPI results for androgens isolated from CaP cell culture media (Table 2) were based on triplicate injections of three experimental replicates. These samples constituted a relatively simple matrix. The concentrations measured using APPI and ESI agreed to within 15% or less, with the exception of AND which varied ~20% at maximum. DHEA produced S:N < 3 in ESI experiments. When the methods were applied to rat prostate tissue, T sensitivity during APPI was 3-fold higher than for ESI (Fig. 5A, 5C) and T became the largest peak in the chromatogram. Good agreement was obtained for concentrations of ASD and T. The increased sensitivity of the APPI method allowed quantitation of DHEA. However, a 4-fold drop in sensitivity for DHT was seen with APPI compared to ESI (Fig. 5B, 5D) and DHT levels were close to the APPI limit of quantitation.
Table 2.
Androgen concentration in CaP cell culture and prostate tissue and comparison of APPI and ESI resultsa
| APPI Analysis | ESI Analysis | |||||||||||||
|---|---|---|---|---|---|---|---|---|---|---|---|---|---|---|
| Sample | ASD | T | 5-ADiol | DHEA | 5α-ASD | DHT | AND | ASD | T | 5-ADiol | DHEA | 5α-ASD | DHT | AND |
| CWR-R1 Cells, 24 h 0.1 uM 5-androstan-3α,17β-diol treatmentb | 0.150 | 0.836 | 1.05 | 0.225 | NA | 24.0 | 9.21 | 0.139 | 0.828 | ND | NQ | 5.745 | 23.7 | 7.26 |
| CWR-R1 Cells, 48h 0.1 uM 5-androstan-3α,17β-diol treatmentb | 0.392 | 1.84 | 1.79 | 0.672 | NA | 5.90 | 4.80 | 0.359 | 1.78 | ND | NQ | 2.40 | 5.98 | 4.12 |
| PC-3 Cells, 24 h 0.1 uM 5-androstan-3α,17β-diol treatmentb | 0.341 | 0.102 | ND | 0.284 | 12.0 | 5.76 | 58.5 | 0.314 | 0.095 | ND | NQ | 13.7 | 6.39 | 51.6 |
| Androgen Stimulated Rat Prostate #1c | 0.22 | 0.48 | ND | 3.42 | ND | 1.24 | NQ | 0.32 | 0.48 | ND | ND | NQ | 2.04 | NQ |
| Androgen Stimulated Rat Prostate #2c | 0.80 | 1.22 | ND | 4.36 | ND | 4.44 | NQ | 1.06 | 1.42 | ND | ND | NQ | 4.28 | NQ |
| Recurrent CaP #1c | 0.18 | 0.06 | ND | 5.28 | ND | 0.58 | 1.02 | 0.24 | 0.04 | ND | ND | NQ | 0.70 | ND |
| Recurrent CaP #2c | 0.26 | 0.52 | ND | 4.64 | ND | ND | 3.6 | 0.24 | 0.54 | ND | ND | NQ | 0.66 | ND |
| Benign Human Prostate Peripheral Zone #1c | 1.18 | 0.60 | 40.8 | 224 | ND | 1.46 | NQ | ND | 0.18 | ND | ND | NQ | 61.2 | NQ |
| Benign Human Prostate Peripheral Zone #2c | 1.42 | 0.72 | 93.4 | 204 | 21.2 | 1.8 | NQ | 2.32 | 0.36 | ND | NQ | ND | 128 | NQ |
| Benign Human Prostate Transition Zone #1c | 2.72 | 1.48 | ND | 78.1 | ND | 9.74 | NQ | 1.12 | 5.44 | ND | ND | ND | 115 | NQ |
| Benign Human Prostate Transition Zone #2c | 0.46 | 0.52 | ND | 15.1 | ND | 1.6 | NQ | 0.16 | 0.46 | ND | NQ | ND | 110 | NQ |
NA = not analyzed; ND = not detected; NQ = S:N < 3 or ratio of quantifying ion to confirmatory ion out of accepted range
ng/mL media
ng/g tissue
Figure 5.
Selected reaction monitoring analyses of T and DHT using APPI (A and B) or ESI (C and D), respectively (cps = counts per second).
Application to prostate tissue
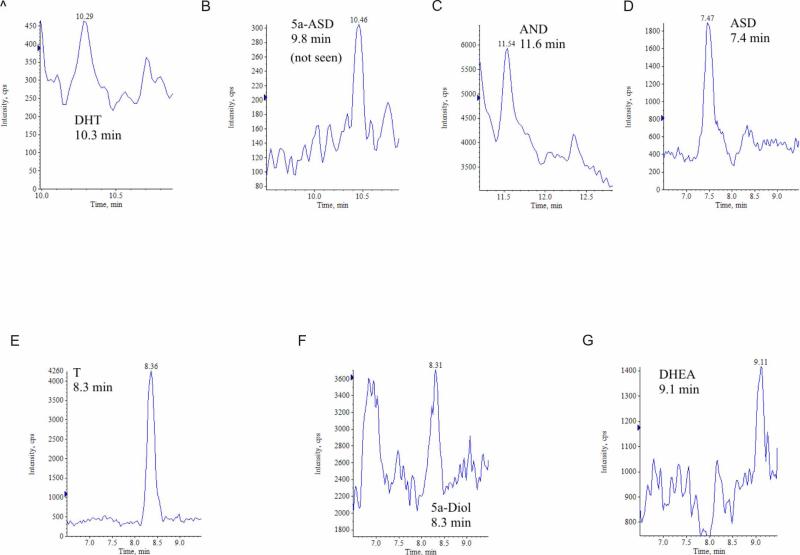
Comparative data was also obtained from human clinical samples (Table 2). Chromatograms representative of the APPI results are shown in Fig. 6A-G. The SRM spectrum for quantitation of the DHT level in a tissue sample (Fig. 6A) showed that DHT can be detected at ng/g concentrations in 50mg recurrent CaP tissue. These results are consistent with the results previously reported for T and DHT.7 Additionally, quantifiable levels of ASD, DHEA and AND were observed in CaP tissue. These androgens are potential additional sources of DHT in recurrent CaP.
Figure 6.
Analyses of seven androgens in a recurrent CaP tissue using APPI and selected reaction monitoring: A) ASD, 7.4 minutes, B) T, 8.3 minutes, C) AND, 11.6 minutes, D) DHEA, 9.1 minutes, E) 5α-ASD, 9.8 minutes, F) DHT, 10.29 minutes, and G) 5α-diol, 8.31 minutes.
Despite the increased relative sensitivity for DHT by ESI, The d3-DHT internal standard was subject to interference in the ESI analysis of human prostate peripheral and transition zone isolates (Fig. 7A), such that subtraction of the larger background ion gave an artifactually lower d3-DHT abundance. This resulted in elevated calculated concentrations of DHT. The APPI analysis was not subject to this interference (Fig 7B).
Figure 7.
Interference in the selected reaction monitoring of d3-DHT prevented quantitation from the electrospray ionization results. Interference was not a problem with photoionization.
Conclusions
An LC/APPI/MS/MS method for the separation and quantitative analysis of seven androgens of interest for recurrent CaP research was developed and compared to an LC/ESI/MS/MS approach. Identification of a novel keto-derivative formed via a loss of water from a hemiketal formed during the APPI process led to improved LC/APPI/MS/MS sensitivity for the saturated keto-androgens DHT and 5α-ASD, which are important in prostate tissue androgen intracrine metabolism.
Formation of the keto derivative was also observed to a lesser extent during ESI analysis of keto-steroids either dissolved in methanol or when methanol was used as a component of the LC solvent. The formation of this derivative may give rise to reduced signal intensities in quantitative analyses based on the expected [M + H]+ ion, and may also explain some mass spectral peaks unaccounted for in previously obtained spectra. The APPI method offers advantages in specificity and limits of quantitation over methods using RIA, GC/MS, & LC/ESI/MS/MS.
Supplementary Material
Supplemental
Figure S1. Extracted ion chromatograms of the [M + H]+ ions of 2 ng injections of T obtained under A) APPI conditions and B) ESI conditions; and of DHT obtained under C) APPI conditions and D) ESI conditions.
Figure S2. APPI spectra of A) 5α-cholestan-3-one and B) 5β-cholestan-3-one. Both species form the [M + CH3]+ parent ion but the less stable β species fragments to [M + CH3 – H3COH]+ in source.
Acknowledgements
This research was supported in part by the Intramural Research Program of the National Institute of Environmental Health Sciences/ National institutes of Health (z050167) and Grants PO1# NCI-CA-77739 To J.L.M. and CA016156 National Cancer Center Support Grant to Roswell Park Cancer Institute.
References
- 1.Jemal A, Siegel R, Ward E, Hao Y, Xu J, Thun MJ. CA Cancer J Clin. 2009;59:225–249. doi: 10.3322/caac.20006. [DOI] [PubMed] [Google Scholar]
- 2.Huggins C, Stevens RE, Hodges CV. Archives of Surgery. 1941;43:209–223. [Google Scholar]
- 3.Agoulnik IU, Weigel NL. J Cell Biochem. 2006;99:362–372. doi: 10.1002/jcb.20811. [DOI] [PubMed] [Google Scholar]
- 4.Mohler JL. Adv Exp Med Biol. 2008;617:223–234. doi: 10.1007/978-0-387-69080-3_21. [DOI] [PubMed] [Google Scholar]
- 5.Mohler JL, Gregory CW, Ford OH, 3rd, Kim D, Weaver CM, Petrusz P, Wilson EM, French FS. Clin Cancer Res. 2004;10:440–448. doi: 10.1158/1078-0432.ccr-1146-03. [DOI] [PubMed] [Google Scholar]
- 6.Hsing AW, Stanczyk FZ, Belanger A, Schroeder P, Chang L, Falk RT, Fears TR. Cancer Epidemiol Biomarkers Prev. 2007;16:1004–1008. doi: 10.1158/1055-9965.EPI-06-0792. [DOI] [PubMed] [Google Scholar]
- 7.Titus MA, Schell MJ, Lih FB, Tomer KB, Mohler JL. Clin Cancer Res. 2005;11:4653–4657. doi: 10.1158/1078-0432.CCR-05-0525. [DOI] [PubMed] [Google Scholar]
- 8.Hamdy FC, Roupret M. Prog Urol. 2008;18(Suppl 3):S40–43. doi: 10.1016/S1166-7087(08)70512-8. [DOI] [PubMed] [Google Scholar]
- 9.Kaplan SA, Roehrborn CG, Meehan AG, Liu KS, Carides AD, Binkowitz BS, Heyden NL, Vaughan ED., Jr. Urology. 2009;73:935–939. doi: 10.1016/j.urology.2008.09.079. [DOI] [PubMed] [Google Scholar]
- 10.Keam SJ, Scott LJ. Drugs. 2008;68:463–485. doi: 10.2165/00003495-200868040-00008. [DOI] [PubMed] [Google Scholar]
- 11.Musquera M, Fleshner NE, Finelli A, Zlotta AR. Expert Rev Anticancer Ther. 2008;8:1073–1079. doi: 10.1586/14737140.8.7.1073. [DOI] [PubMed] [Google Scholar]
- 12.Sarvis JA, Thompson IM. Curr Oncol Rep. 2008;10:529–532. doi: 10.1007/s11912-008-0080-1. [DOI] [PubMed] [Google Scholar]
- 13.Shah SK, Trump DL, Sartor O, Tan W, Wilding GE, Mohler JL. J Urol. 2009;181:621–626. doi: 10.1016/j.juro.2008.10.014. [DOI] [PMC free article] [PubMed] [Google Scholar]
- 14.Attard G, Reid AHM, Yap TA, Raynaud F, Dowsett M, Settatree S, Barrett M, Parker C, Martins V, Folkerd E, Clark J, Cooper CS, Kaye SB, Dearnaley D, Lee G, de Bono JS. Journal of Clinical Oncology. 2008;26:4563–4571. doi: 10.1200/JCO.2007.15.9749. [DOI] [PubMed] [Google Scholar]
- 15.Handratta VD, Jelovac D, Long BJ, Kataria R, Nnane IP, Njar VCO, Brodie AMH. Journal of Steroid Biochemistry and Molecular Biology. 2004;92:155–165. doi: 10.1016/j.jsbmb.2004.07.006. [DOI] [PubMed] [Google Scholar]
- 16.Zhao M, Baker SD, Yan XH, Zhao YY, Wright WW, Zirkin BR, Jarow JP. Steroids. 2004;69:721–726. doi: 10.1016/j.steroids.2004.05.020. [DOI] [PubMed] [Google Scholar]
- 17.Hakala KS, Laitinen L, Kaukonen AM, Hirvonen J, Kostiainen R, Kotiaho T. Analytical Chemistry. 2003;75:5969–5977. doi: 10.1021/ac034679b. [DOI] [PubMed] [Google Scholar]
- 18.Hanold KA, Fischer SM, Cormia PH, Miller CE, Syage JA. Analytical Chemistry. 2004;76:2842–2851. doi: 10.1021/ac035442i. [DOI] [PubMed] [Google Scholar]
- 19.Robb DB, Covey TR, Bruins AP. Analytical Chemistry. 2000;72:3653–3659. doi: 10.1021/ac0001636. [DOI] [PubMed] [Google Scholar]
- 20.Raffaelli A, Saba A. Mass Spectrometry Reviews. 2003;22:318–331. doi: 10.1002/mas.10060. [DOI] [PubMed] [Google Scholar]
- 21.Guo TD, Chan M, Soldin SJ. Archives of Pathology & Laboratory Medicine. 2004;128:469–475. doi: 10.5858/2004-128-469-SPULCM. [DOI] [PubMed] [Google Scholar]
- 22.Guo TD, Taylor RL, Singh RJ, Soldin SJ. Clinica Chimica Acta. 2006;372:76–82. doi: 10.1016/j.cca.2006.03.034. [DOI] [PubMed] [Google Scholar]
- 23.Zhang F, Bartels MJ, Geter DR, Carr MS, McClymount LE, Marino TA, Klecka GM. Rapid Communications in Mass Spectrometry. 2009;23:3637–3646. doi: 10.1002/rcm.4298. [DOI] [PubMed] [Google Scholar]
- 24.Yamamoto A, Kakutani N, Yamamoto K, Kamiura T, Miyakoda H. Environmental Science & Technology. 2006;40:4132–4137. doi: 10.1021/es052593p. [DOI] [PubMed] [Google Scholar]
- 25.Guo TD, Chan M, Soldin SJ. Archives of Pathology & Laboratory Medicine. 2004;128:469–472. doi: 10.5858/2004-128-469-SPULCM. [DOI] [PubMed] [Google Scholar]
- 26.Mascher HJ, Zech K, Mascher DG. Journal of Chromatography B-Analytical Technologies in the Biomedical and Life Sciences. 2008;869:84–92. doi: 10.1016/j.jchromb.2008.05.015. [DOI] [PubMed] [Google Scholar]
- 27.Soldin OP, Guo TD, Weiderpass E, Tractenberg RE, Hilakivi-Clarke L, Soldin SJ. Fertility and Sterility. 2005;84:701–710. doi: 10.1016/j.fertnstert.2005.02.045. [DOI] [PMC free article] [PubMed] [Google Scholar]
- 28.Hommerson P, Khan AM, de Jong GJ, Somsen GW. Journal of Chromatography A. 2008;1204:197–203. doi: 10.1016/j.chroma.2008.04.017. [DOI] [PubMed] [Google Scholar]
Associated Data
This section collects any data citations, data availability statements, or supplementary materials included in this article.
Supplementary Materials
Supplemental
Figure S1. Extracted ion chromatograms of the [M + H]+ ions of 2 ng injections of T obtained under A) APPI conditions and B) ESI conditions; and of DHT obtained under C) APPI conditions and D) ESI conditions.
Figure S2. APPI spectra of A) 5α-cholestan-3-one and B) 5β-cholestan-3-one. Both species form the [M + CH3]+ parent ion but the less stable β species fragments to [M + CH3 – H3COH]+ in source.


