Abstract
Optic neuropathy is the leading cause of irreversible blindness, and a paradigm for central nervous system axonal disease. The primary event is damage to retinal ganglion cell axons, with subsequent death of the cell body by apoptosis. Trials of neuroprotection for these and other neuronal diseases have mostly failed, primarily because mechanisms of neuroprotection in animals do not necessarily translate to humans. We developed a methodology for imaging an intracellular transduction pathway that signals neuronal death in the living animal. Using longitudinal confocal scanning multilaser ophthalmoscopy, we identified the production of superoxide within retrograde-labelled rat retinal ganglion cells after optic nerve transection. Superoxide was visualized by real-time imaging of its reaction product with intravitreally administered hydroethidine and confirmed by differential spectroscopy of the specific product 2-hydroxyethidium. Retinal ganglion cell superoxide increased within 24 h after axotomy, peaking at 4 days, and was not observed in contralateral untransected eyes. The superoxide signal preceded phosphatidylserine externalization, indicating that superoxide generation was an early event and preceded apoptosis. Intravitreal pegylated superoxide dismutase blocked superoxide generation after axotomy and delayed retinal ganglion cell death. Together, these results are consistent with superoxide being an upstream signal for retinal ganglion cell apoptosis after optic nerve injury. Early detection of axonal injury with superoxide could serve as a predictive biomarker for patients with optic neuropathy.
Keywords: retinal ganglion cells, axonal injury, superoxide, optic neuropathy, intracellular signalling
Introduction
Optic neuropathy, a primary axonal disease of the CNS, is the leading cause of irreversible visual loss. Neuroprotection trials in optic neuropathy have in general failed to show efficacy, as they have also failed in neurological disease (reviewed in Danesh-Meyer and Levin, 2009). Explanations for this failure to translate successful animal studies to clinical trials are multiple, but a critical element is the difficulty in proving that the mechanism of action in the patient corresponds to that seen in the laboratory.
In order to develop a method for studying mechanism of action for neuroprotective therapies in the human, we studied signal transduction events after optic nerve injury. The initial insult in most optic nerve diseases is injury to the retinal ganglion cell (RGC) axon followed by RGC apoptosis days to weeks later (Berkelaar et al., 1994; Garcia-Valenzuela et al., 1994; Rehen and Linden, 1994; Quigley et al., 1995). A critical molecular event underlying RGC death after axonal injury is generation of an intracellular superoxide burst (Geiger et al., 2002; Lieven et al., 2003, 2006; Nguyen et al., 2003; Swanson et al., 2005). We hypothesized that this superoxide signal can serve as a pre-apoptotic biomarker for in vivo imaging. Cordeiro and colleagues (2004) demonstrated that RGC apoptosis could be imaged in the living eye by confocal scanning laser ophthalmoscopy (CSLO) and followed sequentially (Cordeiro et al., 2010), making possible the assessment of neuroprotective therapies at the single cell level. To define the role of superoxide signalling in axonal injury precisely, we took advantage of a multilaser CSLO, adapting it for confocal scanning laser imaging for use in vivo in the rat eye. To test whether superoxide production is a useful biomarker, i.e. is intrinsic to the cell death program, we studied whether expression of markers of apoptosis precede or follow superoxide production in RGCs after axotomy, and whether down-regulation of superoxide levels prevents RGC death.
Materials and methods
Materials
Hydroethidine (dihydroethidium; HEt) was from BioChemika. Menadione and polyethylene glycol conjugated to superoxide dismutase from bovine erythrocytes (PEG-SOD) were from Sigma-Aldrich. 1,1′-Dioctadecyl-3,3,3′,3′-tetramethylindotricarbocyanine iodide [DiR; DiIC18(7)], Alexa Fluor 488-dextran, Alexa Fluor 488-annexin V, 4-amino-5-methylamino-2′,7′-difluorofluorescein (DAF-FM) diacetate and salmon sperm DNA were from Invitrogen. Xanthine and xanthine oxidase were from Roche. Human erythrocyte catalase (>50 000 U/mg protein; ≥95% by sodium dodecyl sulfate polyacrylamide gel electrophoresis) was from EMD Chemicals (Gibbstown, NJ). Rhodamine-conjugated Griffonia simplicifolia lectin I (GSL-I) was from Vector Laboratories (Burlingame, CA). RGC-5 cells were a generous gift of Neeraj Agarwal, PhD.
Optic nerve transection
Animal experiments were approved by the Maisonneuve-Rosemont Hospital Research Centre Animal Care Committee. Female Long-Evans rats weighing 225–250 g were from Charles River, Canada. Intrameningeal optic nerve transection was performed as described previously (Kanamori et al., in press) under ketamine (50 mg/kg)/xylazine (100 mg/kg) anaesthesia on the right eye, with the untransected left eye serving as a control. Preservation of the retinal circulation was confirmed by indirect ophthalmoscopy. Animals with cataract or corneal problems that precluded imaging were not used further.
Intravitreal injections
Intravitreal injections were performed as described previously (Kanamori et al., in press). Injections were made immediately posterior to the superotemporal limbus using a 32 gauge needle attached to a 10 µl Hamilton syringe (Hamilton, Reno, NV). HEt, DAF-FM, Alexa Fluor annexin V or PEG-SOD (4 µl) was slowly injected through the sclera at a 45° angle. This route of administration avoided retinal detachment or injury to the lens. Assuming the vitreous volume of an adult rat eye to be ∼56 µl (Berkowitz et al., 1998), the final intravitreal concentration of HEt and DAF-FM was ∼100 µM (Table 1). Erythromycin ophthalmic ointment was applied to the globe after injection. To avoid the possibility that the intravitreal injection itself might cause transient retinal cellular injury, the counting of positive cells on CSLO was always performed at least one day after intravitreal injection of fluorescent dyes.
Table 1.
Dyes used in experiments
| Name | Experiments | Volume | Administration | Final concentration | Source | Catalog no. |
|---|---|---|---|---|---|---|
| HEt | In vivo | 4 µl | Intravitreal | 100 µM | BioChemika | 37291 |
| Cell free assays | NA | Culture media | 100 µM | |||
| RGC-5 assays | NA | Culture media | 5 µM | |||
| Alexa Fluor 488-annexin V conjugate | In vivo | 4 µl | Intravitreal | (See note) | Invitrogen | A13201 |
| DAF-FM diacetate | In vivo | 4 µl | Intravitreal | 100 µM | Invitrogen | D23844 |
| Alexa Fluor 488-dextran conjugate | In vivo | 2.8 µl | Superior colliculi | 20 mg/ml | Invitrogen | D22910 |
| DiR | In vivo | 2.8 µl | Superior colliculi | 20 mg/ml | Invitrogen | D12731 |
The manufacturer of the AlexaFluor 488-annexin V conjugate does not provide its concentration in the solution sold. It was used undiluted from the purchased product.
Confocal scanning laser ophthalmoscopy
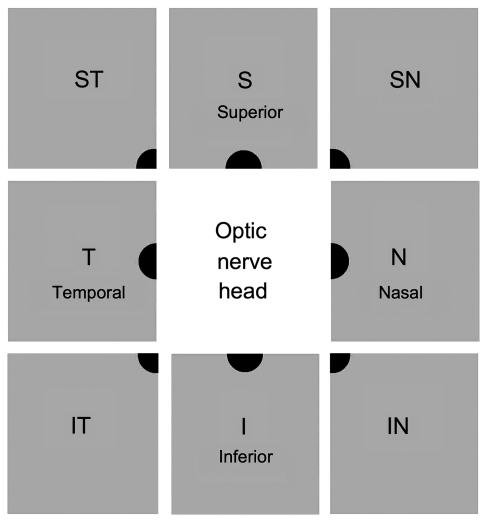
A commercially available Heidelberg Retinal Angiogram 2 (Heidelberg Engineering, Germany) was modified by the addition of an animal imaging platform based on an optic bench (Thorlabs, Newton, NJ) and the ability to add extra filters (see below). Two built-in lasers were utilized. The 488 nm laser was used for excitation of the hydroethidine-superoxide product 2-hydroxyethidium (OH-Et), Alexa Fluor 488-annexin V, Alexa Fluor 488-dextran and reflection mode imaging of the nerve fibre layer. The 788 nm laser was used for excitation of DiR (excitation 745 nm, emission 780 nm). Retinal imaging by CSLO was performed under ketamine/xylazine anaesthesia. Pupils were dilated with phenylephrine and atropine. Corneal hydration was maintained throughout the imaging procedure with balanced salt solution. Retinal images were obtained using a 30° field of view and real time averaging of at least 50 images on the CSLO at 93% sensitivity. Depending on the dye, either the medium wavelength channel (excitation with the 488 nm laser and detection from 500 to 650 nm) or long wavelength channel (excitation with the 788 nm laser and detection from 800 to 900 nm) was used. The plane of focus was adjusted to the inner retina by imaging the nerve fibre layer at 488 nm through the CSLO polarization filter (‘red-free imaging’). To examine the time course of OH-Et or annexin V appearance, images of eight retinal quadrants immediately adjacent to the optic nerve head were obtained for each session, and positive cells counted (Fig. 1).
Figure 1.
Schematic drawing of the topography of retinal imaging by CSLO. To quantify the number of cells positive for various fluorophores (e.g. OH-Et and annexin V), eight images were taken at each retinal octant adjacent to the optic nerve head.
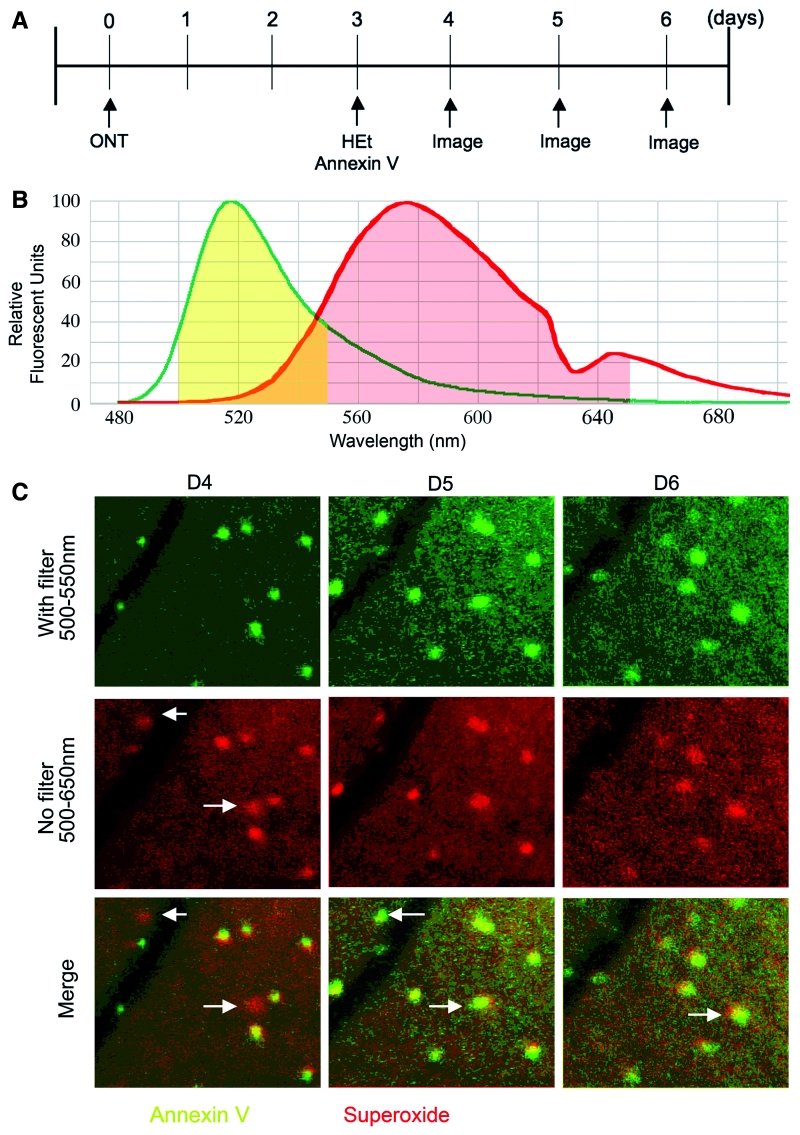
The emission peaks of OH-Et (567–586 nm) and Alexa Fluor 488 (517 nm) are both within the CSLO emission bandpass range (500–650 nm). To distinguish the two fluorophores when imaging retinas containing both, a short-pass filter (550 nm; Asahi Spectra USA) was placed in front of the CSLO optical module. This filter blocked the emission from OH-Et but not annexin V emission or the laser excitation (488 nm). Imaging was performed with and without this filter. The two images were then pseudocoloured green (500–550 nm) and red (500–650 nm), respectively, and merged. In the merged image, yellow indicates annexin V-positivity and red OH-Et positivity.
Retrograde labelling and quantification of retinal ganglion cells
RGCs were retrogradely labelled by stereotactic injection of Alexa Fluor 488 dextran or DiR into the superior colliculi. Briefly, rats were placed in a stereotactic apparatus (Narishige Co. Ltd., Tokyo, Japan), and the skin of the skull incised. The brain surface was exposed by drilling the parietal bone to facilitate dye injection. Fluorescent dye (Alexa Fluor 488-dextran or DiR) at a concentration of 20 mg/ml and 2.8 µl volume in total (Table 1) was injected bilaterally at 5.5 and 6.5 mm caudal to bregma and 1.2 and 2.2 mm lateral to the midline to a depth of 4.5 and 5.5 mm from the skull surface. To quantify the reduction in RGC number after optic nerve transection, retinas labelled by Alexa Fluor 488-dextran were imaged with the medium wavelength CSLO filters. Alexa Fluor 488-dextran was chosen because it is less likely to be phagocytosed by microglia than other retrograde dyes (Kanamori et al., in press). Images of the four retinal quadrants immediately adjacent to the optic nerve head were obtained for each session. In order to image the same area of retina at subsequent sessions, we counted RGCs within an area delineated by identifiable retinal vessels. At least 100 labelled cells in each area of each image were manually counted by an investigator masked to transection and treatment status. The number of labelled RGCs in the selected retinal area after transection was compared to the number of labelled cells in the corresponding area before optic nerve transection.
Registration of images acquired in vivo
The angle and size of images changed when they were continuously acquired using real-time signal averaging because of small movements due to respiration. To merge images acquired with two different dyes, Photoshop CS3 (Adobe) was used. One image was converted to green and the other image to red after despeckling and adjusting brightness and contrast. These pseudocoloured images were exported into the respective green and red channels of a new image in which the blue channel was set to black. Using free transform mode, the angle and size of the image in the red channel was adjusted to the image in green channel so as to overlap the retinal vessels. Colocalized positive cells would therefore be yellow in the merged image. It was impossible to merge two images perfectly because of nonlinearities in the optics of the rat eye, especially in the peripheral retina.
Histology
Retinas were removed immediately after euthanasia and fixed in 4% paraformaldehyde for 20 min, washed, flat mounted on glass slides and observed by epifluorescence microscopy (Zeiss Axio Observer.A1). To distinguish the oxidation products of HEt (Robinson et al., 2006), 395 ± 5.5 nm excitation, 500 nm dichroic and 562 ± 20 nm emission filters were used for OH-Et; and a 560 ± 20 nm excitation, 595 nm dichroic and 630 ± 30 nm emission filters for ethidium/OH-Et. Correlation of the ethidium/OH-Et signal from RGCs imaged by CSLO (with 488 nm excitation) and that from RGCs imaged on whole mounts (395 nm excitation for OH-Et; and 560 nm excitation for ethidium/OH-Et) was done by registration of the adjoining retinal vasculature. RGCs retrogradely labelled with DiR and previously imaged by CSLO were imaged in whole mounts using 730 ± 15 nm excitation, 770 nm dichroic and 800 ± 20 nm emission filters.
To verify the ability of intravitreally administrated PEG-SOD to distribute in RGCs, retinal cryosections from injected eyes were stained for SOD-1. Briefly, the corneas and lenses were removed from enucleated eyes one day after injection and then fixed for 30 min in 4% paraformaldehyde. Following fixation, the eyes were cryopreserved with increasing concentrations of sucrose and frozen in a 1:2 mixture of Tissue-Tek O.C.T. (Sakura, Finetake, CA) and 20% sucrose. Retinal cryosections (8 µm) were immunostained with rabbit SOD-1 antibody (1:200; Stressgen, Ann Arbor, MI) followed by Alexa Fluor 488 goat anti-rabbit immunoglobulin G (1:200; Invitrogen), and examined by epifluorescence microscopy.
To examine spatial relationships between microglia and superoxide, retinas were incubated with HEt and then stained with rhodamine-labelled GSL-I. HEt was intravitreally injected 3 days after optic nerve transection in three rats. The next day, the retinas were rapidly removed in situ, fixed in 4% paraformaldehyde, washed in phosphate buffered saline, and permeabilized in 0.2% Triton X-100 for 15 min. After another phosphate buffered saline wash, the retinas were stained with GSL-I (1:200) for 2 h to label microglia.
Cell culture
RGC-5 cells were cultured in Dulbecco’s minimal essential medium containing 1 g/l glucose, 10% foetal bovine serum, 100 U/ml penicillin and 100 µg/ml streptomycin. Cells were split every 48–72 h when ∼60–75% confluent, replated at a 1:20 dilution in a 25 cm2 flask in 5 ml of cell culture media and incubated at 37°C in humidified 5% CO2. For experiments, cells were seeded onto 24-well tissue culture-treated microplates and pre-incubated for 24 h in 500 µl media with serum before treatment with menadione or H2O2.
Statistics
Results are presented as mean ± standard error of the mean (SEM). Unpaired t-tests were used for comparisons between two groups and ANOVA followed by Tukey–Kramer test for multiple group comparisons. P < 0.05 was considered statistically significant.
Results
Optic nerve transection induces superoxide production in retinal cells in vivo
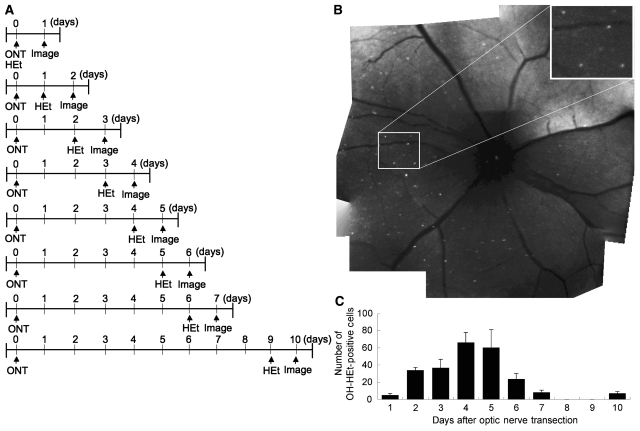
Optic nerve transection followed by intravitreal HEt (100 µM) produced fluorescent cells visible by CSLO starting 24 h after transection. These cells could be localized to the ganglion cell layer by confocal focusing on the innermost retina, with no fluorescence in the outer retina or in untransected eyes. To quantify the time course of generation of fluorescent cells, positive cells from the optic nerve head to the mid-periphery were counted in defined locations (Fig. 1) at varying times after optic nerve transection in independent groups of rats (n = 4–8). HEt was injected one day before imaging sessions. The number of positive cells increased rapidly after injection, reached a maximum of 66.2 ± 11.7 cells/field (n = 8) at 4 days after transection, and then decreased by 6 days to 23.8 ± 6.3 cells/field (n = 4) (Fig. 2).
Figure 2.
Optic nerve transection results in the appearance of OH-Et-positive cells within the retina when imaged in vivo by CSLO. (A) Flowchart of experiments. (B) An overview of OH-Et—positive cells was composed from a montage of nine CSLO images. (C) The time course of OH-Et positivity by CSLO after optic nerve transection. The positivity of OH-Et reached a maximum at 4 days. ONT = optic nerve transection.
To detect the generation of nitric oxide after axotomy, DAF-FM was intravitreally injected one day after transection and longitudinal imaging performed for up to 10 days. Although vascular endothelial cells were strongly labelled with DAF-FM, there was no signal elsewhere in the retina.
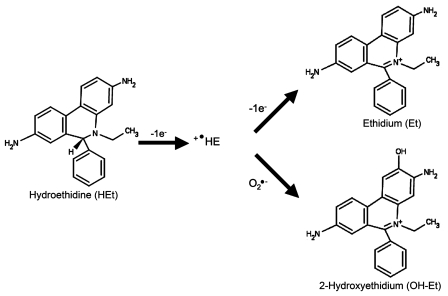
Three different approaches were taken to determine whether fluorescence after optic nerve transection and intravitreal injection of HEt reflected the generation of 2-hydroxyethidium (OH-Et, the product of HEt with superoxide; Fig. 3) or ethidium (the oxidation product of HEt). First, the relative specificity of the CSLO filter set for OH-Et versus ethidium was measured. HEt was incubated in a cell-free system either with superoxide/H2O2 generated from xanthine/xanthine-oxidase (X/XO) or with H2O2 (Robinson et al., 2006). Salmon sperm DNA was added in order to simulate the intracellular environment, where binding of OH-Et or ethidium to nuclear DNA increases the intensity of the signal and shifts the emission spectrum. CSLO images of 50 µl volumes of 100 µM HEt in the absence or presence of 1 mg/ml salmon sperm DNA were taken at 0, 15, 30 and 45 min, after adding either 1 mM xanthine and 0.05 U/ml xanthine oxidase (X/XO) or 9.8 mM H2O2. The fluorescence intensity was calculated from digitized images with ImageJ. In the presence of HEt and DNA, superoxide produced by X/XO rapidly increased the signal measured by CSLO in a cell-free system (Fig. 4). The CSLO was substantially more sensitive to HEt reacting with X/XO than with H2O2. The burst of reacted HEt reached a plateau at 30 min. Without added DNA, there was minimal signal produced from HEt reacting with either superoxide or H2O2. Furthermore, there was no effect of catalase on the OH-Et signal generated by the reaction of HEt and X/XO (data not shown). Because X/XO generates both superoxide and H2O2, these results imply that CSLO detection is substantially more sensitive to the OH-Et reaction product than the ethidium reaction product.
Figure 3.
Oxidation products of hydroethidine.
Figure 4.
Detection of oxidation products of HEt by CSLO. HEt was incubated in microfuge tubes with X/XO or hydrogen peroxide in the presence or absence of DNA. (A) Images of tubes on CSLO. (B) Rapid increase of fluorescence when HEt was incubated with X/XO (squares) and DNA (solid symbols). In contrast, HEt incubated with hydrogen peroxide (circles) with or without (open symbols) DNA resulted in minimal increase in fluorescence.
The second approach to confirm that fluorescence in cells imaged in vivo after HEt injection was generated from superoxide used PEG-SOD, which is cell-permeable and dismutates superoxide. PEG-SOD (20 U/ml final concentration) and HEt were intravitreally injected 3 days after optic nerve transection. Positive cells were counted the next day. PEG-SOD significantly decreased the number of OH-Et positive cells/field (5.5 ± 5.7 versus 66.2 ± 11.7 in eyes without PEG-SOD; n = 8; P < 0.001), consistent with the fluorescence indicating the presence of superoxide. The concentration of PEG alone was 100 times less than that previously shown to be neuroprotective (Koob and Borgens, 2006).
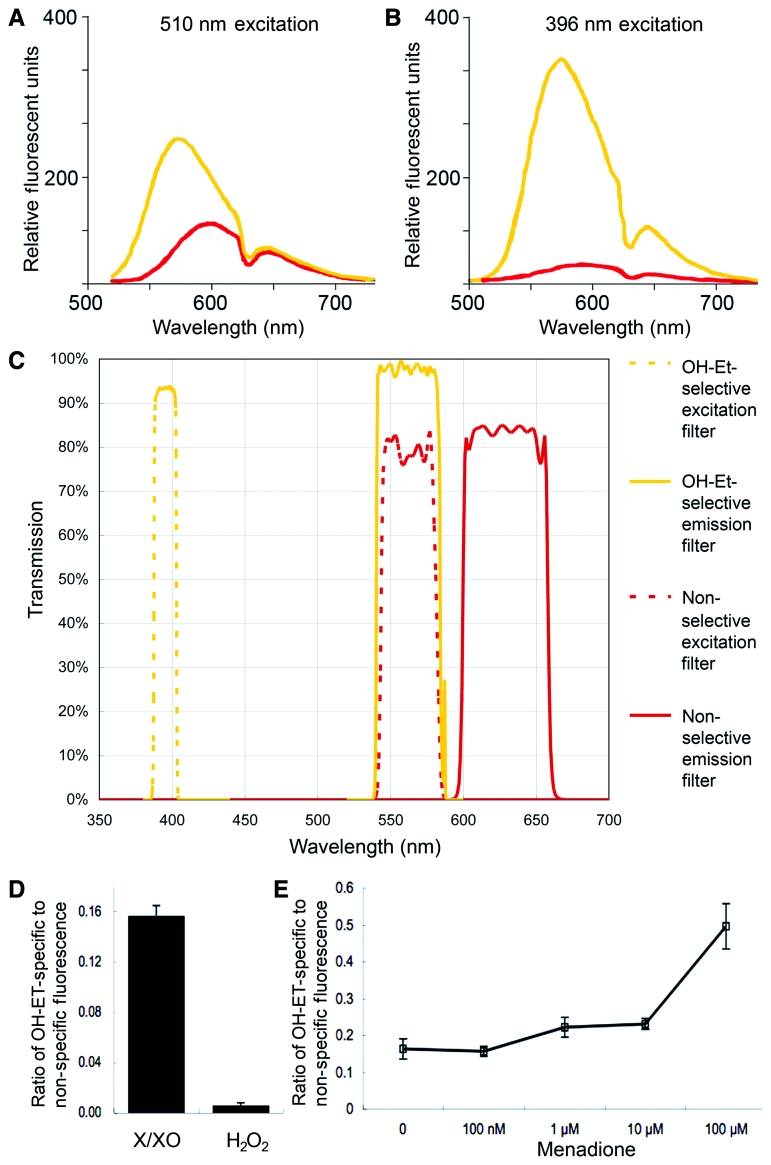
The third approach to assess the specificity of the CSLO for superoxide versus other reactive oxygen species in the retina correlated fluorescence of identified cells from CSLO imaging with subsequent fluorescent microscopy of whole mounts of the corresponding retina. The excitation spectra of OH-Et and ethidium are similar at medium wavelengths (540–580 nm) but differ at short wavelengths (370–400 nm). Cells that fluoresce when excited at ∼396 nm are OH-Et-positive, while cells fluorescing when excited at 560 nm could be either ethidium-positive or OH-Et-positive. Because the CSLO we used does not contain a laser that can be used to excite at short wavelengths, we instead performed fluorescence microscopy with short wavelength excitation of whole-mounted retinas that had previously been imaged by CSLO. By correlating the fluorescence of individual cells, we could determine whether cells that were fluorescent by CSLO were OH-Et-positive (Robinson et al., 2006).
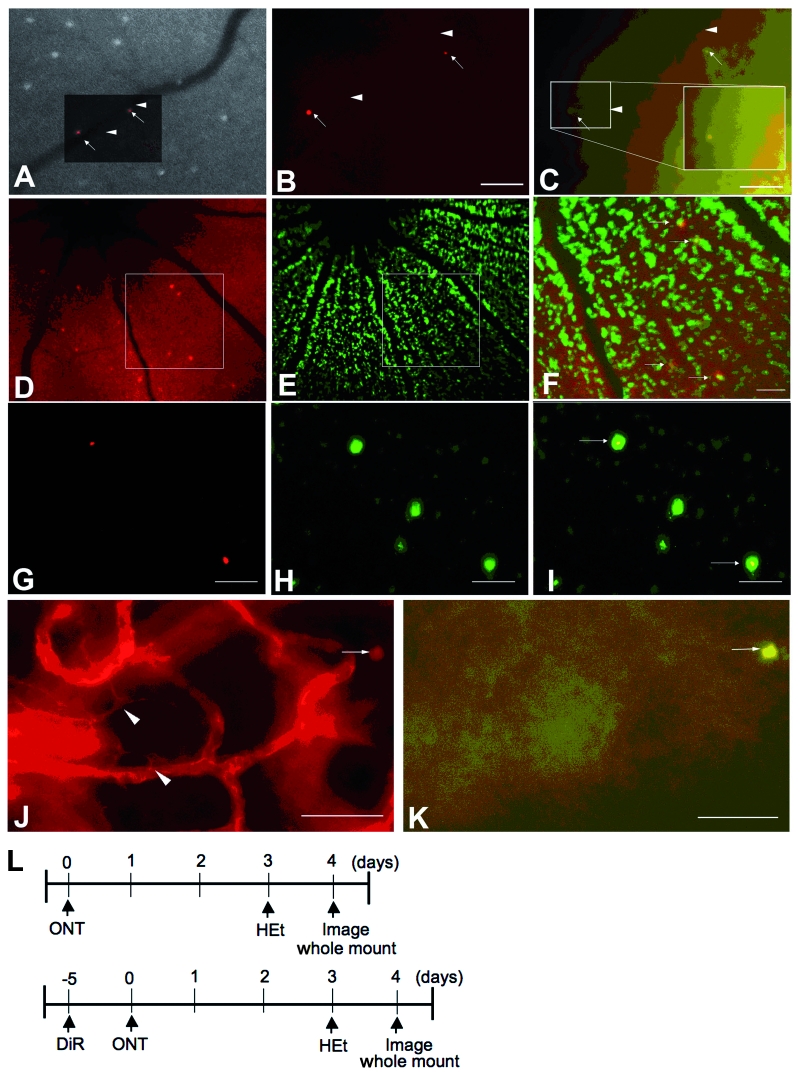
Fluorescent cells from retinal whole mounts studied with fluorescence microscopy colocalized with the corresponding cells on CSLO images (Fig. 5A–C). Superoxide-positive cells on the whole mount could be detected using a 395 ± 5.5 nm excitation filter to excite OH-Et specifically (Fig. 6A and B). A 560 ± 20 nm excitation filter was used for non-specific excitation of both ethidium and OH-Et. Fifty-nine of 80 (74%) cells that fluoresced when excited with the 560 nm filter also fluoresced when excited by the selective 395 nm filter, indicating that most cells positive by CSLO contained OH-Et, the reaction product of HEt and superoxide.
Figure 5.
Axotomized RGCs that are fluorescent by CSLO imaging of HEt contain OH-Et, the product of HEt and superoxide, based on anatomical correlation of in vivo and ex vivo images studied by fluorescence microscopy. (A) Overview of epifluorescence microscopy of a whole-mounted retina overlaid on the corresponding CSLO image. Arrows indicate fluorescent cells. Arrowheads indicate corresponding locations on the same vessel, used for registration of images. (B) Whole-mounted retina imaged by epifluorescence microscopy using 560 ± 20 nm excitation to detect both ethidium and OH-Et in axotomized RGCs (arrows). (C) Whole-mounted retina imaged by epifluorescence microscopy using 395 ± 5.5 nm excitation to detect OH-Et alone in axotomized RGCs (arrows). (D–I) Co-localization of OH-Et by CSLO in vivo (D–F) or by fluorescent microscopy in retinal whole mounts (G–I) with RGCs retrogradely labelled with DiR. D and G, OH-Et, pseudocoloured red. E and H, DiR, pseudocoloured green. (F) Merged image of the insets in D and E. (I) Merged image of G and H. Arrows indicate OH-Et located in RGCs. (J and K) Microglia stained with the rhodamine-conjugated GSL-I. (J) Microglia (arrowheads) with characteristic morphology can be detected using a non-selective filter set (560 ± 20 excitation, 630 ± 30 emission) that detects rhodamine-GSL-I, OH-Et and ethidium. The oxidative product of HEt (arrow) is present on this image but localizes out of the plane of focus. (K) OH-Et positivity detected with a selective filter set (395 ± 5.5 excitation, 562 ± 20 emission) in the same field as J. Microglia are not positive for OH-Et. Scale bar: 50 µm. (L) Flowchart of experiments for A–C, J and K (top). Flowchart of experiments for D–I (bottom). ONT = optic nerve transection.
Figure 6.
OH-Et can be detected by fluorescence microscopy. (A and B) The emission spectrum of OH-Et (yellow) and ethidium (red) excited at 510 nm (A) and 396 nm (B), redrawn from (Robinson et al., 2006). (A) When excited at 510 nm, ∼40% of OH-Et fluorescence overlaps with ethidium fluorescence. (B) When excited at 396 nm, only 10% of OH-Et fluorescence overlaps with ethidium fluorescence. (C) Spectral curves of OH-Et-selective filters (yellow) and non-selective filters (red). The latter do not distinguish the OH-Et signal from the ethidium signal. (D) Imaging the products of HEt oxidized by either X/XO or H2O2 on a microscope slide. The fluorescence intensity with the OH-Et-selective (395 ± 5.5 nm) excitation filter was compared to that with the non-selective 560 ± 20 nm excitation filter. The OH-Et-selective filter resulted in more fluorescence emission with the reaction products than did the non-selective filter. (E) RGC-5 cells treated with menadione, which produces superoxide by redox shuttling, were reacted with HEt. The OH-Et-specific excitation resulted in significant RGC-5 cell fluorescence when treated with menadione at 1 µM or higher concentrations.
To confirm that the fluorescent filters used for the retinal whole mounts were indeed selective for OH-Et, two procedures were carried out. The first was imaging the products of HEt oxidized by either X/XO or H2O2. The fluorescence intensity with the OH-Et-selective (395 ± 5.5 nm) excitation filter was compared with the non-selective 560 ± 20 nm excitation filter (Fig. 6C). The ratio of OH-Et-specific to non-specific fluorescence when HEt was oxidized by X/XO was 0.16 ± 0.01, compared to 0.01 ± 0.002 when oxidized by H2O2 (P < 0.001; Fig. 6D). Second, RGC-5 cells, a neuronal precursor cell line, were treated with menadione (100 nM to 100 µM), which generates intracellular superoxide by redox cycling (Nguyen et al., 2003), or H2O2 (9.8 mM) for 30 min. They were then incubated with HEt (5 µM) for 30 min. Three fields were imaged with both the OH-Et-selective and non-selective filter sets and the mean signal intensity of each cell calculated with ImageJ. RGC-5 cells treated with menadione at 1 µM or higher concentrations produced dramatically increased fluorescence above baseline with the OH-Et-selective filter set (Fig. 6E). These experiments confirmed that the OH-Et selective filters detect superoxide on retinal whole mounts.
Displaced amacrine cells make up a substantial proportion of the ganglion cell layer (Perry and Walker, 1980). To determine precisely the cellular compartment containing OH-Et positivity in the retina, RGCs were retrograde labelled bilaterally by injecting the infrared fluorescent dye DiR into both superior colliculi 5 days before transection of the right optic nerve. HEt was then intravitreally injected 3 days into both eyes after transection and the retinas imaged by CSLO the following day. OH-Et and DiR images were pseudocoloured red or green, respectively, and merged. Individual RGC somas with DiR fluorescence could be observed by CSLO (Fig. 5E). The colocalization of OH-Et positivity by CSLO with the RGC retrograde label (Fig. 5D–F) implies that superoxide was produced in RGCs. Because switching from the medium wavelength to long wavelength filters on the CSLO necessitated a change in focal length, which affects spatial localization, the colocalization of OH-Et and DiR was confirmed in retinal whole mounts (Fig. 5G–I). DiR colocalized with OH-Et positivity, manifested as nuclear red fluorescence, and indicative of superoxide generated in RGCs. Because activated microglia can also release reactive oxygen species (Dringen, 2005), whole mounts were stained for microglia with the lectin GSL-I conjugated to rhodamine. OH-Et positivity did not colocalize with GSL-I-positive microglia (Fig. 5J and K).
Apoptosis after optic nerve transection in vivo
Alexa Fluor 488-annexin V was used to visualize apoptotic cells by CSLO (Cordeiro et al., 2004). The number of annexin V-positive axotomized RGCs in vivo was counted in independent groups of animals at 4–10 days after optic nerve transection. Figure 7C demonstrates a composite image of the retina containing annexin V-positive cells 6 days after optic nerve transection. Fluorescence microscopy of whole mounts from previously CSLO-imaged retinas revealed dendrites and axons characteristic of RGCs (Sievers et al., 2003) in the annexin V-positive cells (Fig. 7D). Optic nerve transection induced a dramatic increase of annexin V-positive cells, peaking at 6 days after transection (570 ± 53.7 versus 28.8 ± 5.7 in untransected eyes; n = 4 and 6; P = 0.007) (Fig. 7B). The peak of apoptosis at 5–6 days after optic nerve transection is similar to previous findings (Cordeiro et al., 2004; Koeberle and Ball, 1998).
Figure 7.
Alexa Fluor 488-annexin V-positive retinal cells imaged in vivo by CSLO after optic nerve transection. (A) Flowchart of experiments. (B) The time course of annexin V positivity after optic nerve transection by CSLO. The annexin V positivity on CSLO peaked at 6 days after optic nerve transection. (C) An overview of retinal annexin V imaged using the composite mode of the CSLO. (D) Corresponding retinal area by fluorescent microscopy, corresponding to square in C. Annexin V-positive cells have dendrites and axons characteristic of RGCs. ONT = optic nerve transection. Scale bar: 20 µm.
Duration of 2-hydroxyethidium and annexin V positivity
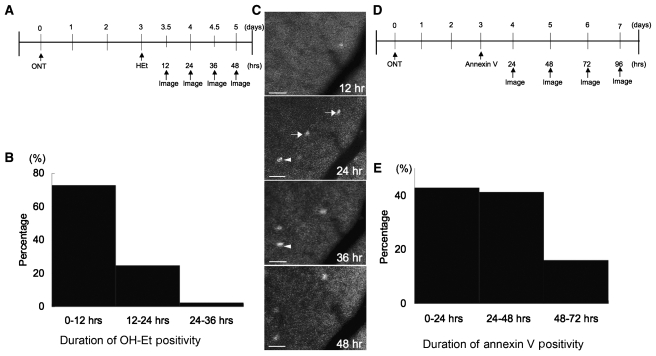
The kinetics of appearance and disappearance of the two markers, OH-Et for superoxide and annexin V for apoptosis, were studied. To assess the duration of OH-Et positivity in axotomized RGCs, longitudinal retinal CSLO imaging was performed every 12 h after the administration of HEt in three rats. Consecutive fields were registered, pseudocoloured and the timing of appearance and disappearance of OH-Et in single cells measured. In a total of 124 OH-Et-positive cells studied, 73% were negative at the next imaging session 12 h later (Fig. 8C, arrow), implying that the duration of superoxide in the cell was <12 h in these cells. Of the remaining 27% cells that were OH-Et-positive at 0 and 12 h (Fig. 8C, arrowhead), 25% were negative at 24 h, implying that the duration of superoxide in these cells was 12–24 h, and 2% were positive at 24 h but negative at 36 h, implying that superoxide was present for 24–36 h (Fig. 8B).
Figure 8.
The relative kinetics of appearance and disappearance of OH-Et or Alexa Fluor 488-annexin V in single cells after optic nerve transection. (A) Flowchart of experiments with HEt. (B) In a total of 124 OH-Et-positive cells studied, 73% were positive for <12 h (black), 27% for 12–24 h and 25% for 24–36 h. (C) Longitudinal retinal CSLO imaging was performed every 12 h after optic nerve transection in eyes following intravitreal injection of HEt. Arrows indicate OH-Et-positive cells that were negative at the next imaging session 12 h later, implying that the duration of superoxide in the cell was <12 h in these cells. The arrowhead indicates an OH-Et-positive cell that was subsequently negative at 24 h, implying that the duration of superoxide in this cell was 12-24 hours. (D) Flowchart of experiments with annexin V. (E) Longitudinal imaging of axotomized retinas in eyes with Alexa Fluor 488-annexin V was performed every 24 h. Of 250 annexin V-positive cells analysed, 43, 41 and 16% remained positive <24, 24–48 and 48–72 h, respectively. Scale bars: 20 µm. ONT = optic nerve transection.
Similar methods were used to assess the kinetics of annexin V after optic nerve transection. Longitudinal imaging of axotomized retinas in eyes injected with Alexa Fluor 488-annexin V was performed every 24 h. The duration of annexin V positivity after transection was measured in the same way as with OH-Et. Of 250 annexin V-positive cells analysed, 43, 41 and 16% remained positive <24, 24–48 and 48–72 h, respectively (Fig. 8E). These experiments revealed that annexin V remained positive in the same cell longer than did OH-Et. In addition, since the peak of OH-Et positivity (at 4 days) was earlier than the peak of annexin V positivity (at 6 days), this suggests that superoxide generation precedes apoptosis.
Superoxide generation precedes apoptosis in axotomized retinal ganglion cells in vivo
A second type of kinetic analysis was performed in order to clarify the relation between superoxide generation and RGC apoptosis after axotomy. Individual RGCs were double-labelled and longitudinally imaged. A 1:9 mixture of HEt and Alexa Fluor 488-annexin V was intravitreally injected (4 µl) at 3 days after optic nerve transection. Starting 4 days after transection, retinal CSLO imaging was performed daily with and without a short pass (550 nm) filter to distinguish the Alexa Fluor 488-annexin V signal from the OH-Et signal. Consecutive fields were aligned, pseudocoloured and the timing of appearance and disappearance of cells positive for OH-Et (red) or annexin V (yellow) measured (Fig. 9). Some cells that were OH-Et-positive at 4 days after transection became OH-Et-negative and annexin V-positive the next day. This pattern of OH-Et disappearance and annexin V appearance implies that a burst of superoxide preceded apoptosis in these cells. Longitudinal observation of two double-labelled retinas revealed that OH-Et positivity was followed by annexin V positivity 1, 2 or 3 days later in 37, 42 or 21% of the initially OH-Et positive cells. This implies that there is a 24–72 h lag between superoxide generation and apoptosis in axotomized RGCs.
Figure 9.
(A) Flowchart of experiments. (B) Spectral emission curves of Alexa Fluor 488-annexin V (green line) and OH-Et (red line; redrawn from Robinson et al., 2006). The yellow area represents that part of the spectrum passed by the 550 nm external short-pass filter and detected by the CSLO sensor (500–650 nm). The red area is the spectrum detected by the CSLO sensor without the short-pass filter. OH-Et fluorescence is therefore poorly detected, compared to Alexa Fluor 488-annexin V, when the 550 nm short-pass filter is used. These results were confirmed using rats injected with HEt alone. (C) Superoxide generation precedes RGC apoptosis after axotomy. RGCs were double-labelled for OH-Et and annexin V, and longitudinally imaged at 4, 5 and 6 days after axotomy. Retinal CSLO images were taken either with or without a short-pass (550 nm) filter, in order to distinguish the Alexa Fluor 488-annexin V emission from the OH-Et emission. With the short pass filter, only annexin V is detected (pseudocoloured green). Without the short pass filter, both annexin V and OH-Et are detected (pseudocoloured red). The merge indicates annexin V-positive cells as yellow and OH-Et-positive cells as red. On Day 4 after transection (D4) the cells indicated with the arrows were OH-Et-positive, and became annexin V-positive the next day (D5). At Day 6 after transection (D6), one cell became annexin V-negative, and the other remained annexin V-positive. ONT = optic nerve transection.
Superoxide is a signal for induction of retinal ganglion cells death after axotomy
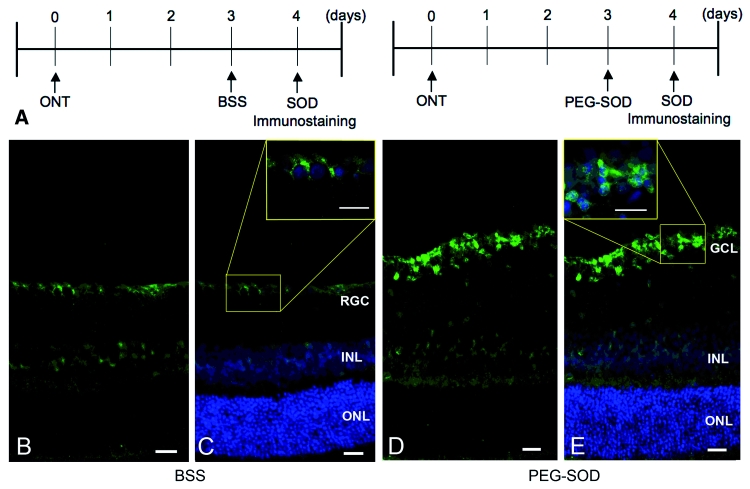
Superoxide generation in axotomized RGCs could be incidental to the axonal injury and not causal in the induction of apoptosis. To assess a functional role for superoxide in signalling axotomy-induced death, we examined the ability of PEG-SOD to decrease apoptosis after optic nerve transection in vivo. Intravitreally injected PEG-SOD (20 U/ml) enters RGC somas and can be detected as increased SOD-1 immunoreactivity (Fig. 10). PEG-SOD was intravitreally injected 3 days after optic nerve transection, followed by intravitreal Alexa Fluor 488-annexin V at 6 days after transection. Annexin V-positive cells were counted 24 h later. There were 109 ± 48 apoptotic cells in eyes injected with PEG-SOD 7 days after transection, compared to 492 ± 62 apoptotic cells in untreated transected eyes (n = 4; P = 0.02). This indicates that reduction of intracellular superoxide significantly decreases RGC apoptosis after axotomy.
Figure 10.
Cell-permeable pegylated superoxide dismutase (PEG-SOD) increases intracellular immunoreactivity for SOD-1. (A) Flowchart of experiments. (B and C) Retina one day after intravitreal injection of balanced salt solution had faint constitutive SOD-1 immunoreactivity in the ganglion cell layer. (D and E) Retina one day after intravitreal injection of PEG-SOD had strong SOD-1 immunoreactivity in the ganglion cell layer. C and E were merged with images containing 4′,6-diamidino-2-phenylindole counterstaining. ONL = outer nuclear layer; INL = inner nuclear layer; GCL = ganglion cell layer; ONT = optic nerve transection. Scale bars: 20 µm.
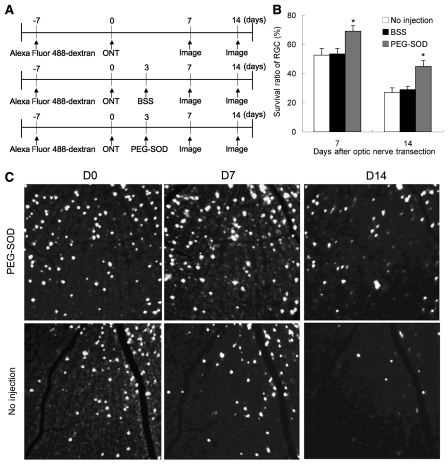
In vivo imaging allows serial quantification of actual RGC numbers over time, based on the ability to identify individual RGC somas retrogradely labelled with Alexa Fluor 488-dextran (Fig. 11). Relative numbers of fluorescent RGCs in defined areas of the retina were quantitated by serial imaging before and after optic nerve transection. There was a decrease in the number of RGCs at 7 and 14 days after optic nerve transection, respectively. Intravitreal PEG-SOD significantly preserved RGC viability (Fig. 11) at 7 and 14 days after transection, respectively.
Figure 11.
Cell-permeable pegylated superoxide dismutase (PEG-SOD) reduces RGC death after axotomy. RGCs previously retrograde labelled with Alexa Fluor 488-dextran were axotomized by optic nerve transection and longitudinally imaged in vivo. (A) Flowchart of experiments. (B) Survival ratio of RGCs after transection compared to that before transection in uninjected eyes (n = 7, white), eyes intravitreally injected with balanced salt solution (n = 8, black) and eyes injected with PEG-SOD (n = 7, grey). *P < 0.05. (C) Series of images of RGCs with Alexa Fluor 488-dextran. ONT = optic nerve transection; D = day.
Discussion
Confocal in vivo imaging of the retina in eyes with inherently transparent optical media is a powerful method for studying biological processes over time, and has the potential for detecting early events in cell injury that can serve as biomarkers for assessing disease progression and the effects of therapeutic intervention. These data demonstrate that axotomy induces a burst of intracellular superoxide in axotomized RGCs, beginning as early as 24 h after optic nerve transection and peaking at 4 days. Both on a population and single cell basis, this increase in superoxide occurs 24–48 h before apoptosis, as defined by the externalization of cell membrane phosphatidylserine. Finally, the increase in intracellular superoxide is a signal for apoptosis after axotomy, because superoxide scavenging with PEG-SOD both decreases superoxide levels in RGCs and delays their death after optic nerve transection. The use of a multilaser confocal ophthalmoscope allows simultaneous detection of cell signal transduction events and identification of cell type.
To our knowledge, this is the first report to demonstrate that intracellular superoxide can serve as a signal for neuronal cell death after axotomy in vivo. Our previous studies using in vitro preparations demonstrated an increase in superoxide after optic nerve crush within the first 24 h after plating and continuing up to 7 days (Lieven et al., 2006). These studies were confounded by the effects of retinal dissociation, which itself causes a proximal RGC axotomy. The present study shows that not only does superoxide production follow axotomy in vivo, but also that it precedes apoptosis, making it a potential upstream biomarker.
We used several methods to prove that we were imaging superoxide and not another reactive oxygen species. Although HEt is frequently used for imaging superoxide (Bindokas et al., 1996; Degli Esposti, 2002), it can be oxidized by reactive oxygen species other than superoxide, e.g. H2O2 and peroxynitrite (Zhao et al., 2003). Chemically or enzymatically generated superoxide reacts with HEt to form OH-Et, a fluorescent product that differs from ethidium, the two-electron oxidation product of HEt. OH-Et has a different molecular weight from ethidium, and this can be used as the basis for differentiation by high performance liquid chromatography (Zhao et al., 2005). However, RGCs make up only a small proportion of the retina, and rapidly separating the RGC HEt products from other cells is impractical. OH-Et has an emission maximum at 567 nm, whereas the emission maximum of ethidium is 610 nm. Unfortunately there is enough overlap in the emission fluorescence spectra of OH-Et and ethidium to blur their distinction when excited at the same wavelength. Instead, we took advantage of the recent observation that OH-Et has a distinct excitation wavelength spectrum centred around 396 nm that is not present in the other oxidation product of HEt (Robinson et al., 2006). We showed that OH-Et is produced by the reaction of HEt with superoxide, but not with H2O2. In vivo imaging by CSLO of animals followed by histological examination of corresponding retinal whole mounts using an excitation filter specific for OH-Et showed that the fluorescence of identified single cells on CSLO corresponded to the product of superoxide with HEt.
Other methods were used to show that the intracellular signal was superoxide. PEG-SOD specifically scavenges intracellular superoxide in vivo (Schlieve et al., 2006). The decrease in fluorescence after intravitreal HEt and PEG-SOD implies that most of the reactive oxygen species reacting with HEt is superoxide. These results are consistent with superoxide acting as an intracellular signalling molecule and initiating apoptosis, similar to what occurs in nerve growth factor-deprived neuronal cells (Greenlund et al., 1995; Kirkland et al., 2007). The rise in superoxide is unlikely to be a secondary effect of mitochondrial dysfunction signalled by axotomy, e.g. as a result of cytochrome c release (Cheung et al., 2003) or caspase activation (Ricci et al., 2003), because the superoxide burst precedes the apoptosis of axotomized RGCs at the single-cell level. This is more consistent with superoxide generation serving as a signal and not a result of apoptosis.
Activated microglia are potent sources of reactive oxygen species (Dringen, 2005). The peak activation of retinal microglia occurs 12 days after RGC axotomy, and therefore subsequent to the peak of RGC death (Garcia-Valenzuela et al., 1994, 2005; Sobrado-Calvo et al., 2007). However, it is possible that a small number of microglia could become activated early after axotomy, and even though we localized superoxide to retrogradely labelled RGCs, it was possible that adjacent microglia, or microglia that phagocytosed the retrograde label from apoptotic RGCs, could be the actual source. To address this possibility, we stained retinal whole mounts with the microglial marker GSL-I at 4 days after optic nerve transection, the peak of superoxide generation. Not only were there few microglia at that time point, but also they did not colocalize with OH-Et, indicating that microglia were not a significant source of superoxide.
Serial imaging by CSLO was used to analyse the kinetics of appearance and disappearance of retinal superoxide in single cells after optic nerve transection. Most cells remained OH-Et for <12 h, although it is possible that the actual time was less because corneal hazing precluded acquiring images at shorter intervals. A small proportion remained positive for up to 36 h, probably reflecting the persistence of OH-Et in the absence of superoxide. Annexin V-positive cells remained fluorescent for longer, consistent with the observations of Cordeiro and colleagues (2004). This difference in duration of fluorescence would account for the relatively smaller number of OH-Et-positive cells compared to annexin V-positive cells at any given time, consistent with superoxide generation leading to apoptosis in the majority of, if not all, RGCs. In addition, sensitivity limitations of the CSLO to low fluorescence levels would be likely to underestimate the total number of visible OH-Et-positive or annexin V-positive cells.
Mitochondria are a principal site for superoxide generation (Cadenas et al., 1977; Hoegger et al., 2008). Our previous in vitro studies using MitoSox Red and electron transport chain inhibitors demonstrated that the source of superoxide generation after RGC axotomy was probably mitochondrial (Lieven et al., 2006). We therefore speculate that mitochondria generate superoxide detected by in vivo imaging, but because OH-Et fluorescence is greatly amplified by binding to nuclear DNA and the resolution of the CSLO is only at the cellular level, we could not determine this. We used a single marker of apoptosis, externalization of phosphatidylserine, based on the findings of Cordeiro and colleagues (2004) that this accompanies caspase 3 activation in injured RGCs. A more proximal marker such as cytochrome c release could precede superoxide generation, although if that were true, then it would not explain the ability of intracellularly delivered SOD to prevent RGC death after axotomy.
In summary, optic nerve transection causes a burst of RGC-derived superoxide that can be assessed by real-time confocal imaging in living animals. Direct in vivo observations revealed that superoxide elevation precedes apoptosis in identified RGCs and scavenging of superoxide prevents RGC loss after optic nerve transection. These findings are consistent with an intracellular superoxide burst serving as a signal for apoptosis after axotomy in RGCs, and raises the possibility that early detection of axonal injury before apoptosis could be of clinical utility in patients with optic neuropathy.
Funding
This work was supported by grants to L.A.L. from Canadian Institutes for Health Research (MOP 84211), Canadian Foundation for Innovation, Canadian Research Chairs program, National Institutes of Health (grant number R21EY017970) and Fonds de recherche en ophtalmologie de l’Université de Montréal.
Acknowledgements
The authors thank Santiago Costantino, PhD for technical advice in imaging.
Glossary
Abbreviations
- CSLO
confocal scanning laser ophthalmoscopy
- DAF-FM
4-amino-5-methylamino-2′,7′-difluorofluorescein
- DiR
1,1′-dioctadecyl-3,3,3′,3′-tetramethylindotricarbocyanine iodide
- GSL-I
Griffonia simplicifolia lectin I
- HEt
hydroethidine
- OH-Et
2-hydroxyethidium
- PEG-SOD
polyethylene glycol conjugated to superoxide dismutase from bovine erythrocytes
- RGC
retinal ganglion cells
- X/XO
xanthine/xanthine-oxidase
References
- Berkelaar M, Clarke DB, Wang YC, Bray GM, Aguayo AJ. Axotomy results in delayed death and apoptosis of retinal ganglion cells in adult rats. J Neurosci. 1994;14:4368–74. doi: 10.1523/JNEUROSCI.14-07-04368.1994. [DOI] [PMC free article] [PubMed] [Google Scholar]
- Berkowitz BA, Lukaszew RA, Mullins CM, Penn JS. Impaired hyaloidal circulation function and uncoordinated ocular growth patterns in experimental retinopathy of prematurity. Invest Ophthalmol Vis Sci. 1998;39:391–6. [PubMed] [Google Scholar]
- Bindokas VP, Jordan J, Lee CC, Miller RJ. Superoxide production in rat hippocampal neurons: selective imaging with hydroethidine. J Neurosci. 1996;16:1324–36. doi: 10.1523/JNEUROSCI.16-04-01324.1996. [DOI] [PMC free article] [PubMed] [Google Scholar]
- Cadenas E, Boveris A, Ragan CI, Stoppani AO. Production of superoxide radicals and hydrogen peroxide by NADH-ubiquinone reductase and ubiquinol-cytochrome c reductase from beef-heart mitochondria. Arch Biochem Biophys. 1977;180:248–57. doi: 10.1016/0003-9861(77)90035-2. [DOI] [PubMed] [Google Scholar]
- Cheung ZH, Yip HK, Wu W, So KF. Axotomy induces cytochrome c release in retinal ganglion cells. Neuroreport. 2003;14:279–82. doi: 10.1097/00001756-200302100-00025. [DOI] [PubMed] [Google Scholar]
- Cordeiro MF, Guo L, Coxon KM, Duggan J, Nizari S, Normando EM, et al. Imaging multiple phases of neurodegeneration: a novel approach to assessing cell death in vivo. Cell Death Disease. 2010;1:e3. doi: 10.1038/cddis.2009.3. [DOI] [PMC free article] [PubMed] [Google Scholar]
- Cordeiro MF, Guo L, Luong V, Harding G, Wang W, Jones HE, et al. Real-time imaging of single nerve cell apoptosis in retinal neurodegeneration. Proc Natl Acad Sci USA. 2004;101:13352–6. doi: 10.1073/pnas.0405479101. [DOI] [PMC free article] [PubMed] [Google Scholar]
- Danesh-Meyer HV, Levin LA. Neuroprotection: extrapolating from neurologic diseases to the eye. Am J Ophthalmol. 2009;148:186–91. doi: 10.1016/j.ajo.2009.03.029. [DOI] [PubMed] [Google Scholar]
- Degli Esposti M. Measuring mitochondrial reactive oxygen species. Methods. 2002;26:335–40. doi: 10.1016/S1046-2023(02)00039-7. [DOI] [PubMed] [Google Scholar]
- Dringen R. Oxidative and antioxidative potential of brain microglial cells. Antioxid Redox Signal. 2005;7:1223–33. doi: 10.1089/ars.2005.7.1223. [DOI] [PubMed] [Google Scholar]
- Garcia-Valenzuela E, Gorczyca W, Darzynkiewicz Z, Sharma SC. Apoptosis in adult retinal ganglion cells after axotomy. J Neurobiol. 1994;25:431–8. doi: 10.1002/neu.480250408. [DOI] [PubMed] [Google Scholar]
- Garcia-Valenzuela E, Sharma SC, Pina AL. Multilayered retinal microglial response to optic nerve transection in rats. Mol Vis. 2005;11:225–31. [PubMed] [Google Scholar]
- Geiger LK, Kortuem KR, Alexejun C, Levin LA. Reduced redox state allows prolonged survival of axotomized neonatal retinal ganglion cells. Neuroscience. 2002;109:635–42. doi: 10.1016/s0306-4522(01)00493-6. [DOI] [PubMed] [Google Scholar]
- Greenlund LJ, Deckwerth TL, Johnson EM. Superoxide dismutase delays neuronal apoptosis: a role for reactive oxygen species in programmed neuronal death. Neuron. 1995;14:303–15. doi: 10.1016/0896-6273(95)90287-2. [DOI] [PubMed] [Google Scholar]
- Hoegger MJ, Lieven CJ, Levin LA. Differential production of superoxide by neuronal mitochondria. BMC Neurosci. 2008;9:4. doi: 10.1186/1471-2202-9-4. [DOI] [PMC free article] [PubMed] [Google Scholar]
- Kanamori A, Catrinescu MM, Traistaru M, Beaubien R, Levin LA. In vivo imaging of retinal ganglion cell axons within the nerve fiber layer. Invest Ophthalmol Vis Sci. 2010;51:2011–18. doi: 10.1167/iovs.09-4021. [DOI] [PubMed] [Google Scholar]
- Kirkland RA, Saavedra GM, Franklin JL. Rapid activation of antioxidant defenses by nerve growth factor suppresses reactive oxygen species during neuronal apoptosis: evidence for a role in cytochrome c redistribution. J Neurosci. 2007;27:11315–26. doi: 10.1523/JNEUROSCI.3590-07.2007. [DOI] [PMC free article] [PubMed] [Google Scholar]
- Koeberle PD, Ball AK. Effects of GDNF on retinal ganglion cell survival following axotomy. Vision Res. 1998;38:1505–15. doi: 10.1016/s0042-6989(97)00364-7. [DOI] [PubMed] [Google Scholar]
- Koob AO, Borgens RB. Polyethylene glycol treatment after traumatic brain injury reduces beta-amyloid precursor protein accumulation in degenerating axons. J Neurosci Res. 2006;83:1558–63. doi: 10.1002/jnr.20837. [DOI] [PubMed] [Google Scholar]
- Lieven CJ, Schlieve CR, Hoegger MJ, Levin LA. Retinal ganglion cell axotomy induces an increase in intracellular superoxide anion. Invest Ophthalmol Vis Sci. 2006;47:1477–1485. doi: 10.1167/iovs.05-0921. [DOI] [PubMed] [Google Scholar]
- Lieven CJ, Vrabec JP, Levin LA. The effects of oxidative stress on mitochondrial transmembrane potential in retinal ganglion cells. Antioxid Redox Signal. 2003;5:641–6. doi: 10.1089/152308603770310310. [DOI] [PubMed] [Google Scholar]
- Nguyen SM, Alexejun CN, Levin LA. Amplification of a reactive oxygen species signal in axotomized retinal ganglion cells. Antioxid Redox Signal. 2003;5:629–34. doi: 10.1089/152308603770310293. [DOI] [PubMed] [Google Scholar]
- Perry VH, Walker M. Amacrine cells, displaced amacrine cells and interplexiform cells in the retina of the rat. Proc R Soc Lond B Biol Sci. 1980;208:415–31. doi: 10.1098/rspb.1980.0060. [DOI] [PubMed] [Google Scholar]
- Quigley HA, Nickells RW, Kerrigan LA, Pease ME, Thibault DJ, Zack DJ. Retinal ganglion cell death in experimental glaucoma and after axotomy occurs by apoptosis. Invest Ophthalmol Vis Sci. 1995;36:774–86. [PubMed] [Google Scholar]
- Rehen SK, Linden R. Apoptosis in the developing retina: paradoxical effects of protein synthesis inhibition. Braz J Med Biol Res. 1994;27:1647–51. [PubMed] [Google Scholar]
- Ricci JE, Gottlieb RA, Green DR. Caspase-mediated loss of mitochondrial function and generation of reactive oxygen species during apoptosis. J Cell Biol. 2003;160:65–75. doi: 10.1083/jcb.200208089. [DOI] [PMC free article] [PubMed] [Google Scholar]
- Robinson KM, Janes MS, Pehar M, Monette JS, Ross MF, Hagen TM, et al. Selective fluorescent imaging of superoxide in vivo using ethidium-based probes. Proc Natl Acad Sci USA. 2006;103:15038–43. doi: 10.1073/pnas.0601945103. [DOI] [PMC free article] [PubMed] [Google Scholar]
- Schlieve CR, Lieven CJ, Levin LA. Biochemical activity of reactive oxygen species scavengers do not predict retinal ganglion cell survival. Invest Ophthalmol Vis Sci. 2006;47:3878–86. doi: 10.1167/iovs.05-1010. [DOI] [PubMed] [Google Scholar]
- Sievers C, Platt N, Perry VH, Coleman MP, Conforti L. Neurites undergoing Wallerian degeneration show an apoptotic-like process with Annexin V positive staining and loss of mitochondrial membrane potential. Neurosci Res. 2003;46:161–9. doi: 10.1016/s0168-0102(03)00039-7. [DOI] [PubMed] [Google Scholar]
- Sobrado-Calvo P, Vidal-Sanz M, Villegas-Perez MP. Rat retinal microglial cells under normal conditions, after optic nerve section, and after optic nerve section and intravitreal injection of trophic factors or macrophage inhibitory factor. J Comp Neurol. 2007;501:866–78. doi: 10.1002/cne.21279. [DOI] [PubMed] [Google Scholar]
- Swanson KI, Schlieve CR, Lieven CJ, Levin LA. Neuroprotective effect of sulfhydryl reduction in a rat optic nerve crush model. Invest Ophthalmol Vis Sci. 2005;46:3737–41. doi: 10.1167/iovs.05-0155. [DOI] [PubMed] [Google Scholar]
- Zhao H, Joseph J, Fales HM, Sokoloski EA, Levine RL, Vasquez-Vivar J, et al. Detection and characterization of the product of hydroethidine and intracellular superoxide by HPLC and limitations of fluorescence. Proc Natl Acad Sci USA. 2005;102:5727–32. doi: 10.1073/pnas.0501719102. [DOI] [PMC free article] [PubMed] [Google Scholar]
- Zhao H, Kalivendi S, Zhang H, Joseph J, Nithipatikom K, Vasquez-Vivar J, et al. Superoxide reacts with hydroethidine but forms a fluorescent product that is distinctly different from ethidium: potential implications in intracellular fluorescence detection of superoxide. Free Radic Biol Med. 2003;34:1359–68. doi: 10.1016/s0891-5849(03)00142-4. [DOI] [PubMed] [Google Scholar]


