Abstract
The tryptophan dipeptide (NATMA) in D2O shows two conformers having distinctive acetyl end amide-I' transition frequencies. In two dimensional echo spectroscopy cross peaks between these conformer transitions are used to show they are undergoing exchange on the 1.5 ps time scale. Simulations suggest that the accessibility of the amide group to water is restricted in one of the conformations.
1. Introduction
The elementary chemical bond scale motions of small peptides underpin the dynamics of the backbone structures of more complex protein systems, so they have an important role in protein stability and function. The relevant potential energy functions of small peptides range from well defined conformational minima separated by large barriers, to energy surfaces linking structures through many small barriers. Molecular dynamics (MD) simulations have predicted ultrafast equilibrium transitions between conformers connected by small activation barriers in small peptides. A low activation barrier of 2.5 kcal/mole has been calculated for the picosecond conversion of C7eq to the C5 conformer of the alanine dipeptide.1,2 Similar calculations of activation energy barriers and prediction of the interconversion rates have been extended to the tripeptides of alanine2 and glycine.3 Hexapeptides2,3 have been predicted to interconvert between sheet and helical structures which are the most prominent structural elements of the protein backbone. The present knowledge regarding ultrafast equilibrium conformational dynamics of small peptides stems mainly from MD simulations notwithstanding many experimental studies of conformational motions near equilibrium occurring on microsecond-to-nanosecond timescales by NMR,4,5 ESR6 and laser induced pH and temperature jump experiments.7,8 Ultrafast processes under non-equilibrium conditions have been reported for basic peptide motions using molecular photo-switches.9–12 Although MD simulations have predicted the importance of ultrafast elementary steps in structure evolution for biological activity13 and selectivity,14 the experimental manifestation of picosecond timescale interchanges of distinct peptide conformers at equilibrium, as reported in the current study, is unique.
Recently, the 2D IR spectroscopic method has been used to measure the kinetics of picosecond chemical processes at equilibrium in cases where the interchanging populations have distinct mean vibrational frequencies15–17 The intrinsic fast temporal resolution of the 2D IR technique thereby extends the accessible range of equilibrium dynamics into the femtosecond / picosecond regime.18 This experimental strategy has been employed to measure such dynamic processes as methanol hydrogen bonding to amide-I' modes,19 the hydrogen bond kinetics of nitriles,15,20 complexation,16 single bond rotations21 and fluctionality.17 These concepts are applied to aqueous peptide dynamics in the present work.
Spectroscopic investigations of N-acetyl tryptophan methyl amide (NATMA; tryptophan dipeptide) as an isolated molecule in the gas phase have demonstrated the existence of many conformational minima.22–24 In the gas phase the lowest energy C5 and C7 structures were found to be isoenergetic despite the significant differences in the peptide backbone configurations and presumed large activation barriers connecting them. Previous solution phase experimental results have shown that the Trp-dipeptide structures are solvent sensitive, ranging from those of the most prevalent gas phase forms in nonpolar solvents to extended hydrogen bonded structures in water.25 It has been suggested25 that multiple hydrogen bonded configurations that interchange on the picosecond time scale are present for the tryptophan dipeptide in methanol, however the conformational dynamics in the more relevant aqueous environment has not been previously reported. Recent simulations of vibrational spectra of polypeptides have predicted that the water structures near the amide carbonyls are modified by hydrophobic residues such as tryptophan.26 The tryptophan dipeptide, with its two amide-I' modes whose time dependent vibrational frequency distributions can be separately examined, is used here as a model of the hydrophobic protection effects of the tryptophan residue on the water structural dynamics.27,28 The amide-I' carbonyl of its N-methylamino end is substituted with 13C=16O to distinguish it spectrally from the amide-I' transitions of the acetyl end of the peptide where the dynamics occurs. The results concern the dynamics of the amide-I' vibrational frequency distributions and simulations of how the indole ring of tryptophan and the hydrogen bond dynamics of water around the carbonyl group are changing in the equilibrium dynamics.
2. Materials and Methods
The tryptophan dipeptide
The method of preparation and purification of N-Acetyl tryptophan methyl amide has been described elsewhere.25,29 A sample in D2O (56 µm pathlength CaF2 cell) having an optical density of 0.03 for the N-methylamino end amide-I' peak was used in the experiments.
The 2D IR spectra
Heterodyned spectral interferometry was employed using the laser arrangement described previously.30,31 Fourier-transform limited 75-fs pulses were used in the 2D IR experiments. Three of these pulses, each with energy of 400 nJ and wave vectors k1, k2, and k3, were incident on the sample. The phase-matched signal at wave vector −k1 + k2 + k3 was detected by heterodyning it with a local oscillator pulse that always preceded the signal pulse by a fixed interval of 1.5 ps. The interval between pulses 1 and 2 is denoted as the coherence time τ, that between pulses 2 and 3 is denoted as the population or waiting period T, and that between pulse 3 and the detected signal is denoted as t. The rephasing and nonrephasing sequences correspond to k1 arriving earlier or later than k2 respectively. The signal and local oscillator pulses were combined at the focal plane of a monochromator having a 64-element mercury– cadmium–telluride array detector (InfraRed Associates, Stuart, FL). Each detector element is 200 µm in width and 1 mm in height. The raw data collected by using this method was in the form of a 2D array of coherence time τ (in 2-fs steps from −3 to 3 ps) and detected wavelength (in ~15- nm steps.) To obtain absorptive or correlation spectra, rephasing and nonrephasing 2D frequency spectra were added. Details of the 2D IR data processing have been described previously.32,33 The 2D spectral function S̰ (ωτ, ωt, T) for each population interval T depends on the coherence and the detection frequencies ωτ and ωt. The method of obtaining the ratio of the diagonal and cross peak volumes at different waiting times is discussed in more detail below.
Molecular Mechanics Calculations
Molecular mechanics calculations of the tryptophan dipeptide were carried out using the CHARMM force field in HyperChem.34 The extended solvent hydrogen-bonded structure of the tryptophan in D2O with Ramachandran angles of (±160±10°, ±75±10°)25 was used as the initial backbone geometry. A conformational search based on single point calculations, which provided the value for the total potential energy at each point, was performed by separately varying the Cα-Cβ and Cβ-Cγ bond rotations from −180° to 180° with a step size of 5° (a positive value denotes a clockwise rotation of the bond). The Cα-Cβ bond rotation is defined by the change in the dihedral angle formed by the atoms N-methylamino end carbonyl carbon atom Cam, and Cα, Cβ and Cγ. The Cβ - Cγ bond rotation is defined by the change in the dihedral angle formed by the atoms Cα, Cβ and Cγ and the indole ring carbon atom 9 connected to Cγ. The potential energy surface obtained from the conformational search predicted two lowest energy minima separated by 3 kcal mol−1; one with the indole ring oriented towards the acetyl end (Cα-Cβ and Cβ-Cγ bond rotations are 120° and 145°), and the other with the indole ring oriented towards the N-methylamino end (Cα-Cβ and Cβ-Cγ bond rotations are 45° and 60°). Geometry optimization of these two conformational minima was performed using the steepest descent algorithm and they converged to a gradient of less than 0.001 kcal mol−1 Å−1
Molecular Dynamics Simulations
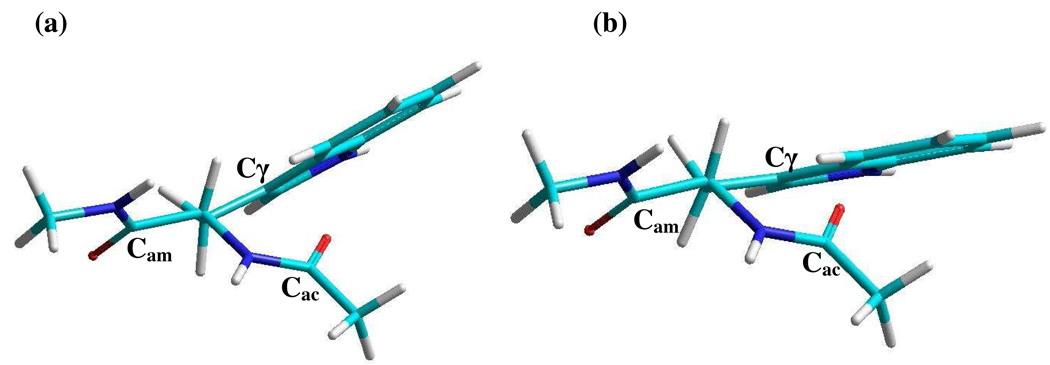
The MD simulations in explicit solvent water (H2O) have been carried out using the NAMD2.5 package.35 The initial structures used for the MD simulations were either of the energy minimized structures obtained from the above mentioned molecular mechanics calculations. Both lead to the same equilibrated distribution. Structures showing the extremes of the Cα-Cβ bond rotation from this distribution are shown in Figure 1. The MD simulations include 1752 explicit water molecules of the TIP3P type in a cubic box (30 Å). The CHARMM27 force field36 was used to compute all interactions. A cutoff of 12 Å was used for the nonbonded interactions. The long-range electrostatic interaction was evaluated by the Ewald sum approach.37 The system was initially energy minimized and equilibrated at 300 K for 1 ns at a time step of 2fs. The simulations were performed for constant NPT condition at a time step of 2 fs for 2 ns and 10,000 evenly distributed snapshots were used for further analysis of the simulation trajectories. Throughout this paper no distinction is made between H2O and D2O. The simulations were all carried out in H2O but the experiments are all in D2O.
Figure 1. Structures of the tryptophan dipeptide.
Newman projections of two of the structures of the tryptophan dipeptide looking down the Cα-Cβ bonds. (a) and (b) represent the extremes of the Cα-Cβ bond rotation found from the molecular dynamics simulations.
3. Experimental Results
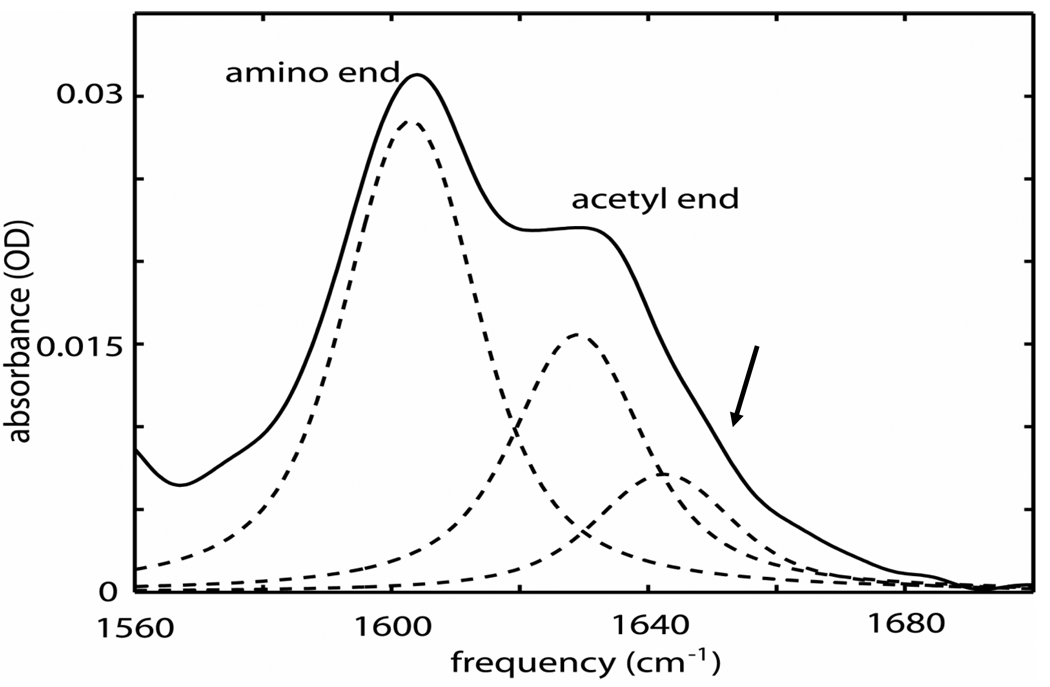
The FTIR spectrum of the isotopically labeled tryptophan dipeptide in D2O (see Figure 2) showed two separated amide-I' bands with the N-methylamino (13C=16O) end transition frequency at 1605 cm−1 and the acetyl end (12C=16O) transition frequency at 1630 cm−1. The band peaked at 1630 cm−1 shows a shoulder near 1645 cm−1 that is marked by an arrow in Figure 2. A fit of the asymmetric band near 1630 cm−1 to two Voigt profiles yields bands at 1630 (FWHM=24 cm−1) and 1643 cm−1 (FWHM=25 cm−1) with the former having twice the cross section of the latter. The ratio of the cross sections of the N-methylamino end to the total acetyl end amide-I' bands is 1.5.
Figure 2. The FTIR of tryptophan dipeptide in D2O.
The FTIR spectrum in D2O of the tryptophan dipeptide amide-I' bands labeled with 13C = 16O at the amino end. The weaker underlying transition at the acetyl end is indicated by the arrow. The dashed lines are the fitted Voigt profile components.
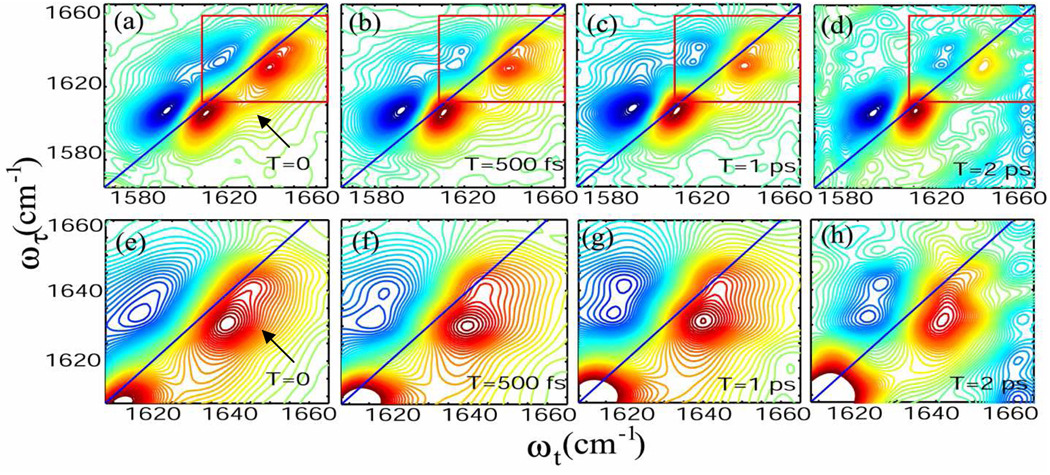
The 2D IR spectra of the whole amide-I' region shown in Figure 3(a) – (d) consist of the v = 0 → v = 1 amide-I' transitions on the diagonal and the v = 1 → v = 2 transitions shifted along the horizontal axis (ωt) by the diagonal anharmonicity of ca. 17 cm−1.25 The acetyl end amide-I' mode region consists of two clearly separated transitions, at 1630 and 1643 cm−1. The resolved diagonal peak at ωτ = ωt = 1643 cm−1 corresponds to the shoulder seen in FTIR. The comparison of the FTIR and 2D IR spectra in this region presents another example of the advantage of 2D IR in separating closely spaced transitions. At zero waiting time, the higher frequency acetyl end transition at ~1643 cm−1 has 65% of the peak signal amplitude of the transition at ~1630 cm−1. This result is consistent with computations of the 2D IR spectra based on the Voigt profile parameters from FTIR fitting and the standard response functions38 neglecting any exchange kinetics as will be the situation at waiting time T=0.25 As the temperature is increased to 60° C, the fractional amplitude at 1643 cm−1 increases to 94%. In contrast, the 2D IR spectra of the amide-I' mode of the N-methylamino end shows a single peak elongated along the diagonal indicative of static inhomogeneous broadening. This is again consistent with the FTIR spectrum which shows a single symmetric peak at 1605 cm−1. In 2D IR the N-methylamino end amide-I' mode signal amplitude at 1605 cm−1 is larger than the combined acetyl end transitions. They are not expected to have identical spectral parameters since they are chemically distinct modes from MeCONH- and MeNHCO-. The signal amplitude of the diagonal peak at 1630 cm−1 is 70% of that of the peak at 1605 cm−1.
Figure 3. The 2D IR spectra of tryptophan dipeptide in D2O.
Absorptive 2D IR spectrum at (a) T = 0, (b) T = 500 fs, (c) T = 1 ps and (d) T = 2 ps. Enlargement of the frequency region of the acetyl end amide-I' mode marked by the red boxes in a, b, c, d are shown in (e) T = 0, (f) T = 500 fs, (g) T = 1 ps and (h) T = 2 ps.
Cross peaks between the amide-I' transitions of the acetyl and N-methylamino ends could be identified at T = 0 (marked by an arrow in Figure 3(a)). The anharmonically shifted peaks of the acetyl end carbonyl interfere with the intermode cross peaks, which causes distortion and diminution of the signal amplitude in the v =1 → v = 2 region.25 The waiting time dependence of the 2D IR spectra in D2O at a selection of T is shown in Figure 3 (a) – (d). The change in peak shape at the cross peak region of the acetyl end modes (ωτ = 1630 cm−1, ωt = 1643 cm−1) with population period increasing from T=0 to T= 2 ps is shown in Figure 3 (e) – (h) which is an enlargement of the data in the upper part of the Figure. These data manifest the evolution of a cross peak between the two v = 0 → v = 1 acetyl end amide-I' transitions (marked by an arrow in Figure 3(e)).
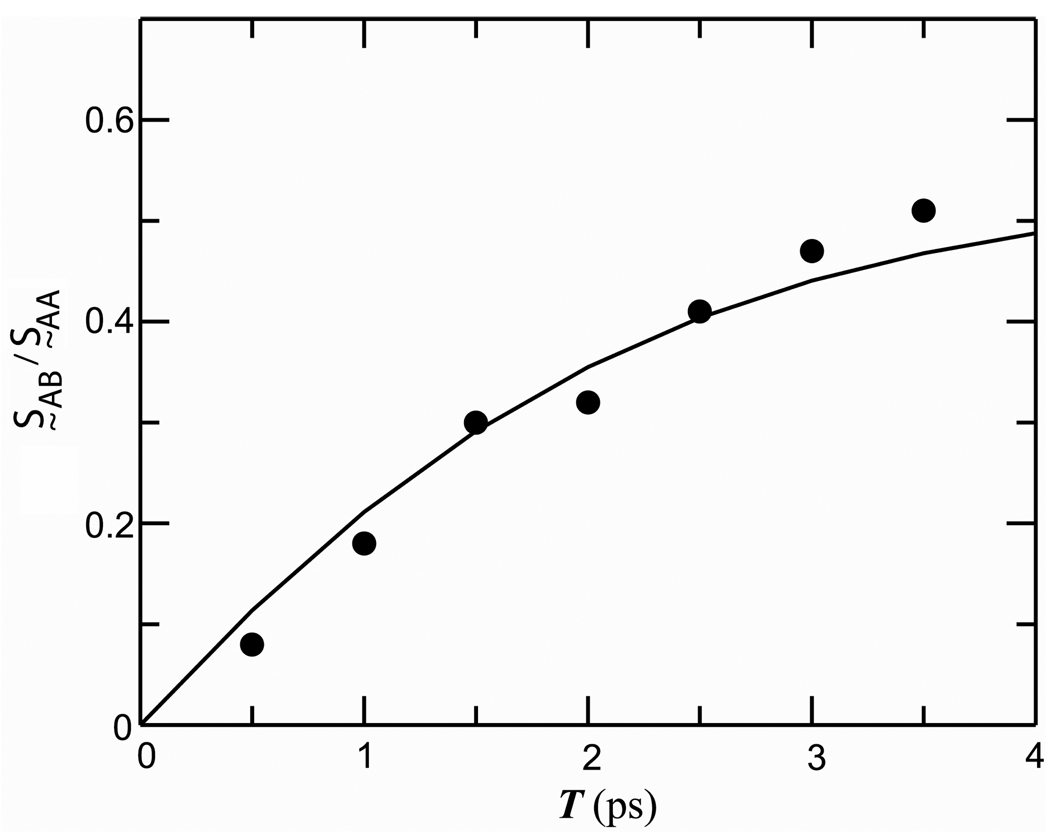
The cross peak at (ωτ = 1630 cm−1, ωt = 1643 cm−1) evolves over the population time T range of 0 to 3.5 ps. A quantitative measure of the ratio of the integrated areas of the cross peak and the diagonal peak at 1630 cm−1 was obtained at different T by subtracting the 2D spectrum spectra S̰ (ωτ, ωt, 0) at T = 0 from S̰ (ωτ, ωt, T) at various T values. Through this method the cross peak signal could be isolated, integrated over the frequency space and compared with the diagonal signal. The T-dependence of the ratio of the cross peak and diagonal signals defined as S̰AB/S̰AA ( A and B are defined below) is plotted in Figure 4.
Figure 4. Conformational exchange kinetics of tryptophan dipeptide.
Experimental values (solid circles) of S̰AB/S̰AA as defined in the text. Waiting time evolution of the ratio S̰AB/S̰AA as described by Equation (2) (solid line)
4. Discussion
When a chemical or conformational process results in the interchange of populations of structures having different vibrational frequencies, the waiting time dependence of the 2D IR signal is affected by in a predictable manner.15,19,21 Chemical exchange causes the development of a signal in the region of the cross peaks between the interchanging states while the two diagonal peak signal regions are caused to diminish. Population relaxation causes all the signals to decrease in amplitude with increasing waiting time. An analysis of these changes yields the equilibrium kinetics on the picosecond time scale. A number of examples of such exchange have now been reported.15–17,20,21
In the present example, the multiple transitions of the acetyl end amide-I' mode in the 2D IR spectra indicate the existence of two conformational distributions of tryptophan dipeptide in D2O, each having a spectrally distinct vibrational peak, one at 1630 cm−1 (A) and the other at 1643 cm−1(B). If there is an equilibrium between the conformational distributions, labeled A and B, with equilibrium constant Keq = kAB / kBA, cross peaks between the vibrational transitions of these conformations will appear in the 2D IR spectra when the two conformers exchange during the population period of the 2D IR sequence. The evolution of the cross peaks between the amide-I' modes at 1643 and 1630 cm−1 indicates fast chemical exchange between the two conformational distributions.
A simplified kinetic model was constructed to analyze the exchange kinetics15 in which it was assumed that the spectrum of the acetyl end amide-I' doublet corresponds to two exchanging states characterized by one relaxation time and an equilibrium constant. It will be shown below that these assumptions are consistent with a computation of the IR spectrum and molecular dynamics simulations. The two-state model is illustrated schematically as:
| (1) |
where the two conformers (A and B) can undergo chemical exchange with forward and backward rate constants kAB and kBA. The diagonal 2D IR signal S̰AA for the state A at a given point in the two dimensional space has the content where RAA (ωτ, ωt) is a 2D IR spectral shape factor arising from all the Liouville pathways18,39 contributing at that point and the equilibrium number density of A. The cross peak signal S̰AB in the same notation is . Each of these signals is associated with the relevant transition dipoles ( μA and μB) and the conditional probabilities PAA(T), PAB(T), PBA(T) or PBB(T) arising from kinetic equations, where PAB(T) is the probability of measuring the B population after time T if the system started out in A. When T1A=T1B, the ratio of the diagonal and cross peak signal areas can be approximated by a simple function of the exchange rate:
| (2) |
where S̰AB/S̰AA corresponds to the ratio of the integrated signals of the intramode cross peak centered at (ωτ = 1630 cm−1, ωt = 1643 cm−1) and the diagonal peak at 1630 cm−1. The relaxation rate is kR = kAB + kBA. Equation 2 is approximate in the sense it assumes that the diagonal and cross peaks can be separated experimentally and integrated over all frequencies. If that were the case the area ratio would be independent of the dephasing dynamics. In reality the transitions overlap, which when combined with the variations of line shape with waiting time lead to the relaxation time result being uncertain to within ca. 10%. The population lifetimes (T1) and the transition dipole moments of the two conformers were taken to be equal. The computed 2D IR spectra at various waiting times, using standard response functions, indicate that the T dependence of the acetyl end transitions is not arising from the different population times of the overlapping diagonal peaks. The ratio of the peak 2D IR spectral amplitudes of the two acetyl end transitions approaches unity at high temperature (60°). Therefore it is assumed that it is the equilibrium constant that is approaching unity because of the small free energy separation between the interconverting states. If this analysis is correct it implies that the transition dipole moments ( μA and μB) are equal, which is what will now be assumed
To obtain the ratio S̰AB/S̰AA at different waiting times, the peak heights of the acetyl end amide-I' band at 1630 cm−1 in the 2D spectra at various T values were normalized to that at T=0. Then the 2D spectrum at T=0 was subtracted from the normalized spectra. The cross peak positions in these difference spectra were confirmed at each value of T to be within 2 cm−1 (along ωτ and ωt) of the expected cross peak position based on the diagonal peak positions. The integrated cross peak signal was obtained by summing up all the contour values greater than one-half of the maximum cross peak intensity. By fitting the observed ratio S̰AB/S̰AA at different population periods (Figure 4) to the two state exchange model (Equation 1), the rate of the chemical exchange was found to be kR= 6.9±1.0 × 10¹¹ s−1; the uncertainty of ca. 15% arises from a ca. 10% uncertainty (as mentioned above) in estimating the integrated cross peak signal from the overlapping transitions. The knowledge of the equilibrium constant from the population ratio of the two frequency distributions (assuming μA = μB, and that they are both independent of frequency) yields the forward (kAB) and backward (kBA) rates to be 2.4 × 10¹¹ and 4.5 × 10¹¹ s−1 respectively.
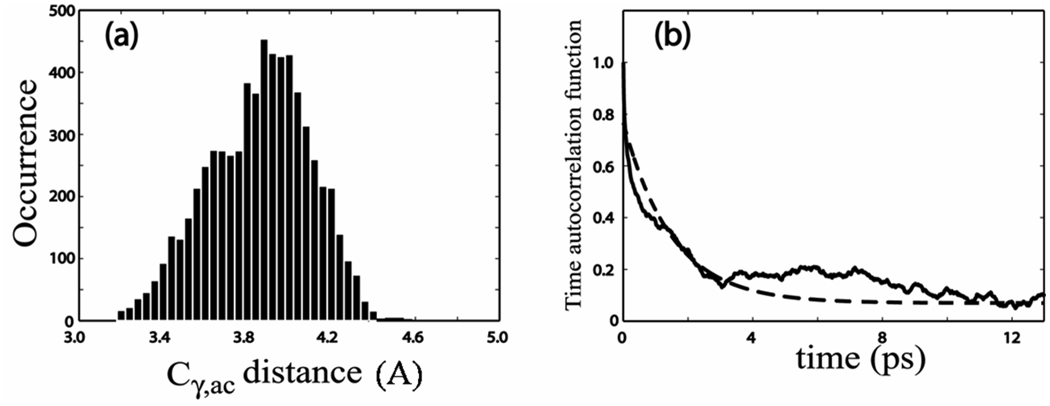
The molecular dynamics simulations provided predictions of the solvent influence on the molecular structure and dynamics. The simulation shows that the dipeptide is undergoing significant single bond rotational dynamics that alters the proximity of the acetyl end amide group and the indole ring. The dominant motions involve rotations of 20° around the Cα-Cβ single bond and 9° about the Cβ-Cγ bond. The full range of sample structures falls within the staggered conformations with respect to these two single bonds. The two extreme structures are depicted in Figure 1. The probability distribution of the distance Cγ,ac between Cγ and Cac (the acetyl end carbonyl carbon; see Figure 1) shows a bimodal distribution centered around 3.6 and 4.0 Å as shown in Figure 5(a). The distance Cγ,ac is independent of the Cβ-Cγ bond rotation angle and the distributions in the MD simulations in Figure 5(a) mainly result from the Cα-Cβ single bond rotation. The single bond rotation around Cα-Cβ makes the hydrophobic indole ring become more proximate to the carbonyl carbon of the acetyl end in one of the conformational distributions centered at 4.0 Å. This configuration, corresponding to that in Figure 1(b), is expected to modify the water (D2O) structure around the acetyl amide unit as compared with the other conformer. An autocorrelation function of the simulated Cγ,ac distance fluctuations, defined as 〈δCγ,ac(t) δCγ,ac(0)〉 was calculated by creating a binary distribution of the distance Cγ,ac based on whether the distance is greater or less than 3.8 Å. The autocorrelation function of the binary distribution (see Figure 5(b)) decays with a time constant of 6.7 × 10¹¹ s−1 which is comparable with the experimentally obtained rate of chemical exchange. However, this connection does not explain the frequency shift between the two conformers.
Figure 5. Simulation results.
(a) Occurrence distribution of the distance Cγ,ac between carbon atoms Cγ and Cac from the MD simulation. (b) Simulated time autocorrelation function (solid) of the distance Cγ,ac fitted to an exponential decay (dashed) with a time constant of 0.67 ps−1.
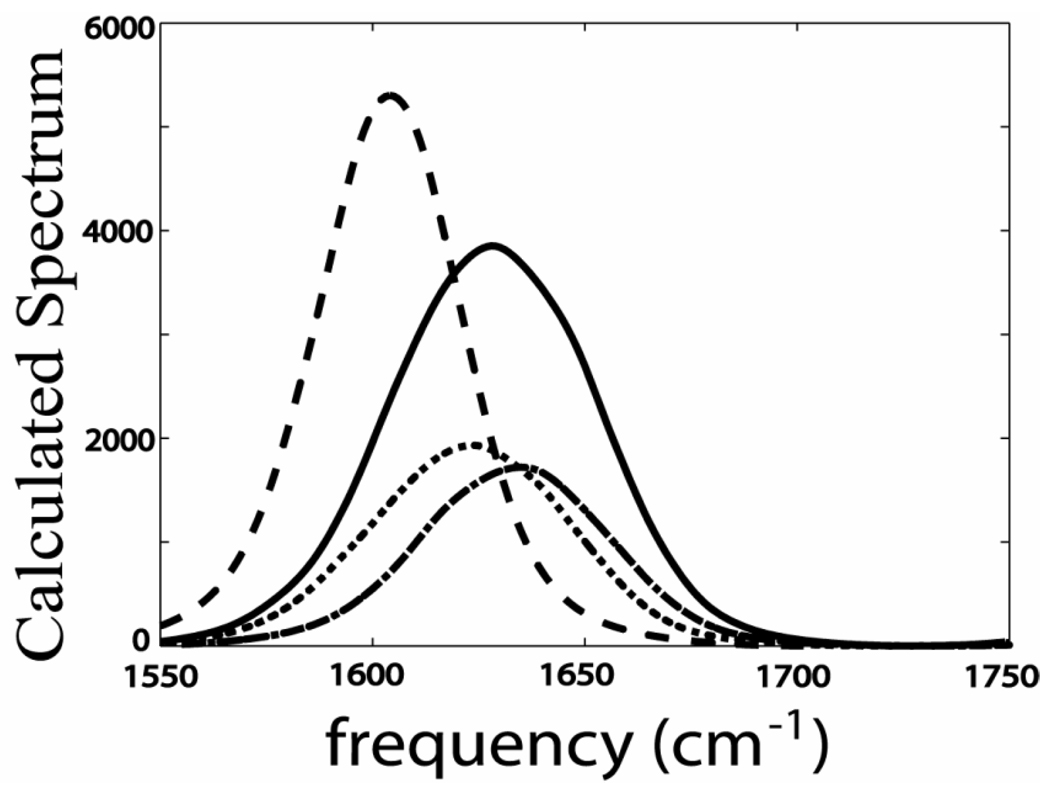
The sensitivity of the amide-I' modes to hydrogen bonding resulting in a red-shift of the transition frequency for more strongly H-bonded structures is well-known from the literature.40,41 The frequency distributions of the amide-I modes, calculated from the MD trajectories using SPECTRON,42 show a broad asymmetric distribution for the acetyl end and a narrower symmetric distribution for the N-methylamino end (as shown in Figure 6). This result shows that the two amide ends of the tryptophan dipeptide manifest the conformational distributions differently and have different environments in agreement with experiment. The simulation verifies that the proximity of the indole ring arising from the C-C single bond rotation influences the hydrogen bonding of the water molecules to the acetyl end C=O and N-H. The hydrogen bonding contributions from the different water structures associated with the acetyl amide were calculated from each of the MD snapshots. A water molecule was considered as hydrogen bonded to the acetyl end C=O (N-H) if ROO (RON) <3.5 A and θHOO (θHNO) <30°, where ROO (RNO) being the distance between the donor oxygen and the acceptor oxygen (nitrogen) atoms and θHOO is the angle between the OH (NH) and OO (NO) vectors. The snapshots used in the SPECTRON42 calculation were binned according to the number of hydrogen bonds based on the foregoing algorithm. Two spectra were computed: one with the acetyl amide unit forming two or more hydrogen bonds, the other with it forming less than two hydrogen bonds. These two spectra, both shown in Figure 6, add to yield the acetyl end asymmetric band. However it is clear that the spectra with two or more hydrogen bonds (dotted line in Figure 6) is significantly down shifted (−10 cm−1) from that with fewer than two hydrogen bonds. This analysis shows that the asymmetry in the calculated spectrum from SPECTRON42 is arising from H-bond configurational differences. The ultrafast rotations around the single bonds cause alternating changes in the solvent (H-bonding) environment of the acetyl end amide group, giving rise to the two frequency distributions in the 2D spectra. The binning into fewer than two, and two or more H-bonds does not produce two bands having the experimental intensity ratio of 2:1 but it confirms the origin of the dual frequency distribution seen in the experiments.
Figure 6. Calculated spectrum by SPECTRON.42.
Calculated spectrum by SPECTRON42 of the amide –I modes at the acetyl end (solid) and the N-acetylamino end (dashed). The spectrum of the acetyl end with at least two hydrogen bonds (dotted) and less than two hydrogen bonds (dashed dot).
To study further the effect of the disruption of the solvation at the acetyl carbonyl by the proximity of the hydrophobic indole ring, we studied the hydrogen bond dynamics between the acetyl end C=O and the surrounding water molecules from the MD simulation trajectories by using the previously established method of estimating the time correlation functions43. The time correlation function CHB(t), given by the analytical form 〈h(0)h(t)〉 / 〈h2〉, 43,44 was calculated from the MD simulation snapshots, where h(t) = 1 if one particular water molecule is hydrogen bonded (using the aforesaid algorithm) and zero if it is not. This procedure was repeated for all water molecules that formed H-bonds during simulation. The simulated correlation function, which is the sum of the contributions from all of these water molecules, has an ultrafast component that decays in 100 fs, which is on the time scale predicted45 for the librational motions of the water molecules. The correlation function h(t) also decays on a timescale of 6.2 × 10¹¹ s−1, which describes the structural relaxation of the hydrogen bonds of the dipeptide. This rate is close to the measured exchange rate.
The results provide direct experimental evidence that the water structure and its dynamics in the neighborhood of an exposed amide unit depends significantly on the hydrophobic character of the nearby residue. It is likely that this factor will require consideration in descriptions of the dynamics of water near proteins, as already shown in some simulations.46
5. Conclusion
The acetyl end amide-I' mode of the tryptophan dipeptide shows a double peaked vibrational frequency distribution, indicating the existence of multiple conformers in D2O. This spectral structure is more clearly resolved in 2D IR compared with FTIR. Cross peaks develop with increasing waiting time indicating that the conformers are exchanging on the experimental time scale. A detailed study of the waiting time dependence and fitting based on the assumption there is exchange between only two states having equal transition dipoles evidences a relaxation time of 1.5 ps. MD simulations indicate that on the few picosecond time scale there is significant back and forth motion of the indole ring caused by axial rotations about the C-C single bonds. The C-C distance histogram is bimodal suggesting there are two dominant states in the equilibrium structure distribution. The infrared spectrum of the acetyl end amide-I' mode computed by SPECTRON42 shows an asymmetry that is consistent with the presence of at least two peaks in the frequency distribution. The variations of the water structure around the carbonyl also track these molecular motions suggesting that changes in the H-bond configurations cause the vibrational frequency shifts. In one group of conformations the indole ring appears to offer more hydrophobic protection of the acetyl end carbonyl, which would result in the blue shift of the vibrational frequency.
Acknowledgement
We thank Prof. S. Mukamel and his group for invaluable help with SPECTRON.42 Discussion with Diego Pantano is gratefully acknowledged. The research was supported by the NIH Grant GM12592, by NSF and by instrumentation through the Resource NIH P41 RR001348.
References
- 1.Wei DQ, Guo H, Salahub DR. Phys. Rev. E. 2001;6401 doi: 10.1103/PhysRevE.64.011907. [DOI] [PubMed] [Google Scholar]
- 2.Solov'yov IA, Yakubovich AV, Solov'yov AV, Greiner W. Phys. Rev. E. 2006;73 doi: 10.1103/PhysRevE.73.021916. [DOI] [PubMed] [Google Scholar]
- 3.Yakubovich AV, Solov'yov IA, Solov'yov AV, Greiner W. Eur. Phys. J. D. 2006;39:23–34. [Google Scholar]
- 4.Dyson HJ, Wright PE. Nuclear Magnetic Resonance of Biological Macromolecules, Part C. Vol. 394. San Diego: ELSEVIER ACADEMIC PRESS INC; 2005. Elucidation of the protein folding landscape by NMR; p. 299. +. [DOI] [PubMed] [Google Scholar]
- 5.Akke M. Curr. Opin. Struct. Biol. 2002;12:642–647. doi: 10.1016/s0959-440x(02)00369-x. [DOI] [PubMed] [Google Scholar]
- 6.Lietzow MA, Hubbell WL. Biophys. J. 1998;74:A278–A278. [Google Scholar]
- 7.Williams S, Causgrove TP, Gilmanshin R, Fang KS, Callender RH, Woodruff WH, Dyer RB. Biochemistry. 1996;35:691–697. doi: 10.1021/bi952217p. [DOI] [PubMed] [Google Scholar]
- 8.Thompson PA, Eaton WA, Hofrichter J. Biochemistry. 1997;36:9200–9210. doi: 10.1021/bi9704764. [DOI] [PubMed] [Google Scholar]
- 9.Bredenbeck J, Helbing J, Behrendt R, Renner C, Moroder L, Wachtveitl J, Hamm P. J. Phys. Chem. B. 2003;107:8654–8660. [Google Scholar]
- 10.Bredenbeck J, Helbing J, Kolano C, Hamm P. ChemPhysChem. 2007;8:1747–1756. doi: 10.1002/cphc.200700148. [DOI] [PubMed] [Google Scholar]
- 11.Bredenbeck J, Helbing J, Hamm P. J. Am. Chem. Soc. 2004;126:990–991. doi: 10.1021/ja0380190. [DOI] [PubMed] [Google Scholar]
- 12.Kolano C, Helbing J, Kozinski M, Sander W, Hamm P. Nature. 2006;444:469–472. doi: 10.1038/nature05352. [DOI] [PubMed] [Google Scholar]
- 13.Karplus M, Petsko GA. Nature. 1990;347:631–639. doi: 10.1038/347631a0. [DOI] [PubMed] [Google Scholar]
- 14.Zhou HX, Wlodek ST, McCammon JA. Proc. Natl. Acad. Sci. U. S. A. 1998;95:9280–9283. doi: 10.1073/pnas.95.16.9280. [DOI] [PMC free article] [PubMed] [Google Scholar]
- 15.Kim YS, Hochstrasser RM. Proc. Natl. Acad. Sci. U. S. A. 2005;102:11185–11190. doi: 10.1073/pnas.0504865102. [DOI] [PMC free article] [PubMed] [Google Scholar]
- 16.Zheng J, Kwak K, Asbury J, Chen X, Piletic IR, Fayer MD. Science. 2005;309:1338–1343. doi: 10.1126/science.1116213. [DOI] [PubMed] [Google Scholar]
- 17.Cahoon JF, Sawyer KR, Schlegel JP, Harris CB. Science. 2008;319:1820–1823. doi: 10.1126/science.1154041. [DOI] [PubMed] [Google Scholar]
- 18.Sanda F, Mukamel S. J. Chem. Phys. 2006;125 doi: 10.1063/1.2205367. [DOI] [PubMed] [Google Scholar]
- 19.Woutersen S, Mu Y, Stock G, Hamm P. Chem. Phys. 2001;266:137–147. [Google Scholar]
- 20.Kim YS, Hochstrasser RM. J. Phys. Chem. B. 2006;110:8531–8534. doi: 10.1021/jp060935n. [DOI] [PMC free article] [PubMed] [Google Scholar]
- 21.Zheng J, Kwak K, Xie J, Fayer MD. Science. 2006;313:1951–1955. doi: 10.1126/science.1132178. [DOI] [PubMed] [Google Scholar]
- 22.Dian BC, Longarte A, Mercier S, Evans DA, Wales DJ, Zwier TS. J. Chem. Phys. 2002;117:10688–10702. [Google Scholar]
- 23.Evans DA, Wales DJ, Dian BC, Zwier TS. J. Chem. Phys. 2004;120:148–157. doi: 10.1063/1.1626541. [DOI] [PubMed] [Google Scholar]
- 24.Dian BC, Longarte A, Winter PR, Zwier TS. J. Chem. Phys. 2004;120:133–147. doi: 10.1063/1.1626540. [DOI] [PubMed] [Google Scholar]
- 25.Bagchi S, Kim YS, Charnley AK, Smith AB, Hochstrasser RM. J. Phys. Chem. B. 2007;111:3010–3018. doi: 10.1021/jp067348m. [DOI] [PubMed] [Google Scholar]
- 26.Wang J, Zhuang W, Mukamel S, Hochstrasser R. J. Phys. Chem. B. 2008;112:5930–5937. doi: 10.1021/jp075683k. [DOI] [PMC free article] [PubMed] [Google Scholar]
- 27.Okada A, Miura T, Takeuchi H. Biochemistry. 2001;40:6053–6060. doi: 10.1021/bi0028441. [DOI] [PubMed] [Google Scholar]
- 28.Wu Y, Voth GA. Biophys. J. 2005;89:2402–2411. doi: 10.1529/biophysj.105.066647. [DOI] [PMC free article] [PubMed] [Google Scholar]
- 29.Souhassou M, Lecomte C, Blessing RH, Aubry A, Rohmer MM, Wiest R, Benard M, Marraud M. Acta Crystallographica Section B. 1991;47:253–266. doi: 10.1107/s0108768190010771. [DOI] [PubMed] [Google Scholar]
- 30.Asplund MC, Zanni MT, Hochstrasser RM. Proc. Natl. Acad. Sci. U. S. A. 2000;97:8219–8224. doi: 10.1073/pnas.140227997. [DOI] [PMC free article] [PubMed] [Google Scholar]
- 31.Zanni MT, Gnanakaran S, Stenger J, Hochstrasser RM. J. Phys. Chem. B. 2001;105:6520–6535. [Google Scholar]
- 32.Kim YS, Wang JP, Hochstrasser RM. J. Phys. Chem. B. 2005;109:7511–7521. doi: 10.1021/jp044989d. [DOI] [PubMed] [Google Scholar]
- 33.Kim YS, Hochstrasser RM. J. Phys. Chem. B. 2005;109:6884–6891. doi: 10.1021/jp0449511. [DOI] [PubMed] [Google Scholar]
- 34.HyperChem(TM) Professional 7.51. 1115 NW 4th Street, Gainesville, Florida, 32601, USA: H., Inc.; [Google Scholar]
- 35.Phillips JC, R Braun R, Wang W, Gumbart J, Tajkhorshid E, Villa E, Chipot C, Skeel RD, Kalé L, Schulten K. J. Comput. Chem. 2005;26:1781–1802. doi: 10.1002/jcc.20289. [DOI] [PMC free article] [PubMed] [Google Scholar]
- 36.Brooks BR, Bruccoleri RE, Olafson BD, States DJ, Swaminathan S, Karplus M. J. Comput. Chem. 1983;4:187–217. [Google Scholar]
- 37.Essmann U, Perera L, Berkowitz ML, Darden T, Lee H, Pedersen LG. J. Chem. Phys. 1995;103:8577–8593. [Google Scholar]
- 38.Mukamel S. Principles of Nonlinear Optical Spectrscopy. 1995 [Google Scholar]
- 39.Kwak K, Zheng JR, Cang H, Fayer MD. J. Phys. Chem. B. 2006;110:19998–20013. doi: 10.1021/jp0624808. [DOI] [PubMed] [Google Scholar]
- 40.Hayashi T, Mukamel S. J. Chem. Phys. 2006;125 doi: 10.1063/1.2348865. [DOI] [PubMed] [Google Scholar]
- 41.Oh KI, Han J, Lee KK, Hahn S, Han H, Cho M. J. Phys. Chem. A. 2006;110:13355–13365. doi: 10.1021/jp065475c. [DOI] [PubMed] [Google Scholar]
- 42.Zhuang W, Abramavicius D, Hayashi T, Mukamel S. J. Phys. Chem. B. 2006;110:3362–3374. doi: 10.1021/jp055813u. [DOI] [PMC free article] [PubMed] [Google Scholar]
- 43.Luzar A, Chandler D. Phys. Rev. Lett. J1 - PRL. 1996;76:928 LP–931 LP. doi: 10.1103/PhysRevLett.76.928. [DOI] [PubMed] [Google Scholar]
- 44.Chandra A. Phys. Rev. Lett. J1 - PRL. 2000;85:768 LP–771 LP. doi: 10.1103/PhysRevLett.85.768. [DOI] [PubMed] [Google Scholar]
- 45.Laage D, Hynes JT. Science. 2006;311:832–835. doi: 10.1126/science.1122154. [DOI] [PubMed] [Google Scholar]
- 46.Schroder C, Rudas T, Boresch S, Steinhauser O. J. Chem. Phys. 2006;124 doi: 10.1063/1.2198802. [DOI] [PubMed] [Google Scholar]


