

Abstract
Purpose
To accurately identify gene expression alterations that differentiate neoplastic from normal prostate epithelium using an approach that avoids contamination by unwanted cellular components and is not compromised by acute gene expression changes associated with tumor devascularization and resulting ischemia.
Experimental Design
Approximately 3,000 neoplastic and benign prostate epithelial cells were isolated using laser capture microdissection from snap-frozen prostate biopsy specimens provided by 31 patients who subsequently participated in a clinical trial of preoperative chemotherapy. cDNA synthesized from amplified total RNA was hybridized to custom-made microarrays comprised of 6200 clones derived from the Prostate Expression Database. Expression differences for selected genes were verified using quantitative RT-PCR.
Results
Comparative analyses identified 954 transcript alterations associated with cancer (q value <0.01%) including 149 differentially expressed genes with no known functional roles. Gene expression changes associated with ischemia and surgical removal of the prostate gland were absent. Genes up-regulated in prostate cancer were statistically enriched in categories related to cellular metabolism, energy utilization, signal transduction, and molecular transport. Genes down-regulated in prostate cancers were enriched in categories related to immune response, cellular responses to pathogens, and apoptosis. A heterogeneous pattern of AR expression changes was noted. In exploratory analyses, AR down regulation was associated with a lower probability of cancer relapse after neoadjuvant chemotherapy followed by radical prostatectomy.
Conclusions
Assessments of tumor phenotypes based on gene expression for treatment stratification and drug targeting of oncogenic alterations may best be ascertained using biopsy-based analyses where the effects of ischemia do not complicate interpretation.
Keywords: prostate cancer, needle biopsy, microdissection, gene expression
Introduction
Prostate cancer is the most common invasive malignancy diagnosed in American men. In 2008, an estimated 186,320 men will be diagnosed with prostate cancer, of which 28,660 will die of their disease (1). The clinical course of prostate cancer is characterized by histological and clinical heterogeneity that substantially complicates medical decision making. Nomograms that incorporate the serum PSA, clinical stage, biopsy Gleason score, and other pathologic variables obtained at prostatectomy have been used to predict clinical outcomes (2-5). However, tools that rely on clinical variables are unable to fully account for the biologic and consequent clinical heterogeneity of the disease. It is increasingly clear that to improve our understanding of the clinical outcomes in prostate cancer; we must characterize the molecular makeup of this disease. High-throughput approaches that profile tissue transcriptomes or proteomes are particularly promising. Unlike individual biomarkers, these methods exploit the complexity and heterogeneity of molecular features that underlie the pathologic and clinical phenotype.
Characterization of expressed genes using cDNA or oligonucleotide microarrays represents a high-throughput method for assessing the molecular complexity of tumors. Gene expression profiles have been acquired for a broad spectrum of malignancies to identify determinants of disease outcome and characterize pathway-based targets for therapy (6-10). An important step towards the development of prognostic and predictive tools for prostate carcinoma is the accurate characterization of the molecular composition of the prostate gland and the identification of gene expression alterations that differentiate neoplastic from normal prostate epithelium. To achieve this objective, microarrays have been used to characterize prostate cancers and provide gene expression correlations that identify those men who may be more likely to recur following surgery or radiation as well as identify novel targets for therapy (11-26). The vast majority of these analyses employed gross dissection to attempt to enrich the specimens for cell types of interest. This approach inevitably retains some contamination by unwanted cellular components. The variability of cell type representation in such studies demands larger sample sizes capable of distinguishing signal from noise, and necessitates some type of secondary step to verify expression in the cell type of interest. To date, we are aware of five studies reporting analyses of prostate cancer gene expression that used cell type-specific acquisition methods to more specifically examine individual cellular compartments (13, 24, 26-28). Of these, one (24) compared prostate cancer only to BPH and dysplasia, without including normal tissue for comparison. A critical limitation of cell type-specific analyses is the acquisition of cell numbers in relatively small quantities such that some type of amplification system is required.
To date, all reported studies using microarray-based methods to assess gene expression changes in the human prostate cancer have used tissues acquired from radical prostatectomy specimens, organ donors, or TURP specimens. Despite the advantage of obtaining large quantities of materials, these acquisition methods are compromised by significant limitations. The transcriptional and translational programs comprising the gene expression signatures in any tissue are a reflection of both acute and chronic alterations in the host micro- and macro-environment. For example, we have previously shown that the process of surgical manipulation can influence the expression of genes associated with ischemia and hypoxia following devascularization (29). In this context, few published studies disclose the time between devascularization, sample collection, and freezing. Further, for pre-treatment prognostic analyses, or for stratifying patients for adjuvant therapies based on specific alterations in oncogenenic pathways, data from prostate biopsies rather than prostatectomy specimens are needed.
To the best of our knowledge, gene expression of human prostate cancer and adjacent benign epithelium obtained through prostate biopsies has not been reported. This study was undertaken to establish the feasibility, utility and results of profiling transcripts in prostate tissues sampled by trans-rectal ultrasound-guided needle biopsy. Importantly, specimens were frozen immediately at the time of the biopsy avoiding artifacts due to hypoxia. We generated profiles quantitating transcripts expressed in microdissected phenotypically normal and neoplastic prostate epithelium. Comparative analyses between these cell types identified 954 transcript alterations associated with cancer (q value <0.01%) including several tumor-associated alterations reported in previous studies using unamplified RNA acquired from prostate cancers, thus validating the methods used for cell type-specific analyses. The cancer-associated profiles include 149 differentially expressed genes with no known functional roles, a finding that provides a rich resource for future efforts to define mechanisms mediating tumorigenesis. An important observation supporting the use of needle biopsy materials for studies of prostate gene expression was the absence of a gene expression changes previously associated with the process of ischemia and surgical removal of the prostate gland. Thus, assessments of tumor phenotypes based on gene expression for treatment stratification and drug targeting of oncogenic alterations may best be ascertained using biopsy-based analyses.
Materials and Methods
Patients
Between January 2001 and November 2004, 57 patients with high-risk localized prostate cancer (defined a cT2b or T3a or PSA ≥ 15 ng/ml or Gleason grade ≥ 4+3) were recruited for a phase II clinical trial of neoadjuvant chemotherapy (using docetaxel and mitoxantrone). The design of the clinical trial has been previously described (30). The study was approved by the Institutional Review Boards of the Oregon Health & Science University, Portland VA Medical Center, Kaiser Permanente Northwest Region, Legacy Health System, and the University of Washington and all patients provided signed informed consent.
Specimen collection, specimen processing and laser capture microdissection
From each patient, ten standard prostate biopsies (bilateral at the apex, bilateral medial and lateral at mid-gland, bilateral medial and lateral at the base of the gland) were obtained under ultrasound guidance and placed in a Cryomold. After covering the tissue with OCT, the Cryomold is immersed in isopentane that had been pre-cooled to a viscous state in liquid nitrogen. This process, which freezes the tissue within seconds, minimizes artifacts resulting from the Leidenfrost effect. Biopsy material from thirty-one representative patients was used for gene expression profiling. Frozen sections (7 μM) were cut from biopsy tissue frozen in OCT blocks, stained with Mayer's hematoxylin (Sigma, St. Louis, MO), dehydrated in 100% ethanol and xylene, and used for laser-capture microdissection (LCM) using an Arcturus PixCell II microscope (Molecular Devices, Sunnyvale, CA). To evaluate cell type-specific gene expression, benign epithelium and neoplastic epithelium were captured separately (∼3,000 cells of each phenotype) and placed into 20 μl of sample lysis buffer (Molecular Devices) following the manufacturer's protocol. The histology of captured cells was verified both by review of a hematoxylin- and eosin-stained frozen section from each frozen tissue block and review of the images taken of the section from which the cells were obtained at 2 time points: a) after laser pulse but before removal of cells; and b) after removal of the cap and captured cells from the section (Supplemental Figure 1). All LCM images were reviewed and assigned a Gleason pattern score for neoplastic epithelium by a pathologist (LT).
RNA Amplification and cDNA Microarray Hybridization
Total RNA was extracted from captured epithelium using a Picopure RNA isolation kit according to the manufacturer's instructions (Molecular Devices). Extracted RNA underwent two rounds of amplification by a linear T7-RNA polymerase method developed by Eberwine et al. (31) using a MessageAMP aRNA kit (Applied Biosystems/Ambion, Austin, TX). The quality of amplified RNA was checked by gel electrophoresis to ensure adequate size ranges of the amplified RNA products (200-600 bps following two rounds of amplification). cDNA was separately synthesized from 3 μg of aRNA amplified from benign and neoplastic epithelium in a reaction volume of 30 μl containing 5 μg random hexamers (Invitrogen, Carlsbad, CA); 0.5 mM each of dATP, dCTP, dGTP; 0.3 mM dUTP; 0.2 mM aminoallyl-dUTP (Sigma, St. Louis, MO); and 380 units of Superscript II reverse transcriptase (Invitrogen). Reactants were incubated at 42°C for 120 min followed by the hydrolysis of RNA in 0.2N NaOH at 65°C for 15 minutes and neutralized by pH7.4Tris-Cl. cDNA was cleaned using a Microcon 30 filter (Millipore, Bedford, MA) to remove primers and salts followed by coupling to Cy3 and Cy5 fluorescent dyes (Amersham Bioscience, Piscataway, NJ). In order to eliminate potential dye bias, we randomly alternated Cy3 and Cy5 labeling to neoplastic and benign epithelium across 31 samples. Labeled cDNA probes were hybridized in a head-to-head fashion, normal versus neoplastic from the same individual, simultaneously to custom-made microarrays comprised of 6760 clones derived from the Prostate Expression DataBase (PEDB), a public sequence repository of Expressed Sequence Tag (EST) data derived from human prostate cDNA libraries (32). Microarrays were constructed as described previously with each cDNA represented twice per array (28). Following probe addition, coverslips were applied and microarrays were incubated at 63°C for 16 hours in a humid hybridization chamber. Unbound probe was removed through washes with gradients of SSC buffer.
Gene Expression Analysis
Fluorescent array images were collected for both Cy3 and Cy5 emissions using a GenePix 4000B fluorescent scanner (Molecular Devices) and GenePix Pro 4.1 software was used to grid and extract image intensity data. Spots of poor quality as determined by visual inspection, were removed from further analysis. Normalization of the Cy3 and Cy5 fluorescent signal on each array was done using Silicon Genetics GeneSpring 7.3 software (Agilent Technologies, Santa Clara, CA.) A print tip–specific Lowess curve was fit to the background subtracted log-intensity versus log-ratio plot and 20.0% of the data was used to calculate the Lowess fit at each point. This curve was used to adjust the control value for each measurement. If the control channel was lower than 10, then 10 was used instead. Normalized log2-ratios from the replicated cDNA spots on each PEDB chip were averaged and used for subsequent analysis. Data were filtered to remove values from poorly hybridized cDNAs with average intensity levels less than 300 as well as spots not present in greater than 25% of the arrays reducing the initial list of clones from 6720 to 5910 for further analysis.
To compare the overall expression patterns of all neoplastic samples relative to their patient matched normal epithelium, log2 ratio measurements were statistically analyzed using the SAM procedure1 (33). A permutated one-sample t-test was used to determine whether the mean gene expression of neoplastic cell samples differed from normal epithelium with a significance selection threshold given a moderate estimate of false positive genes (false discovery rate (FDR) < 0.01%). These results were reduced to 3270 known, unique genes by eliminating all but the highest scoring clone for each gene.
In order to assess the similarity of our results to other published prostate tumor studies (15, 28, 34), we calculated the overlap between top ranking genes. Affimetrix microarray data were normalized by using R (www.r-project.org) and the RMA procedure in the Bioconductor (www.bioconductor.org) package. Spotted cDNA microarray data (15, 28) were Lowess normalized using GeneSpring 7.3 software and all data sets were filtered as described above. Gene expression changes between cancer and benign samples were assessed with SAM using a one-sample t-test for the True, et al. data, a paired, two-sample t-test for the Lapointe, et al. data and an unpaired, two-sample t-test for the Glinsky, et al. data. Results from each dataset were reduced to unique genes as described above and merging was performed by matching Entrez Gene GeneIDs. There were 2140 genes common to all 4 datasets which were individually ranked by their t-test scores and overlaps of the top 1%, 5% and 10% of genes differentially expressed between benign and cancer were calculated.
To determine whether the expression changes observed in prostate cancers were enriched for genes with specific cellular functions, cDNA array results were subjected to over-representation analysis using EASE v2.02 (35). For this analysis, Gene Ontology,3 KEGG4and GenMAPP5 databases were queried. An FDR statistic was computed to adjust for multiple hypothesis testing, with an FDR of < 5% considered significant.
To establish the presence or absence of ischemia-induced gene changes in biopsy samples from this study, signal intensity levels of the top twenty genes identified to be up-regulated as a direct result of devascularization during surgery (29) were inspected and compared using two-sample t-tests to biopsy and surgical samples in the ischemia study (29) and the True, et al. amplified, laser-captured surgical samples (28).
Kaplan-Meier analysis was utilized to stratify relapse-free survival of patients exhibiting differences in AR mRNA expression between cancer and benign prostate epithelium. Curves were statistically compared using a Wilcoxon test.
Quantitative Reverse Transcription PCR
cDNA was generated from 1 μg aRNA using 2 μg random hexamers for priming reverse transcription by SuperScript II (200 U per reaction; Invitrogen). Primers and salts were removed using a PCR product isolation kit (Qiagen, Valencia, CA). Quantitative reverse transcription PCR (qRTPCR) reactions were done in triplicate, using approximately 5 ng of cDNA, 0.2 μM of each primer, and SYBR Green PCR master mix (Applied Biosystems, Foster City, CA) in a 20 μl reaction volume. Reactions were carried out and analyzed using an Applied Biosystems 7700 sequence detector. Samples were normalized to the cycle threshold value obtained during the exponential amplification of GAPDH.
Results
Patients and Samples
The characteristics of all 57 patients who participated in this study are summarized in Supplemental Table 1. Of these, 31 subjects contributed biopsy specimens to this analysis. Their age and pathologic characteristics are summarized in Supplemental Table 2. For each cancer, we attempted to capture cells of a single differentiation state, for example, Gleason pattern 3, Gleason pattern 4 or Gleason pattern 5. In some cases, the Gleason scores of captured neoplastic epithelium differed from that reported from the entire biopsy (Supplemental Table 2), reflecting the heterogeneity of prostate cancer found in these individuals as sampled by random TRUS-guided biopsies.
Gene Expression Alterations in Prostate Carcinoma
To identify gene expression changes associated with prostate cancer we compared transcript abundance levels in microdissected benign epithelium with microdissected neoplastic epithelium by head-to-head hybridization on cDNA microarrays enriched for genes expressed in the human prostate gland (32). Consistent cancer-associated differences were identified using a one-class t-test at a false discovery rate (q-value) less than 0.01%. Overall, clear and consistent gene expression differences were observed between the microdissected benign and cancerous epithelium with 457 genes up-regulated and 497 genes down-regulated in neoplastic relative to benign cells (Supplemental Figure 2).
Differential expression levels for several genes altered in this analysis were in agreement with results from previously published gene expression studies of prostate cancer that used amplified laser-capture microdissected cells from surgical samples as well as unamplified RNA extracted from bulk prostate cancer tissue (Supplemental Table 3). Genes comprising the top 1% of differentially expressed transcripts in our study also ranked in the top 10% of differentially expressed genes in the three published datasets we evaluated. Interestingly, the highest overlap was observed for the LCM surgical samples on the same platform of arrays (True, et al.) with the lowest overlap between this study and the Glinksy et al dataset comprised of bulk tissue from surgical samples on Affymetrix arrays. Specifically, we detected up-regulation of hepsin in neoplastic epithelium in 29 of the 31 patients, AMACR in 30 of the 31 patients (Figure 1) (36, 37). A reduction in glutathione S-transferase pi expression was measured in neoplastic epithelium for 24 of the 31 patients, a finding also consistent with previous studies (38). The oncogene ERG was recently found to be overexpressed in prostate cancer epithelia relative to benign epithelial, (38) and we also detected overexpression of ERG in the cancerous epithelium of 90% of the patients in this study.
Figure 1.
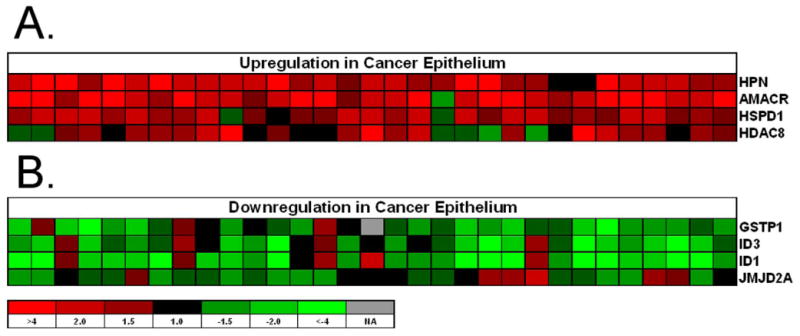
The heatmap of selective genes that either have been reported to exhibit differential expression in prostate cancer (AMACR, Hepsin and GSPP1) or represent a new observation (ID1 JMJD2A). A, upregulation. B, downregulation. Red: upregulated in tumor; Green: downregulated in tumor. Row: genes; Column: patients.
Comparison of transcript levels of known ischemia-induced genes established the absence of these gene expression changes in biopsy samples from this study (Supplemental Figure 3). All biopsy versus surgical comparisons resulted in two-sample t-test p-values <0.005, whereas biopsy versus biopsy and surgical versus surgical comparisons p-values were >0.3. These results indicate that the prostate needle biopsies collected under the tissue acquisition protocol utilized in this clinical trial have good quality RNA, and the microdissection, amplification, and microarray methods yield reproducible results suitable for quantitative transcript analyses.
Of the differentially expressed transcripts between benign and neoplastic prostate epithelium, 149 have no known defined functional role. Several transcripts exhibit substantial differences in gene expression of up to 3-fold. Further, several genes are located in chromosomal regions shown to be amplified or deleted in prostate cancers, and thus represent candidate effectors of these genomic events.
Pathway Alterations
To assess whether the breadth of gene expression alterations in prostate cancers associated with particular cellular processes, we determined if any Gene Ontology, KEGG, or GenMAPP pathways were over represented using EASE v2.0. Of >1000 annotated categories, we found genes up-regulated in prostate cancer were statistically enriched in 25 categories, primarily related to cellular metabolism, energy utilization, signal transduction, and molecular transport. Genes down-regulated in prostate cancers were enriched in 27 categories that primarily comprised immune response, cellular responses to pathogenes, and apoptosis (Table 1).
Table 1.
Gene set enrichment analysis of the expression differences between tumor and adjacent normal epithelium
| GO categories significantly enriched in gene set up-regulated in cancer with q-value <0.01% compared to all genes tested | |||
|---|---|---|---|
| System | Gene Category | EASE score | FDR |
| GO Biological Process | intracellular protein transport | 0.0003 | <0.001 |
| GO Biological Process | protein folding | 0.0003 | <0.001 |
| GO Biological Process | protein transport | 0.0007 | <0.001 |
| GO Biological Process | small GTPase mediated signal transduction | 0.0014 | <0.001 |
| KEGG pathway | Carbohydrate Metabolism - Homo sapiens | 0.0020 | <0.001 |
| GO Cellular Component | cytoplasm | 0.0023 | <0.001 |
| GO Molecular Function | chaperone activity | 0.0024 | <0.001 |
| GO Molecular Function | protein transporter activity | 0.0059 | <0.001 |
| GO Biological Process | intracellular transport | 0.0061 | <0.001 |
| GO Biological Process | protein targeting | 0.0067 | <0.001 |
| GO Molecular Function | hydrolase activity, acting on GTP, involved in cellular and subcellular movement | 0.0092 | <0.001 |
| GO Molecular Function | extracellular matrix structural constituent | 0.0096 | <0.001 |
| GO Molecular Function | small monomeric GTPase activity | 0.0103 | <0.001 |
| KEGG pathway | Carbon fixation - Homo sapiens | 0.0103 | <0.001 |
| GO Biological Process | protein-mitochondrial targeting | 0.0104 | <0.001 |
| GO Biological Process | cotranslational membrane targeting | 0.0107 | <0.001 |
| GO Molecular Function | ligase activity\, forming phosphoric ester bonds | 0.0108 | <0.001 |
| GenMAPP pathway | Hs_Glycolysis and Gluconeogenesis | 0.0111 | <0.001 |
| GO Molecular Function | GTPase activity | 0.0157 | <0.001 |
| GO Cellular Component | mitochondrial ribosome | 0.0186 | <0.001 |
| GO Cellular Component | collagen | 0.0186 | <0.001 |
| GO Cellular Component | organellar ribosome | 0.0186 | <0.001 |
| GO Cellular Component | intracellular | 0.0292 | <0.001 |
| KEGG pathway | Glycolysis / Gluconeogenesis - Homo sapiens | 0.0385 | <0.001 |
| KEGG pathway | Purine metabolism - Homo sapiens | 0.0486 | <0.001 |
| GO categories significantly enriched in gene set down-regulated in cancer with q-value <0.01% compared to all genes tested | |||
| System | Gene Category | EASE score | FDR |
| GO Biological Process | immune response | 0.0009 | <0.001 |
| GO Biological Process | defense response | 0.0011 | <0.001 |
| GO Molecular Function | transmembrane receptor activity | 0.0018 | <0.001 |
| GO Biological Process | response to bacteria | 0.0021 | <0.001 |
| GO Biological Process | response to pathogenic bacteria | 0.0021 | <0.001 |
| GO Biological Process | response to pest/pathogen/parasite | 0.0033 | <0.001 |
| GO Cellular Component | integral to membrane | 0.0038 | <0.001 |
| GO Biological Process | response to biotic stimulus | 0.0055 | <0.001 |
| GO Molecular Function | hematopoietin/interferon-class (D200-domain) cytokine receptor activity | 0.0056 | <0.001 |
| GO Cellular Component | integral to plasma membrane | 0.0066 | <0.001 |
| GO Molecular Function | DNA binding | 0.0068 | <0.001 |
| GO Biological Process | cell death | 0.0072 | <0.001 |
| GO Biological Process | cellular process | 0.0080 | <0.001 |
| GO Biological Process | death | 0.0083 | <0.001 |
| GO Biological Process | programmed cell death | 0.0108 | <0.001 |
| GO Biological Process | apoptosis | 0.0108 | <0.001 |
| KEGG pathway | Metabolism of Other Amino Acids - Homo sapiens | 0.0121 | <0.001 |
| GO Molecular Function | receptor activity | 0.0159 | <0.001 |
| GO Cellular Component | transcription factor complex | 0.0229 | <0.001 |
| KEGG pathway | Apoptosis - Homo sapiens | 0.0265 | <0.001 |
| GenMAPP pathway | Hs_Apoptosis | 0.0270 | <0.001 |
| KEGG pathway | Cell Growth and Death - Homo sapiens | 0.0408 | <0.001 |
| KEGG pathway | Glutathione metabolism - Homo sapiens | 0.0620 | <0.001 |
| GenMAPP pathway | Hs_Ovarian Infertility Genes | 0.1174 | <0.001 |
| GO Biological Process | negative regulation of cell cycle | 0.0241 | 0.0357 |
| GO Biological Process | transition metal ion transport | 0.0226 | 0.0385 |
| GO Biological Process | regulation of apoptosis | 0.0189 | 0.0417 |
Confirmation of Cell Type-Specific Transcript Alterations by qRT-PCR
To confirm gene expression changes in cancerous epithelium identified by microarray analysis, we used quantitative RT-PCR. Quantitative real-time PCR for AMACR confirmed the differential expression on PEDB array excepting one sample, which yielded converse findings. ID1 in endothelial cells acts as an endogenous tumor angiogenesis promoter, but its function in the epithelial compartment during oncogenesis is less clear (39). We measured and compared the transcript levels of ID1 and ID3 in the isogenic hosts of our current study. The microarray results indicated significant down regulation for both genes (Figure 1), and the subsequent qRT-PCR using the cDNA from the same set of patients confirmed this observation (Figure 2). Significantly lower ID1 and ID3 gene expression was seen in prostate cancer epithelium compared with the adjacent benign counterpart (40) (Figure 2).
Figure 2.

The downregulation of tumor ID1 and ID3 mRNA was confirmed by Real-time qRT-PCR in paired tumor and benign epithelial cDNA from 31 patients. ΔCT was calculated as the difference of cycle threshold value (CT) of ID1 and ID3 relative to the CT value of GAPDH. For both genes, p < 0.001, paired-t test.
Exploratory Analyses of Androgen Receptor Gene Expression
Androgen receptor expression has been associated with the progression of prostate cancer. Previous studies using immunostaining of surgical tissues have seen AR protein expression/amplification in lymph node and bone metastasis, and the immunoreactivity of AR in lymph node has predictive values of disease outcome after surgery (41-43). In the current study, we compared the AR mRNA transcript levels between cancer and benign epithelium of the same host isolated by LCM of needle biopsy prior to neoadjuvant therapy and surgery. Overall, there was a slight (not statistically significant) down regulation of AR mRNA in cancer epithelium relative to benign epithelium (Figure 3). Fourteen of 31 patients had AR down regulation (> 1 fold) in their cancer cells compared with benign, 8 patients had AR up regulation (> 1 fold) in the cancer epithelium, and 10 had no change (< 1 fold of change). AR up-reguation appeared to segregate with the presence of lymph node metastases and with early PSA relapse. Six patients presented with persistent lymph node metastases after chemotherapy, and 4 out of 6 had AR up-regulation in cancer epithelium compared to their matched benign controls. The remaining two node positive patients had no difference in AR gene expression. With a median follow up of 30 months, 11 patients have had a PSA relapse (PSA ≥ 0.4 ng/ml). Of these 9 of 11 had either AR up-regulation (n=4) or no change (n=5). This pattern appears to be distinct from the pattern seen in the overall group. Kaplan-Meier analysis of relapse-free survival by AR mRNA expression between cancer and benign prostate epithelium determined a statistically significant benefit (p < 0.03, wilcoxon test) for patients with AR down regulation (Supplemental Figure 4). In contrast to AR, the PSA mRNA transcript level had no correlation to the status of lymph node metastasis and relapse.
Figure 3.

The mRNA level of androgen receptor in paired tumor and benign epithelium from 31 patients was measured by qRT-PCR. P = 0.103, paired-t test.
We also evaluated the mRNA levels of several transcriptional co-factors that have been reported to be associated with AR. JMJD1A (JHDM2A), JMJD2C, LSD1 are histone demethylases facilitating AR and androgen dependent transcriptional activation (44-46). LSD1 overexpression has been associated with prostate cancer progression in a clinical study (47). Within our patient group, JMJD1A and LSD1 expression was slightly decreased in cancer epithelium (Figure 4), however, expression levels were not associated with the expression of PSA or with disease relapse (data not shown).
Figure 4.

The mRNA levels of three AR associated histone demethylase genes in 31 patients' cancer and adjacent benign epithelium were compared by qRT-PCR. ΔCT was calculated as the difference of cycle threshold value (CT) of JMJD1A, JMJD2C and LSD1 relative to the CT value of GAPDH. The p values (indicated in the graph) were calculated by paired-t test.
Discussion
To our knowledge, this is the first study to compare the gene expression profile of prostate cancer and adjacent normal epithelium obtained from biopsies and untainted by hypoxic effects or other influences associated with a major surgical procedure. Thus, we suspect that these data represent the closest available approximation to the gene expression of human prostate cancer in vivo.
Overall, clear and consistent gene expression differences were observed between the microdissected benign and cancerous epithelium with 457 genes up-regulated and 497 genes down-regulated in cancer relative to benign. A large component of gene expression changes in neoplastic epithelial cells functionally associated with cell cycle/apoptosis, proliferation, metabolism, immune response and signal transduction. Further study is needed to determine if biopsy gene expression profiles can aid in prognosis and therapy selection.
In a series of in vitro studies, the ID1 protein has been functionally linked to the growth and survival of prostate cancer cells (48-52). However, in the current study, we measured significantly lower ID1 transcripts in cancer epithelium. These gene expression results complement a published immunohistochemical study of ID1 (40), in which epithelial ID1 protein was detectable only in the benign epithelium that was adjacent to the prostate adenocarcinoma, but undetectable in epithelium of normal prostate, benign prostatic hyperplasia and prostate adenocarcinoma. Taken together these results suggest that the ID1 may have an oncogenic function during the prostate cancer initiation stage, while the functional significance of the loss of expression maybe more relevant during tumor progression. A similar model is seen in the development of melanoma, in which ID1 expression is transient and occurs during the early transition stage in the radial growth phase of melanoma cells (53).
The immunohistochemical analysis of AR protein in surgical tissues has been reported to have predictive value in terms of cancer recurrence. However, the assessment of immunoreactivity of AR in tissue IHC staining suffers from the lack of quantitation and internal controls. In the current study, we used needle biopsy samples from patients that were naïve to therapy, and therefore, the AR gene expression reflects the native disease state. Through our rapid frozen protocol, we maximally reduced ex vivo changes associated with specimen handling. We compared the AR mRNA transcript levels of the same patient between his tumor and adjacent benign epithelium using housekeeping gene transcripts as internal controls. We determined a correlation between AR down regulation in tumor cells and a lower risk of recurrence, a finding that should be examined in larger studies that incorporate multivariable analyses to determine if AR expression can independently aid in outcome prediction.
The chromatin histone demethylase enzymes such as JHDM2A, JMJD2C, and LSD1 represent a novel family of AR transcriptional co-factors. Theoretically, the increased expression and / or activity of these co-activating enzymes can promote androgen independent AR activity, and facilitate the transactivation of AR target genes. For example, histone acetyltransferase protein p300 is robustly expressed in most prostate cancer cells, and functionally, it has been shown to increase the acetylation of both AR and AR associated chromatin histones during AR target gene transcription. Subsequently, the inhibition of p300 has been shown to reduce androgen independent AR transcription. In the case of histone demethylase, increased LSD1 gene and protein expression in prostate cancer patients have previously been associated with the Gleason score and disease recurrence. However, in the current study, the mRNA transcripts (JHDM2A and LSD1) of these enzymes were down regulated in the cancer epithelium compared to the adjacent benign controls. There was not a clear association between the differential expression and disease recurrence. On the molecular level, the mechanisms regulating the expression and activity of these enzymes during prostate cancer development are unknown. The functions of these enzymes within the context of AR transactivation and prostate cancer progression have only been studied on a very limited basis. Therefore, mechanistic investigations of these enzymes in both normal and cancerous prostate biology are urgently needed.
Accurate molecular characterization of tumors is important for the development of novel therapeutics. As broad spectrum drugs comprising cytotoxic chemotherapy are supplemented or supplanted by drugs that specifically alter the signals of individual targets, it is increasingly important to be able to accurately pinpoint the molecular abnormalities associated with neoplastic transformation in individual patients. This effort illustrates how individual cellular compartments can be molecularly interrogated using methods that limit artifacts introduced by sample handling.
Statement of Translational Relevance
Accurate molecular characterization of tumors is important for progress in the development of novel therapeutics. As broad spectrum drugs like cytotoxic chemotherapy are supplemented or supplanted by drugs that specifically alter the signals of individual targets, it is increasingly important to be able to accurately pinpoint the molecular abnormalities associated with neoplastic transformation in individual patients. This effort illustrates how individual cellular compartments can be molecularly interrogated using methods that limit artifacts introduced by sample handling.
Supplementary Material
Acknowledgments
We gratefully acknowledge funding support from the National Institutes of Health - National Cancer Institute grant 5R01CA119125, a career development award and research support from the Pacific Northwest Prostate Cancer SPORE CA97186, a fellowship award from the Department of Defense PC050489, sanofi-aventis 16080, OSI Pharmaceuticals 031.G0008, and Thomas and Gun Denhart.
Footnotes
References
- 1.Jemal A, Siegel R, Ward E, et al. Cancer statistics, 2008. CA Cancer J Clin. 2008;58:71–96. doi: 10.3322/CA.2007.0010. [DOI] [PubMed] [Google Scholar]
- 2.Kattan MW, Eastham JA, Stapleton AM, Wheeler TM, Scardino PT. A preoperative nomogram for disease recurrence following radical prostatectomy for prostate cancer. J Natl Cancer Inst. 1998;90:766–71. doi: 10.1093/jnci/90.10.766. [DOI] [PubMed] [Google Scholar]
- 3.Kattan MW, Cowen ME, Miles BJ. A decision analysis for treatment of clinically localized prostate cancer. J Gen Intern Med. 1997;12:299–305. doi: 10.1046/j.1525-1497.1997.012005299.x. [DOI] [PMC free article] [PubMed] [Google Scholar]
- 4.Kattan MW, Wheeler TM, Scardino PT. Postoperative nomogram for disease recurrence after radical prostatectomy for prostate cancer. J Clin Oncol. 1999;17:1499–507. doi: 10.1200/JCO.1999.17.5.1499. [DOI] [PubMed] [Google Scholar]
- 5.Partin AW, Kattan MW, Subong EN, et al. Combination of prostate-specific antigen, clinical stage, and Gleason score to predict pathological stage of localized prostate cancer. A multi-institutional update [see comments] [published erratum appears in JAMA 1997 Jul 9;278:118] Jama. 1997;277:1445–51. [PubMed] [Google Scholar]
- 6.Perou CM, Sorlie T, Eisen MB, et al. Molecular portraits of human breast tumours. Nature. 2000;406:747–52. doi: 10.1038/35021093. [DOI] [PubMed] [Google Scholar]
- 7.Beer DG, Kardia SL, Huang CC, et al. Gene-expression profiles predict survival of patients with lung adenocarcinoma. Nat Med. 2002;8:816–24. doi: 10.1038/nm733. [DOI] [PubMed] [Google Scholar]
- 8.Bhattacharjee A, Richards WG, Staunton J, et al. Classification of human lung carcinomas by mRNA expression profiling reveals distinct adenocarcinoma subclasses. Proc Natl Acad Sci U S A. 2001;98:13790–5. doi: 10.1073/pnas.191502998. [DOI] [PMC free article] [PubMed] [Google Scholar]
- 9.Garber ME, Troyanskaya OG, Schluens K, et al. Diversity of gene expression in adenocarcinoma of the lung. Proc Natl Acad Sci U S A. 2001;98:13784–9. doi: 10.1073/pnas.241500798. [DOI] [PMC free article] [PubMed] [Google Scholar]
- 10.Soloway MS, Hardeman SW, Hickey D, et al. Strastification of patients with metastatic prostate cancer based on extent of disease on initial bone scan. Cancer. 1988;61:195–202. doi: 10.1002/1097-0142(19880101)61:1<195::aid-cncr2820610133>3.0.co;2-y. [DOI] [PubMed] [Google Scholar]
- 11.Bueno R, Loughlin KR, Powell MH, Gordon GJ. A diagnostic test for prostate cancer from gene expression profiling data. J Urol. 2004;171:903–6. doi: 10.1097/01.ju.0000095446.10443.52. [DOI] [PubMed] [Google Scholar]
- 12.Chaib H, Cockrell EK, Rubin MA, Macoska JA. Profiling and verification of gene expression patterns in normal and malignant human prostate tissues by cDNA microarray analysis. Neoplasia. 2001;3:43–52. doi: 10.1038/sj.neo.7900126. [DOI] [PMC free article] [PubMed] [Google Scholar]
- 13.Ernst T, Hergenhahn M, Kenzelmann M, et al. Decrease and gain of gene expression are equally discriminatory markers for prostate carcinoma: a gene expression analysis on total and microdissected prostate tissue. Am J Pathol. 2002;160:2169–80. doi: 10.1016/S0002-9440(10)61165-0. [DOI] [PMC free article] [PubMed] [Google Scholar]
- 14.Ishiguro H, Uemura H, Fujinami K, Ikeda N, Ohta S, Kubota Y. 55 kDa nuclear matrix protein (nmt55) mRNA is expressed in human prostate cancer tissue and is associated with the androgen receptor. Int J Cancer. 2003;105:26–32. doi: 10.1002/ijc.11021. [DOI] [PubMed] [Google Scholar]
- 15.Lapointe J, Li C, Higgins JP, et al. Gene expression profiling identifies clinically relevant subtypes of prostate cancer. Proc Natl Acad Sci U S A. 2004;101:811–6. doi: 10.1073/pnas.0304146101. [DOI] [PMC free article] [PubMed] [Google Scholar]
- 16.Latil A, Bieche I, Chene L, et al. Gene expression profiling in clinically localized prostate cancer: a four-gene expression model predicts clinical behavior. Clin Cancer Res. 2003;9:5477–85. [PubMed] [Google Scholar]
- 17.Lichtinghagen R, Musholt PB, Stephan C, et al. mRNA expression profile of matrix metalloproteinases and their tissue inhibitors in malignant and non-malignant prostatic tissue. Anti-cancer Res. 2003;23:2617–24. [PubMed] [Google Scholar]
- 18.Luo J, Dunn TA, Ewing CM, Walsh PC, Isaacs WB. Decreased gene expression of steroid 5 alpha-reductase 2 in human prostate cancer: implications for finasteride therapy of prostate carcinoma. Prostate. 2003;57:134–9. doi: 10.1002/pros.10284. [DOI] [PubMed] [Google Scholar]
- 19.Magee JA, Araki T, Patil S, et al. Expression profiling reveals hepsin overexpression in prostate cancer. Cancer Res. 2001;61:5692–6. [PubMed] [Google Scholar]
- 20.Rossi S, Graner E, Febbo P, et al. Fatty acid synthase expression defines distinct molecular signatures in prostate cancer. Mol Cancer Res. 2003;1:707–15. [PubMed] [Google Scholar]
- 21.Stephan C, Yousef GM, Scorilas A, et al. Hepsin is highly over expressed in and a new candidate for a prognostic indicator in prostate cancer. J Urol. 2004;171:187–91. doi: 10.1097/01.ju.0000101622.74236.94. [DOI] [PubMed] [Google Scholar]
- 22.Weigle B, Fuessel S, Ebner R, et al. D-GPCR: a novel putative G protein-coupled receptor overexpressed in prostate cancer and prostate. Biochem Biophys Res Commun. 2004;322:239–49. doi: 10.1016/j.bbrc.2004.07.106. [DOI] [PubMed] [Google Scholar]
- 23.Welsh JB, Sapinoso LM, Su AI, et al. Analysis of gene expression identifies candidate markers and pharmacological targets in prostate cancer. Cancer Res. 2001;61:5974–8. [PubMed] [Google Scholar]
- 24.Chen Z, Fan Z, McNeal JE, et al. Hepsin and maspin are inversely expressed in laser capture microdissectioned prostate cancer. J Urol. 2003;169:1316–9. doi: 10.1097/01.ju.0000050648.40164.0d. [DOI] [PubMed] [Google Scholar]
- 25.Dhanasekaran SM, Dash A, Yu J, et al. Molecular profiling of human prostate tissues: insights into gene expression patterns of prostate development during puberty. FASEB J. 2005;19:243–5. doi: 10.1096/fj.04-2415fje. [DOI] [PubMed] [Google Scholar]
- 26.Thelen P, Burfeind P, Grzmil M, Voigt S, Ringert RH, Hemmerlein B. cDNA microarray analysis with amplified RNA after isolation of intact cellular RNA from neoplastic and non-neoplastic prostate tissue separated by laser microdissections. Int J Oncol. 2004;24:1085–92. [PubMed] [Google Scholar]
- 27.Tomlins SA, Mehra R, Rhodes DR, et al. Integrative molecular concept modeling of prostate cancer progression. Nat Genet. 2007;39:41–51. doi: 10.1038/ng1935. [DOI] [PubMed] [Google Scholar]
- 28.True L, Coleman I, Hawley S, et al. A molecular correlate to the Gleason grading system for prostate adenocarcinoma. Proc Natl Acad Sci U S A. 2006;103:10991–6. doi: 10.1073/pnas.0603678103. [DOI] [PMC free article] [PubMed] [Google Scholar]
- 29.Lin DW, Coleman IM, Hawley S, et al. Influence of surgical manipulation on prostate gene expression: implications for molecular correlates of treatment effects and disease prognosis. J Clin Oncol. 2006;24:3763–70. doi: 10.1200/JCO.2005.05.1458. [DOI] [PubMed] [Google Scholar]
- 30.Beer TM, Garzotto M, Lowe BA, et al. Phase I study of weekly mitoxantrone and docetaxel before prostatectomy in patients with high-risk localized prostate cancer. Clin Cancer Res. 2004;10:1306–11. doi: 10.1158/1078-0432.ccr-1021-03. [DOI] [PubMed] [Google Scholar]
- 31.Van Gelder RN, von Zastrow ME, Yool A, Dement WC, Barchas JD, Eberwine JH. Amplified RNA synthesized from limited quantities of heterogeneous cDNA. Proc Natl Acad Sci U S A. 1990;87:1663–7. doi: 10.1073/pnas.87.5.1663. [DOI] [PMC free article] [PubMed] [Google Scholar]
- 32.Nelson PS, Pritchard C, Abbott D, Clegg N. The human (PEDB) and mouse (mPEDB) Prostate Expression Databases. Nucleic Acids Res. 2002;30:218–20. doi: 10.1093/nar/30.1.218. [DOI] [PMC free article] [PubMed] [Google Scholar]
- 33.Tusher VG, Tibshirani R, Chu G. Significance analysis of microarrays applied to the ionizing radiation response. Proc Natl Acad Sci U S A. 2001;98:5116–21. doi: 10.1073/pnas.091062498. [DOI] [PMC free article] [PubMed] [Google Scholar]
- 34.Glinsky GV, Glinskii AB, Stephenson AJ, Hoffman RM, Gerald WL. Gene expression profiling predicts clinical outcome of prostate cancer. J Clin Invest. 2004;113:913–23. doi: 10.1172/JCI20032. [DOI] [PMC free article] [PubMed] [Google Scholar]
- 35.Subramanian A, Tamayo P, Mootha VK, et al. Gene set enrichment analysis: a knowledge-based approach for interpreting genome-wide expression profiles. Proc Natl Acad Sci U S A. 2005;102:15545–50. doi: 10.1073/pnas.0506580102. [DOI] [PMC free article] [PubMed] [Google Scholar]
- 36.Rubin MA, Zhou M, Dhanasekaran SM, et al. alpha-Methylacyl coenzyme A racemase as a tissue biomarker for prostate cancer. JAMA. 2002;287:1662–70. doi: 10.1001/jama.287.13.1662. [DOI] [PubMed] [Google Scholar]
- 37.Rogers CG, Yan G, Zha S, et al. Prostate cancer detection on urinalysis for alpha methylacyl coenzyme a racemase protein. J Urol. 2004;172:1501–3. doi: 10.1097/01.ju.0000137659.53129.14. [DOI] [PubMed] [Google Scholar]
- 38.Petrovics G, Liu A, Shaheduzzaman S, et al. Frequent overexpression of ETS-related gene-1 (ERG1) in prostate cancer transcriptome. Oncogene. 2005;24:3847–52. doi: 10.1038/sj.onc.1208518. [DOI] [PubMed] [Google Scholar]
- 39.Benezra R, Rafii S, Lyden D. The Id proteins and angiogenesis. Oncogene. 2001;20:8334–41. doi: 10.1038/sj.onc.1205160. [DOI] [PubMed] [Google Scholar]
- 40.Perk J, Gil-Bazo I, Chin Y, et al. Reassessment of id1 protein expression in human mammary, prostate, and bladder cancers using a monospecific rabbit monoclonal anti-id1 antibody. Cancer Res. 2006;66:10870–7. doi: 10.1158/0008-5472.CAN-06-2643. [DOI] [PubMed] [Google Scholar]
- 41.Culig Z, Hobisch A, Hittmair A, et al. Expression, structure, and function of androgen receptor in advanced prostatic carcinoma. Prostate. 1998;35:63–70. doi: 10.1002/(sici)1097-0045(19980401)35:1<63::aid-pros9>3.0.co;2-i. [DOI] [PubMed] [Google Scholar]
- 42.Hobisch A, Culig Z, Radmayr C, Bartsch G, Klocker H, Hittmair A. Androgen receptor status of lymph node metastases from prostate cancer. Prostate. 1996;28:129–35. doi: 10.1002/(SICI)1097-0045(199602)28:2<129::AID-PROS9>3.0.CO;2-B. [DOI] [PubMed] [Google Scholar]
- 43.Hobisch A, Culig Z, Radmayr C, Bartsch G, Klocker H, Hittmair A. Distant metastases from prostatic carcinoma express androgen receptor protein. Cancer Res. 1995;55:3068–72. [PubMed] [Google Scholar]
- 44.Yamane K, Toumazou C, Tsukada Y, et al. JHDM2A, a JmjC-containing H3K9 demethylase, facilitates transcription activation by androgen receptor. Cell. 2006;125:483–95. doi: 10.1016/j.cell.2006.03.027. [DOI] [PubMed] [Google Scholar]
- 45.Metzger E, Wissmann M, Yin N, et al. LSD1 demethylates repressive histone marks to promote androgen-receptor-dependent transcription. Nature. 2005;437:436–9. doi: 10.1038/nature04020. [DOI] [PubMed] [Google Scholar]
- 46.Wissmann M, Yin N, Muller JM, et al. Cooperative demethylation by JMJD2C and LSD1 promotes androgen receptor-dependent gene expression. Nat Cell Biol. 2007;9:347–53. doi: 10.1038/ncb1546. [DOI] [PubMed] [Google Scholar]
- 47.Kahl P, Gullotti L, Heukamp LC, et al. Androgen receptor coactivators lysine-specific histone demethylase 1 and four and a half LIM domain protein 2 predict risk of prostate cancer recurrence. Cancer Res. 2006;66:11341–7. doi: 10.1158/0008-5472.CAN-06-1570. [DOI] [PubMed] [Google Scholar]
- 48.Di K, Ling MT, Tsao SW, Wong YC, Wang X. Id-1 modulates senescence and TGF-beta1 sensitivity in prostate epithelial cells. Biol Cell. 2006;98:523–33. doi: 10.1042/BC20060026. [DOI] [PubMed] [Google Scholar]
- 49.Ling MT, Lau TC, Zhou C, et al. Overexpression of Id-1 in prostate cancer cells promotes angiogenesis through the activation of vascular endothelial growth factor (VEGF) Carcinogenesis. 2005;26:1668–76. doi: 10.1093/carcin/bgi128. [DOI] [PubMed] [Google Scholar]
- 50.Ling MT, Wang X, Ouyang XS, et al. Activation of MAPK signaling pathway is essential for Id-1 induced serum independent prostate cancer cell growth. Oncogene. 2002;21:8498–505. doi: 10.1038/sj.onc.1206007. [DOI] [PubMed] [Google Scholar]
- 51.Ouyang XS, Wang X, Lee DT, Tsao SW, Wong YC. Over expression of ID-1 in prostate cancer. J Urol. 2002;167:2598–602. [PubMed] [Google Scholar]
- 52.Zhang X, Ling MT, Wang Q, et al. Identification of a novel inhibitor of differentiation-1 (ID-1) binding partner, caveolin-1, and its role in epithelial-mesenchymal transition and resistance to apoptosis in prostate cancer cells. J Biol Chem. 2007;282:33284–94. doi: 10.1074/jbc.M705089200. [DOI] [PubMed] [Google Scholar]
- 53.Ryu B, Kim DS, DeLuca AM, et al. Id1 expression is transcriptionally regulated in radial growth phase melanomas. Int J Cancer. 2007;121:1705–9. doi: 10.1002/ijc.22875. [DOI] [PubMed] [Google Scholar]
Associated Data
This section collects any data citations, data availability statements, or supplementary materials included in this article.