

Abstract
Cardiomyocytes from failing hearts exhibit spatially nonuniform or dyssynchronous sarcoplasmic reticulum (SR) Ca2+ release. We investigated the contribution of action potential (AP) prolongation in mice with congestive heart failure (CHF) after myocardial infarction. AP recordings from CHF and control myocytes were included in a computational model of the dyad, which predicted more dyssynchronous ryanodine receptor opening during stimulation with the CHF AP. This prediction was confirmed in cardiomyocyte experiments, when cells were alternately stimulated by control and CHF AP voltage-clamp waveforms. However, when a train of like APs was used as the voltage stimulus, the control and CHF AP produced a similar Ca2+ release pattern. In this steady-state condition, greater integrated Ca2+ entry during the CHF AP lead to increased SR Ca2+ content. A resulting increase in ryanodine receptor sensitivity synchronized SR Ca2+ release in the mathematical model, thus offsetting the desynchronizing effects of reduced driving force for Ca2+ entry. A modest nondyssynchronous prolongation of Ca2+ release was nevertheless observed during the steady-state CHF AP, which contributed to increased time-to-peak measurements for Ca2+ transients in failing cells. Thus, dyssynchronous Ca2+ release in failing mouse myocytes does not result from electrical remodeling, but rather other alterations such as T-tubule reorganization.
Introduction
In mammalian cardiomyocytes, contraction is triggered by a transient increase in intracellular [Ca2+]. This Ca2+ transient results from the temporal and spatial summation of Ca2+ sparks, which are the fundamental units of Ca2+ release from the sarcoplasmic reticulum (SR) (1). Evoked Ca2+ sparks are initiated when Ca2+ influx through L-type Ca2+ channels (LCCs) triggers the opening of clusters of SR Ca2+ release channels, ryanodine receptors (RyRs). This process, known as Ca2+-induced Ca2+ release (CICR), occurs at functional units called dyads where the membranes of the T-tubule network and the SR are in close proximity (≈12 nm (2,3)). The nearly simultaneous opening of sarcolemmal Ca2+ channels during the cardiac action potential (AP) ensures that Ca2+ sparks are triggered synchronously across healthy ventricular cardiomyocytes during the heartbeat.
Reduced cardiomyocyte contractility in human heart failure largely results from reduced magnitude of the Ca2+ transient. It is generally agreed that depletion of SR Ca2+ stores is an important contributor to the reduction in SR Ca2+ release (4). However, Ca2+ transients also rise more slowly in heart failure, which leads to the development of slower and weaker contractions in this condition (4,5). Although the mechanisms underlying slowing of Ca2+ release have not been carefully examined, we and others have reported that ventricular myocytes from failing hearts exhibit nonuniform or dyssynchronous Ca2+ release, which results in a slower spatially averaged Ca2+ transient (6–11). Dyssynchronous Ca2+ release is caused, at least in part, by loss and/or disorganization of T-tubules in failing myocytes (8–12). This results in the formation of orphaned clusters of ryanodine receptors, where Ca2+ release occurs only after diffusion of trigger Ca2+ from sites where T-tubules are present. However, we calculated that such changes accounted for only a fraction of the overall slowing of the Ca2+ transient (8), indicating a role of other unknown mechanisms.
Altered AP configuration may also contribute to nonuniform Ca2+ release in failing cardiomyocytes. APs in large mammals such as cat, rabbit, and human contain a notch during the early phase of repolarization which is critical in triggering synchronous opening of LCCs, and thus uniform Ca2+ release (13). Harris et al. (7) observed that this notch was lost in APs from failing feline ventricular myocytes, which promoted dyssynchronous Ca2+ release. Importantly, APs are also widely reported to be prolonged in heart failure, in both large and small animal models (4). It is unclear how such alterations affect Ca2+ release synchrony, particularly in animals such as mice which do not contain a notch during early repolarization. Complicating this issue is the fact that AP prolongation may modify SR Ca2+ content (5,14–17), and thus, RyR sensitivity. In this study, we propose that slowed repolarization during the prolonged AP in failing murine cardiomyocytes promotes dyssynchronous Ca2+ release, but that increased SR Ca2+ content offsets this effect. This hypothesis was investigated by developing and employing a three-dimensional computation model of the dyad in combination with experiments in isolated cardiomyocytes.
Materials and Methods
Animal care and cardiomyocyte isolation
Studies were performed in accordance with the Norwegian Animal Welfare Act, which conforms to National Institutes of Health guidelines (NIH publication No. 85-23, revised 1996). For some experiments, we employed a murine model of congestive heart failure (CHF) after myocardial infarction (5,8,18,19). Briefly, large infarctions were induced in anesthetized nine-week-old female C57BL/6 mice, while sham-operated (SHAM) mice underwent the same procedure without coronary artery ligation. At one week after surgery, post-MI mice which had developed CHF were selected, based on our previously reported echocardiographic criteria (18); left atrial diameter >2.0 mm and infarct size >40% of total left ventricular (LV) circumference. Animals selected by these criteria exhibit CHF characterized by congestion and markedly reduced overall cardiac function (5,18,19). After evaluation at one week, CHF was allowed to progress for an additional nine weeks (10 weeks post-MI) when animals were sacrificed.
Because the MI spanned most of the LV free wall in CHF hearts, myocytes were only isolated from the noninfarcted septum, as described previously (8). Care was taken to exclude the border zone. Septal myocytes from SHAM hearts served as controls in these experiments. For other experiments, cardiomyocytes were isolated from the entire LV of normal, 8–10-week-old C57BL/6 mice.
Experimental protocols and imaging
Myocytes were adhered to laminin-coated coverslips mounted in a perfusion chamber. Ca2+ transients were examined in cells incubated with 20 μM fluo-4 AM (Molecular Probes, Eugene, OR) for 30 min. In some experiments, Ca2+ transients were elicited by field stimulation (3 ms biphasic pulse, 50% above threshold) during perfusion with HEPES Tyrode solution containing (in mM): 140 NaCl, 1.0 CaCl2, 0.5 MgCl2, 5.0 HEPES, 5.5 glucose, 0.4 NaH2PO4, 5.4 KCl, pH 7.4, 22°C. SR Ca2+ content was assessed by rapidly switching the perfusion solution to one containing 10 mM caffeine and measuring the resulting Ca2+ transient.
Confocal fluorescence imaging of Ca2+ transients was performed with an LSM 510 scanning system (Zeiss, Jena, Germany), as described (8). Five-hundred-and-twelve pixel longitudinal line scans were recorded every 1.5 ms, and sequential scans were stacked to create two-dimensional figures with time in the x axis. A light-emitting diode indicated the start of the stimulus on a separate channel from the fluo-4 signal. In line-scan images, this stimulus signal appears as a vertical line 3 ms in duration.
Discontinuous voltage-clamp experiments (sample rate 8 kHz) were conducted with an Axoclamp-2B amplifier (Axon Instruments, Foster City, CA) using 1–2 MΩ pipettes. APs were recorded at 1 Hz, and representative examples were applied as voltage-clamp waveforms (5). In some experiments, Ca2+ transients were recorded after a train of 20 identical AP waveforms (1 Hz), whereas in other experiments cells were alternately stimulated with SHAM and CHF APs. Ca2+ influx during AP clamp was measured in Na+- and K+-free conditions (5). Transient outward current (ITO) was recorded under Na+- and Ca2+-free conditions (as described in section A in the Supporting Material). Current measurements are presented normalized to cell capacitance. Capacitance was calculated by integrating the current elicited during a voltage-clamp step from −70 mV to −80 mV.
Data analysis
Analysis of Ca2+ transients was performed using Image J (NIH), MATLAB (The MathWorks, Natick, MA), and SigmaPlot software (Systat Software, Point Richmond, CA). Resting fluorescence across the cell (F0) was calculated by pixel-by-pixel averaging of 20 consecutive line scans immediately before the stimulus. Each line-scan image was then divided by the F0 line to obtain normalized Ca2+ transients (F/F0). Ca2+ release synchrony was calculated by then thresholding the normalized line-scan image to the half-maximal fluorescence (F50) of the entire Ca2+ transient (8). An F50 profile was created for each cell indicating the first time at which F50 was reached along the scan line. The standard deviation of values in the F50 profile was defined as the dyssynchrony index.
Mean data are presented ±SE. Data comparisons were performed with two-tailed paired or unpaired t-tests. Statistically significant difference was accepted when P < 0.05.
Computational model of the dyad
We developed a three-dimensional computational model of the dyad. The dyadic cleft was modeled as a cylindrical disk (see Fig. S1 A in the Supporting Material), as has been done in other studies (20–22). The height of the disk represents the distance between the SR and T-tubule, ∼12 nm in healthy myocytes (2,3). Because recent data indicate that dyad size is highly variable (3,23), we conducted our simulations with dyads of two sizes: RyRs = 100 and RyRs = 25. To encompass 100 RyRs, the radius was set to 220 nm and for the smaller cleft, the radius was set to 110 nm. A ratio of 1:5 between the number of Ca2+ channels and RyRs determined the number of LCCs in a dyad. This ratio has also been employed previously in other modeling studies (24), and is in the range of what is measured experimentally (25). The RyRs were positioned in a highly regular two-dimensional lattice grid (26), as shown in Fig. S1 B.
The entire model was driven by an external dynamic voltage-clamp, using recorded APs from SHAM and CHF myocytes. For each type of simulation, we conducted 120 runs and recorded the time between the onsets of the triggering stimulus to the first RyR opening. The number of open LCCs during the clamp and total Ca2+ current through the open channels was calculated. The simulation was terminated after the first recorded RyR opening. Numerical methods for the solution of the continuous and discrete system are presented in sections C and D in the Supporting Material.
Continuous model
A continuous model for the ionic concentrations inside the cleft was employed. Two previous computational models of the dyadic cleft computed the trajectories of each Ca2+ ion in the cleft individually (24,27), using a random-walk model. The motivation for these investigators doing so was that there are too few Ca2+ ions inside the cleft to justify a continuous approximation of [Ca2+]. However, in a recent study we showed that it is not the average number of ions in the cleft that invalidates the use of a continuous model, but rather the in-flow rate of single Ca2+ ions compared to the binding rate to single receptors in the cleft (22). In the case of the dyadic cleft, where the binding rates are indeed small compared to the in-flow rates (22), we could use a continuous approximation of the [Ca2+] if we also employed stochastic models for binding of single ions to receptors in the cleft. The electro-diffusional process in the dyadic cleft was modeled by an advection-diffusion partial differential equation (see section B in the Supporting Material). The diffusion constant for Ca2+ was set to 2.2 × 10⁵ nm2 ms−1.
We used two different types of boundary conditions:
-
1.
No-flux condition at all membrane boundaries, and
-
2.
Concentration-dependent flux condition for the cytosolic and LCC fluxes.
In-flux from the RyRs was not included in this study, because we focused on the timing of the RyR triggering. The cytosolic in-flux was treated as a concentration-dependent boundary flux,
Here c and Ccyt are the Ca2+ concentrations at the boundary and in the cytosol, respectively. ΔScyt is the distance to where the concentration is assumed to be Ccyt. We fitted Ccyt to 5 nm so the concentration profile from an open LCC inside the cleft equaled the concentration profile when we included a large domain outside the cleft (data not shown). Note that Ccyt is a variable that varies with the electrical potential as
where z is the valence of Ca2+ and Φ is the electric potential, described by Eq. S2 in the Supporting Material. C0cyt was set to 0.1 μM. We used a Goldman-Hodgkin-Katz equation to govern the LCC flux (28). The permeability of a single LCC was chosen so the amplitude of the current was −0.12 pA for a voltage step to 0 mV at room temperature (29). The LCC and RyR Markov models (see below) were dependent on the value of the Ca2+ field at their boundaries.
Discrete and stochastic models
Discrete and stochastic Markov models were employed to describe the channel dynamics of the LCCs and RyRs. The LCC model is a slightly modified version of the 12-state model previously used by Greenstein and Winslow (30), and first described by Jafri et al. (31) (Fig. S2 A). With a Q10 of 1.8, we modified the rates in the model to room temperature 22°C. The Ca2+-dependent inactivation rate γ0 was fitted, so the overall γ-rate during a steady-state response from a single LCC was the same as in the study of Greenstein and Winslow (30).
We employed a minimalistic Markov model scheme for the RyRs, which is presented in Fig. S2 B. The scheme follows fourth-order activation kinetics (32,33). The kon rate was fitted so that the mean time between the stimulus and RyR triggering for the larger dyads matched that observed experimentally during a SHAM AP (≈5 ms). For our geometry and diffusion model this number was 0.048 (μM × ms)−1. We also performed simulations with sensitized RyRs, modeling a higher SR Ca2+ content, by multiplying the kon rate by 1.4 (see Results).
Coupling fidelity
The probability for an open LCC to trigger release, i.e., the coupling fidelity, has recently gained interest in the literature (32,34,35). Due to the complexity of our model, we did not study the coupling fidelity in an analytical manner. However, we could calculate the coupling fidelity directly by summating LCC openings during a run, and defining coupling fidelity as one over the number of open LCCs needed to trigger release. For comparison with previous work, we also present here the coupling fidelity during voltage-clamp steps to 0 and 10 mV: large dyad = 0.39 and 0.19, respectively; small dyad = 0.32 and 0.11. The values are in accordance with a low coupling fidelity suggested by recent studies (32,35). The lower coupling fidelity for the smaller dyad is caused by the geometrical differences between the two dyads, as Ca2+ more easily escapes the smaller dyad. The steady-state Ca2+ concentrations at the juxtapositional RyR for a voltage step to 0 mV were 34.1 μM for the large dyad and 30.0 μM for the small dyad. Because the LCC and the RyR were positioned in the center of the dyad, this difference would be smaller for positions closer to the rim. This fact has not been recognized by other studies of coupling fidelity.
Results
Animal and cell characteristics are shown in Table 1. Marked congestion was observed in CHF animals as lung weight/body weight ratios were more than double SHAM values. Cardiomyocytes were significantly longer in CHF than SHAM although cell widths were similar, indicating cellular hypertrophy.
Table 1.
Animal and cell characteristics
| SHAM | CHF | |
|---|---|---|
| BW: g | 25.2 ± 0.6 | 24.9 ± 1.6 |
| LW: g | 0.228 ± 0.009 | 0.597 ± 0.040∗ |
| LW/BW (e−3) | 9.1 ± 0.4 | 24.2 ± 1.4∗ |
| Cell length: μm | 135.2 ± 6.3 | 178.0 ± 5.3∗ |
| Cell width: μm | 26.2 ± 1.7 | 26.1 ± 1.5 |
| APD, 20%: ms | 7.8 ± 0.7 | 10.9 ± 1.5∗ |
| APD, 50%: ms | 11.7 ± 1.1 | 25.0 ± 3.8∗ |
| APD, 70%: ms | 18.2 ± 1.9 | 59.3 ± 17.7∗ |
BW, body weight; LW, lung weight.
P < 0.05 versus SHAM; nanimals: SHAM = 15, CHF = 9; ncells: pics: SHAM = 26, CHF = 28; ncells: APs: SHAM = 13, CHF = 16; P < 0.05 versus SHAM.
In comparison with SHAM, AP duration was significantly prolonged in CHF myocytes at 20, 50, and 70% repolarization time (Table 1), consistent with a reduction in transient outward K+ current (Fig. S3). Representative APs (inset in Fig. 1 A, left panel) were used to drive the computational model of the dyad, and to predict the effect of AP prolongation on the time-course of ILCC before release. Fig. 1 A shows that, in agreement with previous observations (36), LCCs open during the repolarizing phase of the mouse AP. With either a large (20 LCCs, 100 RyRs) or small dyad (5 LCCs, 25 RyRs), slowed-repolarization during the CHF AP triggered a larger number of LCC openings than the briefer SHAM AP. However, due to reduced driving force for Ca2+ entry during the failing AP, the model predicted delayed, prolonged, and reduced ILCC amplitude in comparison with the SHAM AP (Fig. 1 B). This resulted in delayed and more variable timing of triggered RyR openings (Fig. 1 C, large dyad: SHAM AP 5.1 ± 0.7 ms, CHF AP 7.2 ± 1.5 ms; small dyad: SHAM AP 8.0 ± 1.8 ms, CHF AP 13.3 ± 3.5 ms). Thus, regardless of dyad size, the computational model predicted that the prolonged failing AP promotes greater dyssynchrony of SR Ca2+ release. The model also predicted that smaller dyads are less effective in triggering Ca2+ release, as the number of included LCCs is smaller. When integrated, the current traces in Fig. 1 B predicted that a larger number of Ca2+ ions entered the cell during the CHF AP than the SHAM AP (large dyad: SHAM AP 820 Ca2+ ions, CHF AP 1290 Ca2+ ions; small dyad: SHAM AP 830 Ca2+ ions, CHF AP 1580 Ca2+ ions). The average total number of LCCs needed to trigger release in the large dyad was 12.5 during the SHAM AP and 22.3 during the CHF AP. The inverse of these numbers gives us the average coupling fidelity—SHAM AP = 0.08; CHF AP = 0.045. The fraction of channels that opened and reopened were, respectively, SHAM AP = 0.49, 0.11; and CHF AP = 0.72, 0.30. The low average coupling fidelity reflects the fact that most channels opened when the AP was depolarized (>20 mV).
Figure 1.
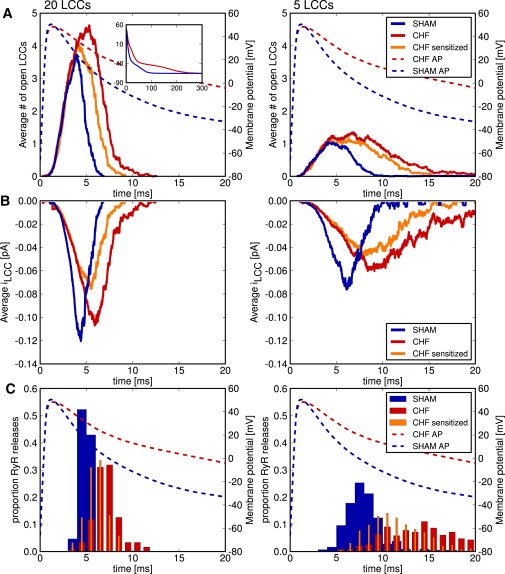
The dyadic model predicted reduced ILCC magnitude/kinetics during the CHF AP, and SR content-dependent effects on Ca2+ release synchrony. (A) Representative SHAM and CHF APs (inset of left panel) were incorporated in the computation model of both a large (left panels) and small dyad (right panels). A greater number of open LCCs was predicted during the CHF AP. At normal SR content, decreased driving force for Ca2+ entry during the CHF AP reduced ILCC magnitude and kinetics (B), and resulted in more variable timing (dyssynchrony) of RyR openings (C). Increasing RyR Ca2+ sensitivity (orange lines) to model the effects of increased SR Ca2+ content during the CHF AP (observed experimentally) predicted decreased variability in the timing of RyR openings.
Modeling predictions were tested by employing the same representative APs as voltage-clamp waveforms in experiments on normal murine cardiomyocytes. Myocytes were stimulated with trains of SHAM or CHF APs at 1 Hz, as illustrated in Fig. 2 A. Under this stimulation pattern, spatially averaged Ca2+ transients triggered by the CHF AP train were 32% larger than those elicited by SHAM APs (SHAM AP F/F0 = 2.61 ± 0.34, CHF AP F/F0 = 3.13 ± 0.45, P < 0.05). Interestingly, and in apparent disagreement with the modeling prediction, line-scan images showed similar synchrony of Ca2+ release during SHAM and CHF APs (Fig. 2 B). This was confirmed by measurements of the dyssynchrony index (Fig. 2 B, right panel). The time course of ILCC was slowed during the CHF AP train and peak current was reduced (Fig. 2 C). Overall integrated ILCC was nevertheless increased (151% SHAM AP values, P < 0.05). Greater Ca2+ entry during the CHF AP was associated with increased SR Ca2+ content (Fig. 2 D).
Figure 2.
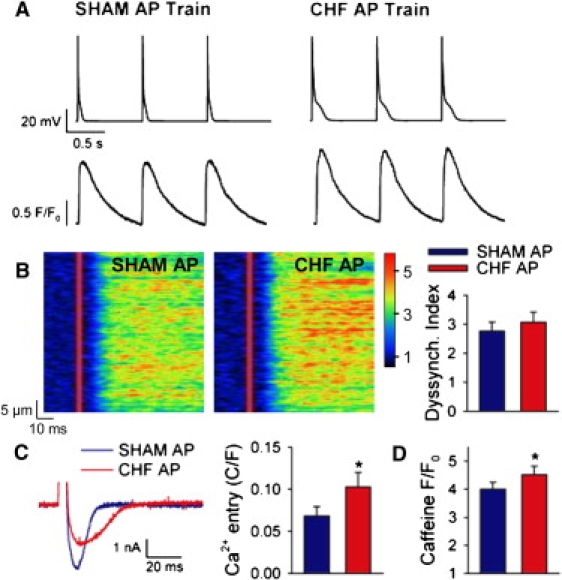
Steady-state stimulation with the CHF AP increased Ca2+ entry, SR Ca2+ content, and Ca2+ transient magnitude, and maintained Ca2+ release synchrony. (A) Normal cardiomyocytes were stimulated with trains of identical APs. (Lower panels) Representative spatially averaged Ca2+ transients. (B) Line-scan images of Ca2+ transients and mean dyssynchrony index measurements. (C) Representative ILCC and mean integrated currents elicited by the SHAM and CHF APs. (D) Estimation of SR Ca2+ content based on the magnitude of caffeine-elicited Ca2+ transients. For panels B–D, n = 7, 9, 25; P < 0.05 versus SHAM AP.
We hypothesized that the discrepancy between modeling predictions and experimental observation of Ca2+ release synchrony was due to effects of altered SR Ca2+ content not included in the computational model. Specifically, increased SR Ca2+ content induced by a train of CHF APs would be expected to sensitize RyRs, which might theoretically maintain Ca2+ release synchrony despite an altered ILCC time course. To test this hypothesis, we increased the Ca2+ sensitivity of the RyRs in the model and repeated the simulations with the CHF AP. The sensitivity was increased in such a manner that the total number of Ca2+ ions entering through LCCs before release was similar to that obtained during the SHAM AP (Fig. 1 C, orange lines, large dyad: 770 Ca2+ ions; small dyad: 1050 Ca2+ ions). Fig. 1 C shows that RyR sensitization resulted in more rapid RyR openings (orange bars, large dyad: 6.1 ± 1.1 ms; small dyad: 11.2 ± 2.8 ms), and a more narrow distribution of these measurements (standard deviation for large dyad: SHAM = 0.7 ms, CHF = 1.5 ms, sensitized CHF = 1.1 ms; small dyad: SHAM = 1.8 ms CHF = 3.5 ms, sensitized CHF = 2.8 ms).
Further evidence supporting an important role of SR Ca2+ content in regulation of Ca2+ release synchrony was obtained from cardiomyocyte experiments. Myocytes were alternately stimulated with SHAM and CHF APs (Fig. 3 A) to prevent the SR Ca2+ loading observed during steady-state CHF AP trains. In comparison with trains of like APs, this stimulation protocol less markedly altered Ca2+ transient magnitude, as transients elicited by CHF APs were only 13% larger than those elicited by SHAM APs (SHAM AP F/F0 = 1.71 ± 0.06, CHF AP F/F0 = 1.80 ± 0.08, P < 0.05). Importantly, line-scan images and mean data (Fig. 3 B) show that the CHF AP triggered more dyssynchronous Ca2+ release than the SHAM AP when the two AP waveforms were alternated. Thus, both modeling and experimental data suggest that the prolonged AP in failing cardiomyocytes promotes slowed dyssynchronous Ca2+ release, but that this effect is offset by an increase in SR Ca2+ content during steady-state stimulation.
Figure 3.
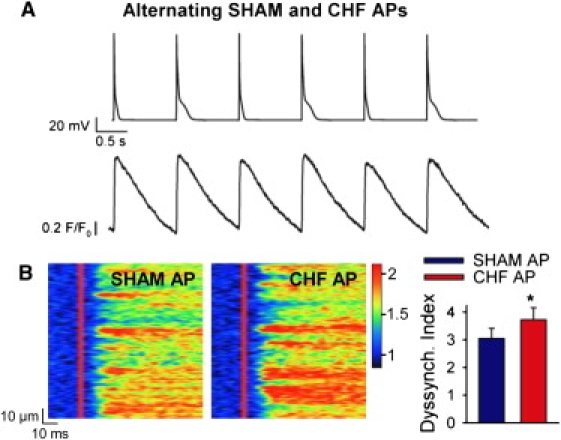
Stimulation with alternating AP waveforms to prevent alterations in SR Ca2+ content desynchronized Ca2+ release during the CHF AP. (A) Alternating AP stimulation protocol (upper panel) and representative spatially averaged Ca2+ transients (lower panel). (B) Line-scan images and mean dyssynchrony index measurements. n = 6, P > 0.05 versus SHAM AP.
We next examined whether our findings obtained in normal myocytes were reproducible in myocytes from failing hearts. Fig. 4 A shows that Ca2+ transients elicited in field-stimulated cells were markedly more dyssynchronous in CHF than SHAM, as indicated by an increase in mean dyssynchrony index values (Fig. 4 B). As we have observed previously (5), Ca2+ transients were also larger in CHF myocytes (SHAM F/F0 =1.9 ± 0.1, CHF F/F0 = 2.8 ± 0.1, P < 0.05), and the rising phase was slowed as indicated by increases in time to peak (Fig. 4 C). In patch-clamped cells, we examined whether AP configuration contributed to these alterations. During stimulation with trains of identical APs, SHAM myocytes exhibited a similar pattern of Ca2+ release when stimulated with the SHAM and CHF AP (Fig. 5 A), as indicated by mean dyssynchrony index measurements (Fig. 5 C). In CHF, Ca2+ release synchrony was also similar during SHAM and CHF AP trains (Fig. 5 B), although dyssynchrony index values were significantly higher than those observed in SHAM cells (Fig. 5 C). Thus, at steady state the failing AP does not promote dyssynchronous Ca2+ release in failing myocytes.
Figure 4.
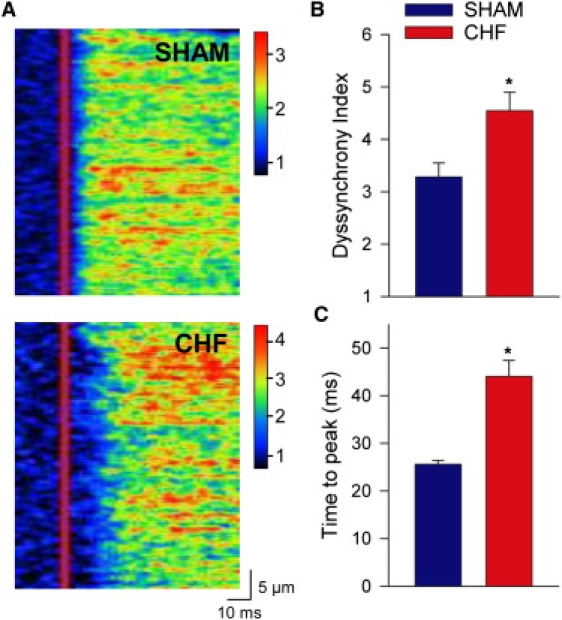
Cardiomyocytes from CHF hearts exhibited slowed, dyssynchronous Ca2+ release. (A) Representative line-scan images of Ca2+ transients from field-stimulated SHAM and CHF myocytes. (B) Mean dyssynchrony index measurements. (C) Ca2+ transient time-to-peak measurements. ncells: SHAM = 18, CHF = 18; P < 0.05 versus SHAM AP.
Figure 5.
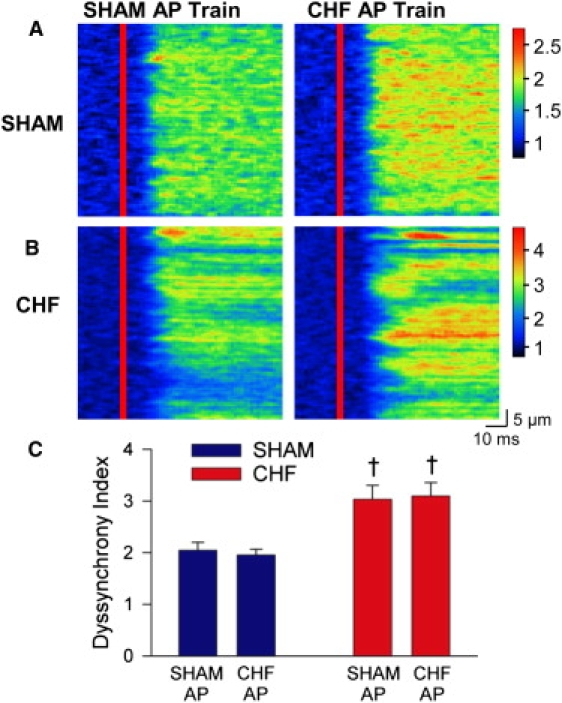
In SHAM and CHF myocytes, Ca2+ release synchrony was not altered by AP configuration during steady-state stimulation. Representative Ca2+ transients from a SHAM (A) and CHF (B) myocyte during stimulation with SHAM and CHF AP trains (left and right panels, respectively). (C) Mean dyssynchrony index measurements. ncells: SHAM = 9, CHF = 15; †P < 0.05 versus SHAM cells.
Fig. 6 shows that although the CHF AP did not alter synchrony, it did influence Ca2+ transient shape. Representative spatially averaged Ca2+ transients (Fig. 6 A) and mean measurements (Fig. 6 B) show that steady-state stimulation with CHF APs increased transient magnitude in both SHAM and CHF, similar to our observations in normal cells (Fig. 2 A). However, upon close examination, we observed that the CHF AP also slightly prolonged the Ca2+ transient, resulting in increased time-to-peak values in cells from SHAM, CHF (Fig. 6, A and C), and normal hearts (Fig. 2 A). Thus, AP prolongation contributes to the prolonged rising phase of the Ca2+ transient observed in CHF without promoting Ca2+ release dyssynchrony.
Figure 6.
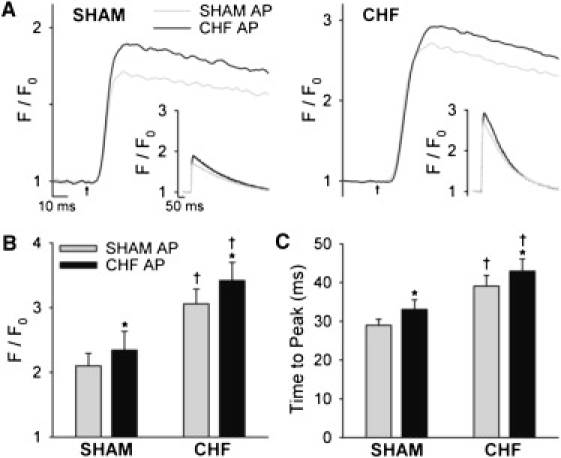
The CHF AP modestly prolonged the peak of the Ca2+ transient. (A) Representative spatially averaged Ca2+ transients from SHAM and CHF myocytes (left and right panels, respectively) during steady-state stimulation with SHAM and CHF APs (insets represent full scale). Mean measurements of Ca2+ transient magnitude (B) and time to peak (C). ncells: SHAM = 9, CHF = 15; ∗P < 0.05 versus SHAM AP; †P < 0.05 versus SHAM cells.
Discussion
In this study, we employed a novel three-dimensional computational model of the dyad in combination with cardiomyocyte experiments to examine the control of SR Ca2+ release by AP configuration in mice. We observed reduced ITO and prolonged APs in CHF myocytes, which resulted in a slowed and broadened ILCC time course. While such alterations alone promote dyssynchronous RyR openings, Ca2+ release synchrony was maintained during steady-state stimulation with the CHF AP, as elevated SR Ca2+ content increased RyR sensitivity. Although the failing AP produced a slight prolongation of the Ca2+ transient, which contributed to increased time-to-peak values in CHF myocytes, the altered AP configuration did not contribute to the greater Ca2+ release dyssynchrony observed in these cells.
To our knowledge, this study is the first to examine the effect of altered AP configuration on Ca2+ release synchrony in mice. To address this issue with mathematical modeling, we took into account recent reports indicating that dyad size is highly variably in normal murine cardiomyocytes, and that many dyads are much smaller than previous estimates (3,23). In fact, the average dyad was observed to contain almost an order-of-magnitude less RyRs (eight, as estimated by Hayashi et al. (3)) than previously thought. Previous estimates were based on the assumption that dyads are circular and that RyRs fill the available space in the dyad (2). Both Hayashi et al. (3) and Baddeley et al. (23) have shown that a dyad is not circular, and Hayashi et al. (3) also suggest that the RyR cluster is not densely packed. The larger dyad in our computational model is based on the previous estimate of dyadic size; it contains 100 densely-packed RyRs, while the smaller dyad contains only 25 RyRs. Importantly, we observed that the effects of the CHF AP on ILCC and Ca2+ release synchrony were fundamentally similar with large and small dyads, and that RyR sensitization synchronized SR Ca2+ release in both cases.
Our simulations additionally provide insight into the ability of Ca2+ channels to trigger Ca2+ release, the so-called gain of CICR and its relation to dyad size. The employed model of RyR activation includes fourth-order activation kinetics, which has been suggested based on the tetrameric structure of the RyR (33) and experimental evidence (32). An interesting effect of these kinetics is that the RyR is most probably triggered by locally positioned LCCs. Our simulations suggest (data not shown) that the steady-state Ca2+ concentration at the juxtapositional RyR, given an open LCC, is approximately three times larger than at any neighboring RyR. The probability that a neighboring RyR is triggered instead of the juxtapositional RyR given an open LCC is then
suggesting that Ca2+ is highly compartmentalized inside a single dyad. Because a single LCC is almost exclusively responsible for triggering the juxtapositional RyR, spark probability is directly dependent on the number of LCCs in a dyad. A higher spark probability will not only decrease the time to release, but also decrease the variance of the release time distribution (37), explaining the earlier and more synchronous release for the larger dyad in our study (Fig. 1 C).
The relationship between spark probability and the number of LCCs in a dyad has previously been investigated analytically by others (32,35,37). Our study differs from these previous works; we were not limited to a voltage-step protocol because we used dynamic voltage-clamp. We show that the size of the dyad alters the coupling fidelity by changing the diffusional properties of a single dyad, as described in Materials and Methods. Ca2+ will more easily diffuse out of a smaller dyad than a larger one, effectively decreasing the chance that a single open LCC will trigger release. Poláková et al. (32) suggest that several LCC channels need to open and also possibly reopen to trigger Ca2+ release. Our model also requires several open LCCs to trigger Ca2+ release. On average, 12 channel openings were required to trigger release for the SHAM AP in the large dyad, and as many as 22 for the CHF AP. This observation underscores the difference in average coupling fidelity during the two APs (0.08 vs. 0.045), and is in agreement with previous work indicating that more rapid repolarization enhances CICR triggering efficiency (38).
The observation that a dyad with a smaller number of LCCs causes more dyssynchronous Ca2+ release suggests that the greater dyssynchrony observed in failing cardiomyocytes (Fig. 4, A and B) could partly result from a decreased number of LCCs due to T-tubule loss in this condition (39). Thus, structural changes in T-tubules may promote Ca2+ release by two different mechanisms: by the creation of orphaned ryanodine receptors where Ca2+ release is dependent on Ca2+ diffusion from other sites (8–12), but also possibly by decreasing the number of Ca2+ channels in the dyad.
Although our modeling predictions suggest that both coupling fidelity and Ca2+ release synchrony are reduced in smaller dyads, an interesting possibility is that several small dyads separated by only a small distance (<100 nm) might be functionally coupled to form so-called super clusters (23). To investigate the possible impact a super cluster might have on the time to release, we combined four smaller dyads to form such a cluster. The shortest time to release from any of the four dyads was measured as 6.4 ± 1.1 ms for the SHAM AP. This is larger than the mean time to release from the larger dyad, 5.1 ± 0.7 ms, which had the same number of LCCs, i.e., 20. The discrepancy can be explained by the higher coupling fidelity in the larger dyad. We suggest that more-accurate models, featuring realistic geometries of single dyads forming super clusters (40), are needed to disentangle the functional implications of such clusters.
Previous work in rat cardiomyocytes showed that reducing repolarization rate using voltage ramps promoted nonuniform Ca2+ release of reduced magnitude (41). Similar effects were observed when the stimulus waveform was switched from a normal human AP to a failing human AP. However, in both experiments the slowing of repolarization was more extreme than that which occurs in failing rats or mice (5,42). Our modeling and experimental results show that Ca2+ release synchrony is not altered by AP prolongation (slowed repolarization) within the pathophysiological range after reduction in ITO. Importantly, AP prolongation in this range increases Ca2+ transient magnitude. These effects appear to be due to precise alterations in ILCC, which are critical in determining whether Ca2+-induced Ca2+ release (CICR) is enhanced or impaired. While LCC open probability (Fig. 1 A) and integrated currents (Fig. 1, B and C) are increased during a longer AP, reduced driving force results in a current which is delayed, prolonged, and reduced in magnitude (Fig. 1, B and C). These effects are exaggerated as repolarization is more dramatically slowed (13). Reduced amplitude Ca2+ entry through single LCCs is less likely to trigger RyR Ca2+ release. As well, reduced deactivation of LCCs during longer APs promotes LCC reopening, which further reduces CICR gain. We observed that when cells were alternately stimulated with SHAM and CHF APs, Ca2+ transient magnitude was modestly increased (Fig. 3 A). Therefore, during physiological AP prolongation in murine cardiomyocytes, greater LCC open probability more than offsets expected reductions in gain. However, our results show that such effects cannot maintain SR Ca2+ release synchrony alone.
During steady-state stimulation with prolonged APs, increased net ILCC results in greater SR Ca2+ content (5,14–16,43) because NCX-mediated Ca2+ extrusion is either unaltered (5) or reduced (43). We observed that this elevation of SR content is required to maintain Ca2+ release synchrony during the failing AP, as RyR sensitization compensates for reduction in unitary ILCC. Increased SR Ca2+ content also contributes to the inotropic effects of AP prolongation in mice, because we observed a more marked increase in Ca2+ transient amplitude during steady-state stimulation with the CHF AP than during alternating AP waveforms. With more marked AP prolongation, such as that which occurs in larger species, it appears that a critical point is passed at which increases in SR Ca2+ content are not capable of maintaining either Ca2+ transient magnitude or Ca2+ release synchrony. Beyond this point, factors favoring enhanced CICR (RyR sensitization and reduced LCC deactivation rate) are outweighed by those which reduce CICR gain (decreased unitary ILCC and greater LCC reopening).
Our experiments in normal cardiomyocytes served as proof of principle of the effect of the CHF AP on the Ca2+ transient. We additionally verified that these findings held true in failing cardiomyocytes despite known alterations in Ca2+ handling protein localization and function (12). As in normal cells, we observed that steady-state stimulation with the CHF AP did not alter Ca2+ release synchrony measurements. On close examination, we observed that the CHF AP did, however, slightly prolong the peak of the Ca2+ transient, and increase time-to-peak measurements. This peak prolongation may have resulted from slowing of the ILCC time course, as discussed above, or a delay in NCX-mediated Ca2+ extrusion due to more time spent at depolarized potentials. Therefore, AP alterations minorly contribute to increased time-to-peak values in Ca2+ transients observed in failing rodent myocytes, but not the slowed rate of rise of [Ca2+]i (5,8,9,11). Instead, it appears that dyssynchronous Ca2+ release in these cells (see Fig. 4) results from disrupted T-tubule structure, and the formation of orphaned ryanodine receptors (8,9,11). T-tubule reorganization also occurs during heart failure in larger species, including humans (10,11,39). These changes likely combine with AP alterations (prolongation and loss of an early repolarizing notch) in these species to promote slowed, dyssynchronous Ca2+ release (7). Slowed Ca2+ release, in turn, slows contraction in failing cardiomyocytes, importantly weakening the power of the heartbeat in this condition (4,5,44).
While slowing of Ca2+ release and contraction appears to be an important component of heart failure progression in both mice and men (4,5,12), there are also dissimilarities. In large mammals, heart failure is additionally associated with reduced magnitude of Ca2+ transients and contractions, and decreased SR Ca2+ content (4). We observe opposite findings in post-MI mice, as Ca2+ cycling is enhanced (Fig. 6 and (5,8,19)). We have presently demonstrated that AP prolongation is an important underlying mechanism, as it promotes both greater L-type Ca2+ entry and increased SR content. In contrast, AP prolongation in larger species reduces Ca2+ transient magnitude, as discussed above. As well, reduction in SERCA levels and/or phospholamban phosphorylation reported in large animal models (4) does not occur in post-MI mice (5). In both failing rodents and larger mammals, baseline Ca2+ current measurements are unaltered (4,5).
Our observation that SR Ca2+ content regulates Ca2+ release synchrony has implications for both normal and pathophysiological conditions. Isoproterenol treatment synchronizes SR Ca2+ release across the cell (45,46) and increases the rate of rise of the Ca2+ transient. Our results suggest that these effects result, at least in part, from RyR sensitization due to elevated SR Ca2+ stores. Similarly, increased SR Ca2+ content observed in postinfarction mice (5,8) and some other rodent heart failure models (44,47) would be expected to partially offset the desynchronizing effects of T-tubule disruption. In contrast, reduced SR Ca2+ stores observed in large animal models and human heart failure (4) should exacerbate Ca2+ abnormalities resulting from T-tubule and AP alterations. Thus, therapeutic strategies for heart failure aimed at increasing SR Ca2+ content, by augmenting SR Ca2+ reuptake or reducing Ca2+ leak, could be expected to improve both Ca2+ transient amplitude and kinetics.
Some limitations of this work should be considered. We simplified our mathematical model by including only triggering of SR Ca2+ release and not the release process itself. In addition, the model includes a somewhat simplistic mechanism for RyR activation, in comparison with what is currently known (33). We also recognize that our model does not include Ca2+ buffering or realistic geometries of the RyRs and LCCs in the dyad, both of which would be expected to alter the time course and magnitude of alterations in [Ca2+]i after an LCC opening. RyR sensitization was modeled somewhat arbitrarily, by equilibrating Ca2+ entry through LCCs during the SHAM and CHF AP. In actuality, we do not know the precise effect RyR of sensitization on ILCC, and this will be the subject of future investigations. Finally, we have not examined APs at physiological frequency (8–10 Hz), because we found it was not possible to record stable APs at high rates in murine cardiomyocytes.
Conclusions
We observed that AP prolongation in failing murine cardiomyocytes resulting from ITO reduction reduces the driving force for L-type Ca2+ entry. Although such effects normally promote dyssynchronous SR Ca2+ release, they are offset at steady state by increased SR Ca2+ content, which increases RyR sensitivity. Thus, other alterations such as T-tubule disruption account for the spatially nonuniform Ca2+ release in heart failure, and the resulting slowing of the Ca2+ release and contraction in this condition.
Acknowledgments
The authors thank the Section for Comparative Medicine, Oslo University Hospital Ullevål, for animal care.
Funding was provided by the Eastern Norway Regional Health Authority, The Research Council of Norway, Anders Jahre's Fund for the Promotion of Science, and the National Biomedical Computational Resource (National Institutes of Health grant No. 5P41 RR08605-16).
Supporting Material
References
- 1.Cheng H., Lederer W.J., Cannell M.B. Calcium sparks: elementary events underlying excitation-contraction coupling in heart muscle. Science. 1993;262:740–744. doi: 10.1126/science.8235594. [DOI] [PubMed] [Google Scholar]
- 2.Franzini-Armstrong C., Protasi F., Ramesh V. Shape, size, and distribution of Ca2+ release units and couplons in skeletal and cardiac muscles. Biophys. J. 1999;77:1528–1539. doi: 10.1016/S0006-3495(99)77000-1. [DOI] [PMC free article] [PubMed] [Google Scholar]
- 3.Hayashi T., Martone M.E., Hoshijima M. Three-dimensional electron microscopy reveals new details of membrane systems for Ca2+ signaling in the heart. J. Cell Sci. 2009;122:1005–1013. doi: 10.1242/jcs.028175. [DOI] [PMC free article] [PubMed] [Google Scholar]
- 4.Bers D.M., Despa S., Bossuyt J. Regulation of Ca2+ and Na+ in normal and failing cardiac myocytes. Ann. N. Y. Acad. Sci. 2006;1080:165–177. doi: 10.1196/annals.1380.015. [DOI] [PubMed] [Google Scholar]
- 5.Mørk H.K., Sjaastad I., Louch W.E. Slowing of cardiomyocyte Ca2+ release and contraction during heart failure progression in postinfarction mice. Am. J. Physiol. Heart Circ. Physiol. 2009;296:H1069–H1079. doi: 10.1152/ajpheart.01009.2008. [DOI] [PubMed] [Google Scholar]
- 6.Litwin S.E., Zhang D., Bridge J.H. Dyssynchronous Ca2+ sparks in myocytes from infarcted hearts. Circ. Res. 2000;87:1040–1047. doi: 10.1161/01.res.87.11.1040. [DOI] [PubMed] [Google Scholar]
- 7.Harris D.M., Mills G.D., Houser S.R. Alterations in early action potential repolarization causes localized failure of sarcoplasmic reticulum Ca2+ release. Circ. Res. 2005;96:543–550. doi: 10.1161/01.RES.0000158966.58380.37. [DOI] [PubMed] [Google Scholar]
- 8.Louch W.E., Mørk H.K., Sejersted O.M. T-tubule disorganization and reduced synchrony of Ca2+ release in murine cardiomyocytes following myocardial infarction. J. Physiol. 2006;574:519–533. doi: 10.1113/jphysiol.2006.107227. [DOI] [PMC free article] [PubMed] [Google Scholar]
- 9.Song L.S., Sobie E.A., Cheng H. Orphaned ryanodine receptors in the failing heart. Proc. Natl. Acad. Sci. USA. 2006;103:4305–4310. doi: 10.1073/pnas.0509324103. [DOI] [PMC free article] [PubMed] [Google Scholar]
- 10.Heinzel F.R., Bito V., Sipido K. Remodeling of T-tubules and reduced synchrony of Ca2+ release in myocytes from chronically ischemic myocardium. Circ. Res. 2008;102:338–346. doi: 10.1161/CIRCRESAHA.107.160085. [DOI] [PubMed] [Google Scholar]
- 11.Lyon A.R., MacLeod K.T., Gorelik J. Loss of T-tubules and other changes to surface topography in ventricular myocytes from failing human and rat heart. Proc. Natl. Acad. Sci. USA. 2009;106:6854–6859. doi: 10.1073/pnas.0809777106. [DOI] [PMC free article] [PubMed] [Google Scholar]
- 12.Louch W.E., Sejersted O.M., Swift F. There goes the neighborhood: pathological alterations in T-tubule morphology and consequences for cardiomyocyte Ca2+ handling. J. Biomed. Biotechnol. 2010;2010:503906. doi: 10.1155/2010/503906. [DOI] [PMC free article] [PubMed] [Google Scholar]
- 13.Sah R., Ramirez R.J., Backx P.H. Regulation of cardiac excitation-contraction coupling by action potential repolarization: role of the transient outward potassium current (Ito) J. Physiol. 2003;546:5–18. doi: 10.1113/jphysiol.2002.026468. [DOI] [PMC free article] [PubMed] [Google Scholar]
- 14.Sah R., Ramirez R.J., Backx P.H. Alterations in action potential profile enhance excitation-contraction coupling in rat cardiac myocytes. J. Physiol. 2001;533:201–214. doi: 10.1111/j.1469-7793.2001.0201b.x. [DOI] [PMC free article] [PubMed] [Google Scholar]
- 15.Bouchard R.A., Clark R.B., Giles W.R. Effects of action potential duration on excitation-contraction coupling in rat ventricular myocytes. Action potential voltage-clamp measurements. Circ. Res. 1995;76:790–801. doi: 10.1161/01.res.76.5.790. [DOI] [PubMed] [Google Scholar]
- 16.Terracciano C.M., Tweedie D., MacLeod K.T. The effects of changes to action potential duration on the calcium content of the sarcoplasmic reticulum in isolated guinea-pig ventricular myocytes. Pflugers Arch. 1997;433:542–544. doi: 10.1007/s004240050312. [DOI] [PubMed] [Google Scholar]
- 17.Bassani R.A., Altamirano J., Bers D.M. Action potential duration determines sarcoplasmic reticulum Ca2+ reloading in mammalian ventricular myocytes. J. Physiol. 2004;559:593–609. doi: 10.1113/jphysiol.2004.067959. [DOI] [PMC free article] [PubMed] [Google Scholar]
- 18.Finsen A.V., Christensen G., Sjaastad I. Echocardiographic parameters discriminating myocardial infarction with pulmonary congestion from myocardial infarction without congestion in the mouse. J. Appl. Physiol. 2005;98:680–689. doi: 10.1152/japplphysiol.00924.2004. [DOI] [PubMed] [Google Scholar]
- 19.Mørk H.K., Sjaastad I., Louch W.E. Increased cardiomyocyte function and Ca2+ transients in mice during early congestive heart failure. J. Mol. Cell. Cardiol. 2007;43:177–186. doi: 10.1016/j.yjmcc.2007.05.004. [DOI] [PubMed] [Google Scholar]
- 20.Peskoff A., Post J.A., Langer G.A. Sarcolemmal calcium binding sites in heart: II. Mathematical model for diffusion of calcium released from the sarcoplasmic reticulum into the dyadic region. J. Membr. Biol. 1992;129:59–69. doi: 10.1007/BF00232055. [DOI] [PubMed] [Google Scholar]
- 21.Soeller C., Cannell M.B. Numerical simulation of local calcium movements during L-type calcium channel gating in the cardiac dyad. Biophys. J. 1997;73:97–111. doi: 10.1016/S0006-3495(97)78051-2. [DOI] [PMC free article] [PubMed] [Google Scholar]
- 22.Hake J., Lines G.T. Stochastic binding of Ca2+ ions in the dyadic cleft; continuous versus random walk description of diffusion. Biophys. J. 2008;94:4184–4201. doi: 10.1529/biophysj.106.103523. [DOI] [PMC free article] [PubMed] [Google Scholar]
- 23.Baddeley D., Jayasinghe I.D., Soeller C. Optical single-channel resolution imaging of the ryanodine receptor distribution in rat cardiac myocytes. Proc. Natl. Acad. Sci. USA. 2009;106:22275–22280. doi: 10.1073/pnas.0908971106. [DOI] [PMC free article] [PubMed] [Google Scholar]
- 24.Tanskanen A.J., Greenstein J.L., Winslow R.L. Protein geometry and placement in the cardiac dyad influence macroscopic properties of calcium-induced calcium release. Biophys. J. 2007;92:3379–3396. doi: 10.1529/biophysj.106.089425. [DOI] [PMC free article] [PubMed] [Google Scholar]
- 25.Bers D.M., Stiffel V.M. Ratio of ryanodine to dihydropyridine receptors in cardiac and skeletal muscle and implications for E-C coupling. Am. J. Physiol. 1993;264:C1587–C1593. doi: 10.1152/ajpcell.1993.264.6.C1587. [DOI] [PubMed] [Google Scholar]
- 26.Wagenknecht T., Radermacher M. Ryanodine receptors: structure and macromolecular interactions. Curr. Opin. Struct. Biol. 1997;7:258–265. doi: 10.1016/s0959-440x(97)80034-6. [DOI] [PubMed] [Google Scholar]
- 27.Koh X., Srinivasan B., Levchenko A. A 3D Monte Carlo analysis of the role of dyadic space geometry in spark generation. Biophys. J. 2006;90:1999–2014. doi: 10.1529/biophysj.105.065466. [DOI] [PMC free article] [PubMed] [Google Scholar]
- 28.Keener J., Sneyd J. Springer-Verlag; New York: 1998. Mathematical Physiology. [Google Scholar]
- 29.Guia A., Stern M.D., Josephson I.R. Ion concentration-dependence of rat cardiac unitary L-type calcium channel conductance. Biophys. J. 2001;80:2742–2750. doi: 10.1016/S0006-3495(01)76242-X. [DOI] [PMC free article] [PubMed] [Google Scholar]
- 30.Greenstein J.L., Winslow R.L. An integrative model of the cardiac ventricular myocyte incorporating local control of Ca2+ release. Biophys. J. 2002;83:2918–2945. doi: 10.1016/S0006-3495(02)75301-0. [DOI] [PMC free article] [PubMed] [Google Scholar]
- 31.Jafri M.S., Rice J.J., Winslow R.L. Cardiac Ca2+ dynamics: the roles of ryanodine receptor adaptation and sarcoplasmic reticulum load. Biophys. J. 1998;74:1149–1168. doi: 10.1016/S0006-3495(98)77832-4. [DOI] [PMC free article] [PubMed] [Google Scholar]
- 32.Poláková E., Zahradníková A., Jr., Zahradníková A. Local calcium release activation by DHPR calcium channel openings in rat cardiac myocytes. J. Physiol. 2008;586:3839–3854. doi: 10.1113/jphysiol.2007.149989. [DOI] [PMC free article] [PubMed] [Google Scholar]
- 33.Zahradník I., Györke S., Zahradníková A. Calcium activation of ryanodine receptor channels—reconciling RyR gating models with tetrameric channel structure. J. Gen. Physiol. 2005;126:515–527. doi: 10.1085/jgp.200509328. [DOI] [PMC free article] [PubMed] [Google Scholar]
- 34.Altamirano J., Bers D.M. Effect of intracellular Ca2+ and action potential duration on L-type Ca2+ channel inactivation and recovery from inactivation in rabbit cardiac myocytes. Am. J. Physiol. Heart Circ. Physiol. 2007;293:H563–H573. doi: 10.1152/ajpheart.00469.2006. [DOI] [PubMed] [Google Scholar]
- 35.Sobie E.A., Ramay H.R. Excitation-contraction coupling gain in ventricular myocytes: insights from a parsimonious model. J. Physiol. 2009;587:1293–1299. doi: 10.1113/jphysiol.2008.163915. [DOI] [PMC free article] [PubMed] [Google Scholar]
- 36.Bridge J.H., Ershler P.R., Cannell M.B. Properties of Ca2+ sparks evoked by action potentials in mouse ventricular myocytes. J. Physiol. 1999;518:469–478. doi: 10.1111/j.1469-7793.1999.0469p.x. [DOI] [PMC free article] [PubMed] [Google Scholar]
- 37.Inoue M., Bridge J.H. Variability in couplon size in rabbit ventricular myocytes. Biophys. J. 2005;89:3102–3110. doi: 10.1529/biophysj.105.065862. [DOI] [PMC free article] [PubMed] [Google Scholar]
- 38.Zahradníková A., Kubalová Z., Zahradník I. Activation of calcium release assessed by calcium release-induced inactivation of calcium current in rat cardiac myocytes. Am. J. Physiol. Cell Physiol. 2004;286:C330–C341. doi: 10.1152/ajpcell.00272.2003. [DOI] [PubMed] [Google Scholar]
- 39.He J., Conklin M.W., Kamp T.J. Reduction in density of transverse tubules and L-type Ca2+ channels in canine tachycardia-induced heart failure. Cardiovasc. Res. 2001;49:298–307. doi: 10.1016/s0008-6363(00)00256-x. [DOI] [PubMed] [Google Scholar]
- 40.Yu Z., Holst M.J., Hoshijima M. Three-dimensional geometric modeling of membrane-bound organelles in ventricular myocytes: bridging the gap between microscopic imaging and mathematical simulation. J. Struct. Biol. 2008;164:304–313. doi: 10.1016/j.jsb.2008.09.004. [DOI] [PMC free article] [PubMed] [Google Scholar]
- 41.Sah R., Ramirez R.J., Backx P.H. Modulation of Ca2+ release in cardiac myocytes by changes in repolarization rate: role of phase-1 action potential repolarization in excitation-contraction coupling. Circ. Res. 2002;90:165–173. doi: 10.1161/hh0202.103315. [DOI] [PubMed] [Google Scholar]
- 42.Kaprielian R., Wickenden A.D., Backx P.H. Relationship between K+ channel down-regulation and [Ca2+]i in rat ventricular myocytes following myocardial infarction. J. Physiol. 1999;517:229–245. doi: 10.1111/j.1469-7793.1999.0229z.x. [DOI] [PMC free article] [PubMed] [Google Scholar]
- 43.Bassani R.A. Transient outward potassium current and Ca2+ homeostasis in the heart: beyond the action potential. Braz. J. Med. Biol. Res. 2006;39:393–403. doi: 10.1590/s0100-879x2006000300010. [DOI] [PubMed] [Google Scholar]
- 44.Bøkenes J., Aronsen J.M., Sejersted O.M. Slow contractions characterize failing rat hearts. Basic Res. Cardiol. 2008;103:328–344. doi: 10.1007/s00395-008-0719-y. [DOI] [PubMed] [Google Scholar]
- 45.Brette F., Rodriguez P., Orchard C.H. Beta-adrenergic stimulation restores the Ca transient of ventricular myocytes lacking t-tubules. J. Mol. Cell. Cardiol. 2004;36:265–275. doi: 10.1016/j.yjmcc.2003.11.002. [DOI] [PubMed] [Google Scholar]
- 46.Zhou P., Zhao Y.T., Wang S.Q. Beta-adrenergic signaling accelerates and synchronizes cardiac ryanodine receptor response to a single L-type Ca2+ channel. Proc. Natl. Acad. Sci. USA. 2009;106:18028–18033. doi: 10.1073/pnas.0906560106. [DOI] [PMC free article] [PubMed] [Google Scholar]
- 47.Chu G., Carr A.N., Kranias E.G. Enhanced myocyte contractility and Ca2+ handling in a calcineurin transgenic model of heart failure. Cardiovasc. Res. 2002;54:105–116. doi: 10.1016/s0008-6363(02)00230-4. [DOI] [PubMed] [Google Scholar]
Associated Data
This section collects any data citations, data availability statements, or supplementary materials included in this article.