Abstract
9 asymptomatic subjects and 6 patients underwent T1ρ MRI to determine whether Outerbridge grade 1 or 2 cartilage degeneration observed during arthroscopy could be detected noninvasively. MRI was performed 2–3 months post-arthroscopy using sagittal T1-weighted and axial and coronal T1ρ MRI from which spatial T1ρ relaxation maps were calculated from segmented T1-weighted images. Median T1ρ relaxation times of patients with arthroscopically documented cartilage degeneration and asymptomatic subjects were significantly different (p < 0.001) and median T1ρ exceeded asymptomatic articular cartilage median T1ρ by 2.5 to 9.2 ms. In 8 observations of mild cartilage degeneration at arthroscopy (Outerbridge grades 1 and 2), mean compartment T1ρ was elevated in 5, but in all observations, large foci of increased T1ρ were observed. It was determined that T1ρ could detect some, but not all, Outerbridge grade 1 and 2 cartilage degeneration but that a larger patient population is needed to determine the sensitivity to these changes.
Keywords: Cartilage degeneration, T1ρ, arthroscopy
Introduction
The need to noninvasively detect the earliest changes in the degeneration of articular cartilage in order to both use and validate disease modifying osteoarthritic drugs (DMOADs) has stimulated considerable interest in the development of techniques that can directly probe the macromolecular structure. Three MRI techniques that were developed to directly assess the loss of proteoglycan that occurs during the early phases of osteoarthritis (OA)are sodium imaging, delayed Gadolinium-enhanced magnetic resonance imaging of cartilage (dGEMRIC) and T1ρ-weighted MRI. T2-mapping is also widely used to assess the macromolecular constitution of cartilage (1–4), but collagen concentration and orientation alters the relaxation rate, thereby it is not a specific measure of proteoglycan. On the other hand, changes in collagen orientation may be among the first changes to occur and have been visualized by T2 mapping (5).
Only a limited amount of research, however, has been performed to investigate the accuracy of the techniques used to probe proteoglycan content with the use of arthroscopy as the gold standard. In 15 patients with arthroscopically confirmed early changes of OA, who were studied with the dGEMRIC technique, T1 was lower in the compartment with those changes than in a reference compartment, indicating the loss of proteoglycan (6). In a similar study employing the dGEMRIC technique, a decrease in T1 was observed to correlate with abnormal arthroscopic findings and average T1 relaxation times were significantly different between radiographic grade 0 and grade 1 changes (7). No research currently exists to correlate sodium concentration to arthroscopy. All three techniques are limited in some respects, dGEMRIC requires the administration of exogeneous contrast agents, sodium MRI requires specialized hardware, has relatively lower concentration than protons, short relaxation times and lower magnetic polarizability (8) and, as will be discussed further, T1ρ is sensitive to a number of molecular processes including the rate of proton magnetic dipole reorientation, chemical exchange and residual dipolar effects.
T1ρ was used previously to explore proteoglycan loss in patients with confirmed cartilage loss. A study of two patients with arthroscopically confirmed posttraumatic cartilage injury found increased T1ρ compared to the healthy compartments in both patients (9). T1ρ was increased (p<0.002) in six subjects with OA scored using a Western Ontario and McMaster University (WOMAC) scale (10). In a recent study of 10 patients with radiographic OA scored using the Kellgren-Lawrence(KL)scale(11), T1ρ was significantly increased from 45.5 ± 3.3 ms (KL = 0) to 55.6 ± 0.4 ms (KL = 4)(12). The specificity and sensitivity of T1ρ imaging of articular cartilage lesions at arthroscopy has not yet been determined. In this preliminary, blinded, retrospective study, we tested the hypothesis that T1ρ MRI can reliably detect cartilage degeneration demonstrated at arthroscopyin 6 patients.
Materials and Methods
Recruitment
The study was compliant with the Institutional Review Board (IRB) of the University of Pennsylvania and the Health Insurance Portability and Accountability Act (HIPAA). Prior to study participation, all asymptomatic subjects and patients were screened through a telephone interview to determine whether the inclusion and exclusion criteria, as detailed below, were satisfied. All asymptomatic subjects and patients gave informed consent to MRI.
Asymptomatic Subjects
9 asymptomatic subjects (2 men and 7 women) participated in the study. Asymptomatic was defined as having no knee pain at the time of the MRI examination and no previous history of surgery or major trauma to the knee. All asymptomatic subjects were between 30 and 59 years of age. Radiographs of asymptomatic subjects were not obtained.
Patients
6 patients(3 men and 3 women) participated in the study and were found to have one or more regions of cartilage softening or surface fibrillation (Outerbridge grade I or II cartilage degeneration as defined in Arthroscopy below). Some of these subjects also had regions of more severe cartilage degeneration which was documented at arthroscopy. All patients were between ages 40 and 76 and were identified for surgery for tears to one or both meniscii.
Arthroscopy
All arthroscopy was performed by an orthopedic surgeon (J.H.L.) who specializes in disorders of the knee and has more than 15 years of experience in clinical practice.
All arthroscopic procedures were performed with general anesthesia, followed by local injection with 0.5% bupivicaine with epinephrine. No corticosteroids were injected into the knees at the termination of surgery. Inferolateral and inferomedial parapatellar portals were utilized for surgery. Areas of the most severe degenerative changes were recorded for each compartment and photographs of those areas were taken.
During surgery, areas of cartilage degeneration were not treated, unless the edges of chondral defects were unstable, in which case a chondroplasty of those unstable chondral edges was gently performed. Cartilage grading was performed according to the classification of Outerbridge modified to include the femorotibial joint (13)and was as follows:
Grade I: Softening and swelling of the cartilage.
Grade II: Early superficial fibrillation, which does not reach the subchondral bone, and is less than 0.5 inch in diameter.
Grade III: Fissuring that reaches the subchondral bone, which is not exposed, and greater than 0.5 inch in diameter.
Grade IV: Exposed subchondral bone of any diameter.
MRI
MRI was conducted 2–3 months post-arthroscopy to avoid the potential confounding variables of acute and subacute postoperative changes. It was determined that patients in the first two months following surgery found that the knee coil caused a good deal of pain.
MRI was performed on a 1.5 T (Sonata Model, Siemens Medical Solutions USA, Inc., Malvern, PA) clinical imaging system equipped with 40 mT/m gradients. RF was delivered by a body transmit coil and received by an 8-channel (Invivo, Orlando, FL) knee extremity coil.
Sagittal T1-weighted images were obtained using a magnetization prepared rapid gradient echo (mp-rage) acquisition pulse sequence with water selective spectral RF excitation (matrix = 256 × 256, FOV = 140 mm2, ST= 0.5 mm, TR = 2700 ms, TE = 1.86 ms, IS = 20 mm, BW = 130 Hz/pixel, α = 15 , inversion time (TI) = 300 ms, 208 slices).
Axial and coronal T1ρ-weighted images were obtained using a T1ρ and half-alpha prepared phase alternated, multishot 3D balanced gradient echo sequence (matrix = 256 × 128, FOV = 140 mm2, ST= 3 mm, TR = 6000 ms, slice thickness = 3 mm, BW = 130 Hz/pixel, α = 30 , 20 slices) (14,15). The sequence was also prepared by inversion recovery (TI = 1700 ms) and fat saturation with a 3 s delay between readout and subsequent inversion recovery of the next acquisition shot. Ideally, the spin lock field amplitude is chosen to coincide with the proton chemical exchange rate on hydroxyl and amide functional groups from the proteoglycan (ν1 ≈ 1500 Hz) (16,17), however, the high specific absorption rate of radiation (SAR) limited the amplitude ν1 = 500 Hz. Five images were obtained with varying T1ρ contrast (TSL = 2–40 ms) chosen so the longest TSL would coincide with the approximate T1ρ of healthy cartilage (T1ρ ≈ 40 ms)(18).
Image Processing and Analysis
Images reconstructed online from k-space data were exported in dicom format for offline processing in Matlab (v. 7.5.0, Natick, MA). Images were sorted according to contrast and aspect. The T1-weighted images were interpolated to 0.5 mm3 and resliced along coronal and axial aspects and interpolated again along each aspect to 0.5 mm × 0.54 mm2 to match the resolution of T1ρ-weighted images. An initial manual alignment of the axial T1ρ-weighted images to the resliced axial T1-weighted image was performed by in-plane rotation and translation after which a region of interest containing cartilage and bone was selected. Masked, axial T1ρ-weighted images were exported to 3DVIEWNIX (MIPG, University of Pennsylvania, Philadelphia, PA) where T1ρ-weighted images were registered automatically to T1-weighted images. The cartilage was semi-automatically segmented from the T1-weighted images using a LiveWire algorithm (19)and masks were applied to all T1ρ-weighted images.
Masked, coregistered T1ρ-weighted images were imported again into Matlab. The T1ρ-weighted magnetization is modeled as a single exponential relaxation process ln(S) = −TSL/T1ρ + ln(S0)(20).
Arthroscopic reports, photos and T1ρ maps were viewed by three of the authors (W.R.T.W., B.J.K., and J.H.L.), who categorized areas of the most severe degenerative changes as either encompassing a whole facet (diffuse) or localized to a region within the facet (focal). Diffuse lesions were quantified by the average compartment T1ρ. Severe focal lesions (Outerbridge grade 3 or 4) were also quantified by the average compartment T1ρ, which was necessary owing to the absence of cartilage at the site of exposed subchondral bone. Mild focal lesions (Outerbridge grade 1 or 2) were quantified by mean T1ρ in an ROI drawn manually at the site of the lesion and extending across multiple slices.
Statistical Analysis
Statistical analysis was performed using the statistics toolbox in Matlab (v. 7.5.0, Natick, MA). To determine normality, a normal probability plot was constructed and normality was determined at the 5% significance level using a Lilliefors test.
Differences in median T1ρ across all compartments between asymptomatic subjects and patients was assessed by means of a Wilcoxon signed rank test. Confidence intervals for differences in median T1ρ were constructed by a 95% bootstrap confidence interval test performed by sampling with replacement (N = 1000).
Three-way ANOVA and multiple comparisons tests were performed to quantify the effects of population (asymptomatic subject or patient), side (medial or lateral) and compartment (patellar, femoral or tibial) on T1ρ. Although the ANOVA model requires normally distributed data, the population T1ρ distribution was only weakly non-normal. In addition, the population differences measured by the bootstrap confidence interval test were consistent with those measured by ANOVA.
Results
Group Results
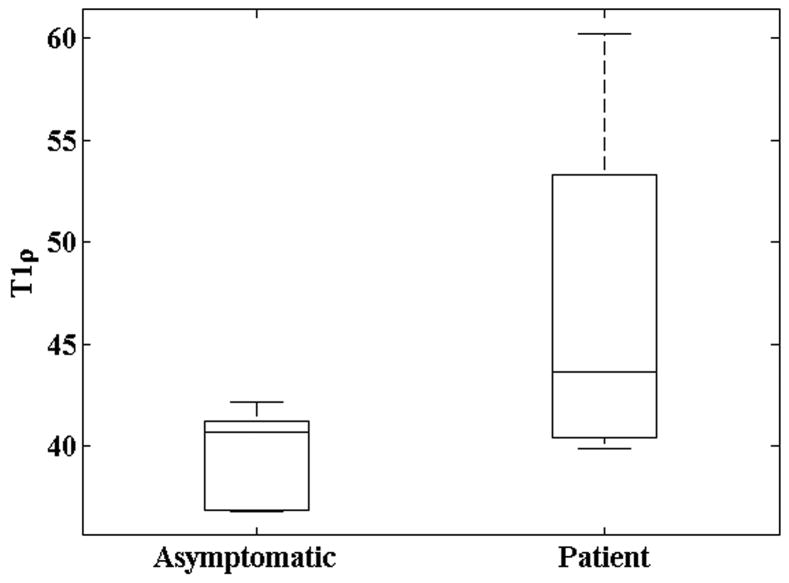
T1ρ relaxation times were quantified by side (medial or lateral) and facet (patellar, femoral or tibial) for both (post-arthroscopy) patients and asymptomatic subjects. Both patient and asymptomatic normal probability plots deviated from linearity indicating the T1ρ was not normally distributed among populations. This was confirmed by a Lilliefors test (patient: p<0.03; symptomatic: p<0.02). T1ρ was positively skewed, indicating a minimum, positive, nonzero T1ρ and high T1ρ outliers. Median T1ρ across all facets among patients and asymptomatic subjects was significantly different by a nonparametric Wilcoxon rank sum test (p<0.001) and shown graphically in Figure 1. Patient exceeded asymptomatic articular cartilage median T1ρ by 2.5 to 9.2 ms by a bootstrap confidence interval(CI)test (CI = 95%; N=1000).
Figure 1.
Boxplots of T1ρ among asymptomatic subjects and patients. Median T1ρ was significantly different by a nonparametric Wilcoxon rank sum test (p<0.001).
A three-way ANOVA was performed to test the effects of population (patient or subject), side (medial or lateral) and facet (patellar, femoral or tibial)on T1ρ while accounting for possible interactions between all three factors. Patient T1ρ was significantly higher than asymptomatic T1ρ by 1.6 to 9.6 ms (CI=95%; p < 0.01). This was in close agreement with the bootstrap CI test considered above. T1ρ was significantly correlated with location (p < 0.01) and the patellar facet was 2.5 to 8.3 ms higher than the tibial facet T1ρ (CI = 95%; p < 0.01), however the femoral facet was not significantly different from either the patellar or tibial facets, although median femoral T1ρ was lower than patellar and higher than tibial cartilage facets. No interaction was observed between the three factors. It should be emphasized that the T1ρ distribution was weakly non-normal as determined by the Lilliefors test above, however, the results of the multiple comparisons test for differences in populations were in close agreement with the bootstrap confidence interval test.
Individual Results
In 6 patients, 14 diffuse or focal areas of the most severe cartilage degeneration were made at arthroscopy. In 5 observations of grade 1 arthroscopic chondromalacia, T1ρ was observed to be 1 standard deviation higher than asymptomatic controls in 3, normal in 1 and decreased in 1. In addition, elevated focal and heterogeneous T1ρ was observed in 4. In 3 observations of grade 2 arthroscopic chondromalacia, T1ρ was elevated in 2 and normal in a third (patient 6). In 6 observations of grade 3 and 4 focal and diffuse chondromalacia, T1ρ was always elevated in the remaining, surrounding articular cartilage.
Representative arthroscopic photos and T1ρ relaxation maps are shown for 1 asymptomatic subject and 3 patients in Figures 3–5 and documented changes of cartilage degeneration at arthroscopy and on T1ρ MRI are briefly summarized in what follows. The asymptomatic subject (Figure 2) was observed to have homogenously, smoothly varying patellar cartilage together with a characteristic increase in T1ρ from the deep cartilage adjacent to the subchondral bone to the superficial cartilage adjacent to the synovium. At an ROI drawn at the cartilage surface, T1ρ = 41.7 ms.
Figure 3.
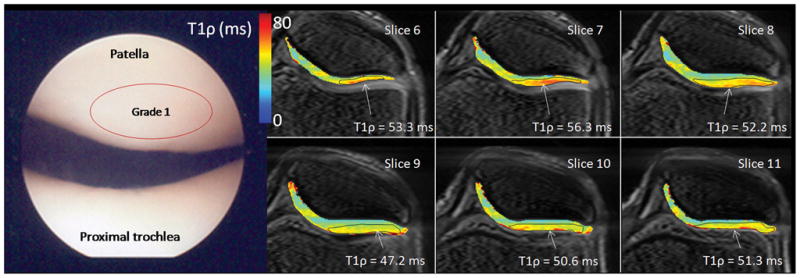
Arthroscopic photographs and T1ρ relaxation maps from a 40 year old male (patient 1). The patient was observed at arthroscopy to have diffuse grade 1 chondromalacia throughout the entire knee joint. No focal defects or thinning was observed in either patellar or femorotibial compartments on MRI, however, a heterogeneous T1ρ distribution was observed, as well as local elevated T1ρ and cartilage thinning was observed in the lateral patellar superficial compartment and elevated T1ρ = 47.2–56.3 across six slices. Diffuse, low femoral condyle compartment T1ρ was observed (T1ρ = 38.2 ms).
Figure 5.
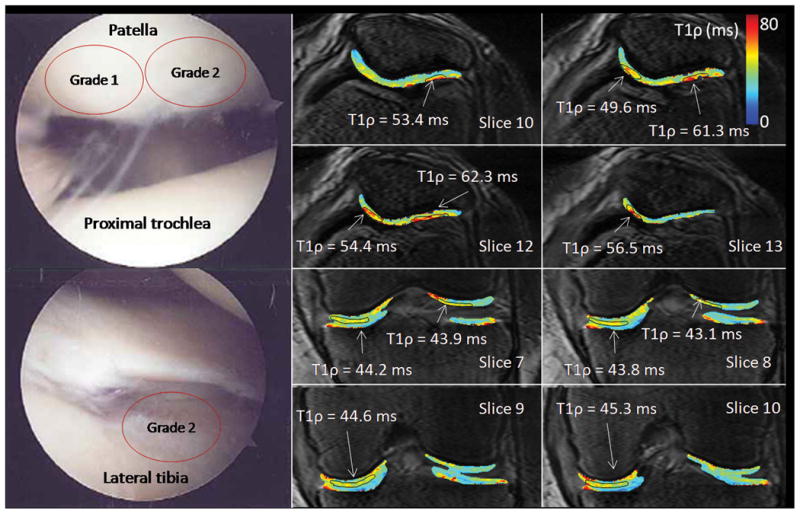
Arthroscopic photographs and T1ρ relaxation maps from a 76 year old female (patient 6). This patient was observed at arthroscopy to have grade 1 chondromalacia of the lateral patellar facet and grade 2 chondromalacia of the medial patellar facet. At MRI, both the medial and lateral patellar facets had focal T1ρ lesions (T1ρ = 49.6–56.5 and 53.4–62.3 ms, respectively). Grade 2 chondromalacia was observed in the medial femorotibial compartment at arthroscopy and elevated T1ρ = 43.8–45.3 ms was observed laterally.
Figure 2.
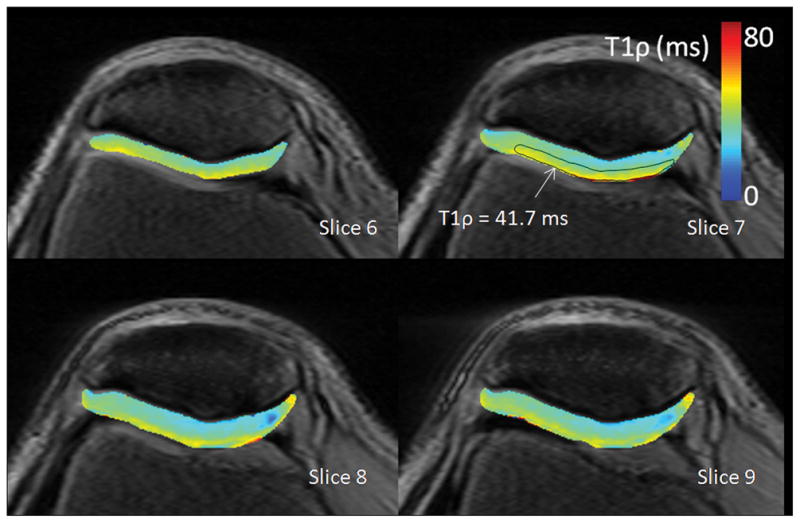
T1ρ relaxation maps from a 30 year old male with no previous history of knee injury and no knee pain. Patellar cartilage is homogenously, smoothly varying and has a characteristic increase in relaxation time from the deep cartilage adjacent to the subchondral bone to the superficial cartilage adjacent to the synovium. At an ROI drawn at the cartilage surface, T1ρ = 41.7 ms.
Patient 1 was observed at arthroscopy to have diffuse grade 1 degeneration throughout the entire knee joint (Figure 3). No focal defects or thinning was observed in either patellar or femorotibial compartments on MRI, however, a heterogeneous T1ρ distribution was observed, as well as local elevated T1ρ and cartilage thinning was observed in the lateral patellar superficial compartment and elevated T1ρ = 47.2–56.3 across six slices. Diffuse, low femoral condyle compartment T1ρ was observed (T1ρ = 38.2 ms).
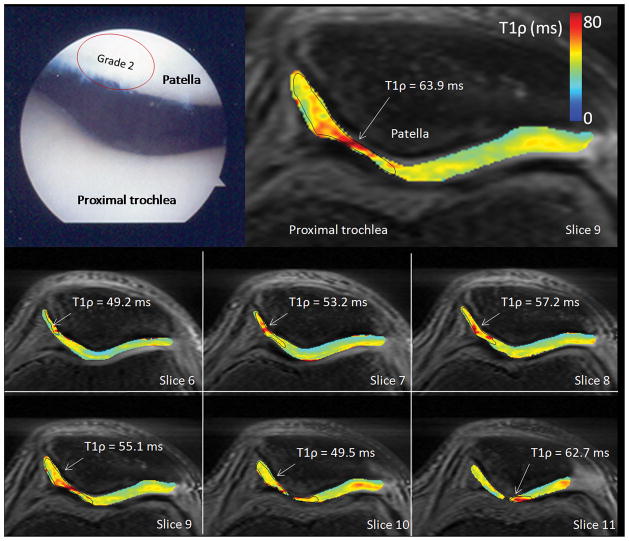
Patient 3 was observed at arthroscopy to have grade 2 patellar(Figure 4). Focal elevated T1ρ on the medial patellar facet was observed by MRI with a patellar ROI for which T1ρ = 49.2–62.7 ms, simultaneously with cartilage thinning.
Figure 4.
Arthroscopic photographs and T1ρ relaxation maps from a 48 year old male (patient 3). This patient was observed at arthroscopy to have grade 2 patellar chondromalacia and a torn left medial meniscus for which a partial medial meniscectomy was performed. Focal elevated medial patellar T1ρ was observed by MRI with a patellar ROI T1ρ = 49.2–62.7 ms, simultaneously with cartilage thinning.
Patient 6 was observed at arthroscopy to have grade 1 degeneration of the lateral patellar facet and grade 2 degeneration of the medial patellar facet (Figure 5). At MRI, both the medial and lateral patellar facets had focal T1ρ lesions (T1ρ = 49.6–56.5 and 53.4–62.3 ms, respectively). Mean T1ρ in each femorotibial facet was 41.9 ms lateral and 44.7 ms medial indicating that mean T1ρ was too conservative and misrepresented the local nature of the disease. Grade 2 degeneration was observed in the medial femorotibial facet at arthroscopy and elevated T1ρ = 43.8–45.3 ms was observed laterally.
Discussion
A previous study of individuals with a history of knee pain found that T1ρ was 25–30% higher in these subjects than in subjects without knee pain, even in cases where there was no observed cartilage loss on the T1ρ-weighted image (10).The differences in T1ρ relaxation times measured here were lower (6–20% difference corresponding with the bootstrap confidence interval of 2.5–9.2 ms), reflecting quite possibly severe, and certainly unknown, cartilage degeneration in patients recruited for that study. For asymptomatic subjects, T1ρ was between 45–55 ms, nearly 5–10 ms higher than values reported here. This discrepancy might be explained by a partial volume containing differentially suppressed joint space fluid owing to the use of a short TR acquisition in that study and inversion recovery preparation in this study. Significant non-rigid body rotation of the knee coupled with a long scan duration (25 minutes to acquire all weighted images) or, alternatively, the estimation of T1ρ by a single, manual region-of-interest drawn in a single slice in that study might explain this discrepancy.
More recently, a study quantifying both T1ρ and T2 among patients classified according to KL score found significantly increased T1ρ between osteoarthritic patients and controls and a greater percentage increase and effect size compared to T2 (12) and employed a multislice sequence of similar scan duration, having additionally performed registration of weighted images. In that study, mean T1ρ among asymptomatic subjects were approximately 5 ms higher, possibly owing to the use of a multislice T1ρ acquisition and post-processing removal of voxels containing a mixture of both cartilage and joint space fluid. As previously mentioned, it was desirable here to use fluid suppression to improve evaluation of the cartilage surface, which was often intact.
Mean T1ρ was elevated for each facet where there was documented grade 3 or 4 arthroscopic cartilage degeneration. However, for grade 1 or 2 cartilage degeneration, it was more difficult to discern documented degeneration when averaging T1ρ over an entire facet. It must be understood, however, that those facets labeled as grade 1 or 2 changes, demonstrated considerable heterogeneity at arthroscopy with normal and abnormal cartilage intermixed and that the arthroscopic grade was assigned on the basis of the highest grade of abnormality present and not on the basis of some type of average. Thus, a facet average would underestimate the arthroscopic grade and the use of at least reasonably large foci of elevated T1ρ to compare to the arthroscopic grade is justified in that it better corresponds to how the arthroscopic grade is assigned. For example, the significantly elevated T1ρ (T1ρ = 49.2–62.7 ms) in patient 3 at the site of a focal lesion is clearly abnormal, despite the mean compartment T1ρ for the medial patellar facet which was reported to be moderately lower (T1ρ = 49.1 ms). In addition, the small subject number limits the assessment of how reliably T1ρ correlates with early degeneration.
One potentially confounding variable is the presence of clinically occult osteoarthritic changes in asymptomatic subjects. This would artifactually elevate the mean T1ρ in the asymptomatic subjects, making it more difficult to discriminate between normal and abnormal values, especially for the more mild observations of OA. To help compensate for the problem of asymptomatic degenerative changes in subjects, we are prospectively measuring T1ρ values in a large number of asymptomatic subjects over a wide age range. Because the prevalence of degenerative changes likely increases with age, it may be possible to account for these changes for a given age, although individual variation may prove greater than aggregate changes resulting from age as was the case here.
Although extensive ex vivo validation and in vivo validation in a porcine animal model has been performed (21–24), the specificity of T1ρ relaxation times to changes in proteoglycan concentration in vivo in humans is not clear. T1ρ relaxation occurs when energy is exchanged with the lattice in the rotating frame of reference and thereby is sensitive to low frequency molecular dynamics of water protons (25). In this experiment, T1ρ is sensitive to spin energy exchange with the lattice on the 2 ms time scale (ν1 = 500 Hz), however, several physical processes occur to protons in cartilage on this scale, both static and dynamic. External B0 and RF B1 static field heterogeneity causes image banding artifacts, changes in the apparent relaxation time and changes in the effective field strength, although these effects are mitigated using rotary echoes and moderate spin lock amplitudes (ν1 ≫ Δν0) (26–28). The residual dipolar interaction from motionally restricted water was found to contribute to the T1ρ relaxation in cartilage, although the effect was reduced at higher spin lock amplitudes (ν1 ≫ νD) (29). Water proton exchange with exchanging amide and hydroxyl protons in glycosaminoglycans was shown to change T1ρ relaxation times in controlled studies (16,17). T1ρ decreases with decreasing rotational correlation time (30)and will depend on total water content and concentration in cartilage.
In conclusion, these results demonstrate that T1ρ relaxation mapping correlates with chondral lesions identified by arthroscopy. T1ρ MRI and arthroscopically documented cartilage degeneration was observed for Outerbridge grades 3 and 4 damage, but agreement was only modest in the case of grade 1 or 2 damage when averaging across compartments. On the other hand, a granular, region-of-interest approach demonstrated a one-to-one correspondence between T1ρ MRI and cartilage degeneration in all grades and is the suggested approach for further studies.
References
- 1.Dardzinski BJ, Mosher TJ, Li SZ, VanSlyke MA, Smith MB. Spatial variation of T2 in human articular cartilage. Radiology. 1997;205(2):546–550. doi: 10.1148/radiology.205.2.9356643. [DOI] [PubMed] [Google Scholar]
- 2.David-Vaudey E, Ghosh S, Ries M, Majumdar S. T2 relaxation time measurements in osteoarthritis. Magn Reson Imaging. 2004;22(5):673–682. doi: 10.1016/j.mri.2004.01.071. [DOI] [PubMed] [Google Scholar]
- 3.Regatte RR, Akella SVS, Lonner JH, Kneeland JB, Reddy R. T-1p relaxation mapping in human osteoarthritis (OA) cartilage: Comparison of T-1p with T-2. J Magn Reson Imag. 2006;23(4):547–553. doi: 10.1002/jmri.20536. [DOI] [PubMed] [Google Scholar]
- 4.Mosher TJ, Dardzinski BJ. Cartilage MRI T2 relaxation time mapping: Overview and applications. Sem Musc Radiol. 2004;8(4):355–368. doi: 10.1055/s-2004-861764. [DOI] [PubMed] [Google Scholar]
- 5.Alhadlaq HA, Xia Y, Moody JB, Matyas JR. Detecting structural changes in early experimental osteoarthritis of tibial cartilage by microscopic magnetic resonance imaging and polarised light microscopy. Ann Rheum Dis. 2004;63(6):709–717. doi: 10.1136/ard.2003.011783. [DOI] [PMC free article] [PubMed] [Google Scholar]
- 6.Tiderius CJ, Olsson LE, Leander P, Ekberg O, Dahlberg L. Delayed gadolinium-enhanced MRI of cartilage (dGEMRIC) in early knee osteoarthritis. Magn Reson Med. 2003;49(3):488–492. doi: 10.1002/mrm.10389. [DOI] [PubMed] [Google Scholar]
- 7.Nojiri T, Watanabe N, Namura T, Narita W, Ikoma K, Suginoshita T, Takamiya H, Komiyama H, Ito H, Nishimura T, Kubo T. Utility of delayed gadolinium-enhanced MRI (dGEMRIC) for qualitative evaluation of articular cartilage of patellofemoral joint. Knee Surg Sports Traumatol Arthrosc. 2006;14(8):718–723. doi: 10.1007/s00167-005-0013-6. [DOI] [PubMed] [Google Scholar]
- 8.Borthakur A, Shapiro EM, Beers J, Kudchodkar S, Kneeland JB, Reddy R. Sensitivity of MRI to proteoglycan depletion in cartilage: comparison of sodium and proton MRI. Osteoarthritis Cartilage. 2000;8(4):288–293. doi: 10.1053/joca.1999.0303. [DOI] [PubMed] [Google Scholar]
- 9.Lozano J, Li XJ, Link TA, Safran M, Majumdar S, Ma CB. Detection of posttraumatic cartilage injury using quantitative T1Rho magnetic resonance imaging - A report of two cases with arthroscopic findings. J Bone Joint Surg Am Vol. 2006;88A(6):1349–1352. doi: 10.2106/JBJS.E.01051. [DOI] [PubMed] [Google Scholar]
- 10.Regatte RR, Akella SVS, Wheaton AJ, Lech G, Borthakur A, Kneeland JB, Reddy R. 3D-T-1 rho-relaxation mapping of articular cartilage: In vivo assessment of early degenerative changes in symptomatic osteoarthritic subjects. Acad Radiol. 2004;11(7):741–749. doi: 10.1016/j.acra.2004.03.051. [DOI] [PubMed] [Google Scholar]
- 11.Kellgren JH, Lawrence JS. Radiological assessment of osteo-arthrosis. Ann Rheum Dis. 1957;16(4):494–502. doi: 10.1136/ard.16.4.494. [DOI] [PMC free article] [PubMed] [Google Scholar]
- 12.Li X, Benjamin C, Link TM, Castillo DD, Blumenkrantz G, Lozano J, Carballido-Gamio J, Ries M, Majumdar S. In vivo T-1 rho arid T-2 mapping of articular cartilage in osteoarthritis of the knee using 3 T MRI. Osteoarthritis Cartilage. 2007;15(7):789–797. doi: 10.1016/j.joca.2007.01.011. [DOI] [PMC free article] [PubMed] [Google Scholar]
- 13.Outerbridge RE. The etiology of the chondromalacia patellae. J Bone Joint Surg British Vol. 1961;43(4):752–757. doi: 10.1302/0301-620X.43B4.752. [DOI] [PubMed] [Google Scholar]
- 14.WRT WI, AB, MAE, RR Rapid 3D T1rho-weighted Imaging. J Magn Reson Imag [Google Scholar]
- 15.Witschey WRTBA, II, Elliott MA, Mellon E, Niyogi S, Wallman DJ, Wang C, Reddy R. Artifacts in T1rho-weighted imaging: Compensation for B1 and B0 field imperfections. J Magn Reson. 2007;186:75–85. doi: 10.1016/j.jmr.2007.01.015. [DOI] [PMC free article] [PubMed] [Google Scholar]
- 16.Makela HI, Grohn OHJ, Kettunen MI, Kauppinen RA. Proton exchange as a relaxation mechanism for T-1 in the rotating frame in native and immobilized protein solutions. Biochem Biophys Res Com. 2001;289(4):813–818. doi: 10.1006/bbrc.2001.6058. [DOI] [PubMed] [Google Scholar]
- 17.Duvvuri U, Goldberg AD, Kranz JK, Hoang L, Reddy R, Wehrli FW, Wand AJ, Englander SW, Leigh JS. Water magnetic relaxation dispersion in biological systems: The contribution of proton exchange and implications for the noninvasive detection of cartilage degradation. Proc Natl Acad Sci USA. 2001;98(22):12479–12484. doi: 10.1073/pnas.221471898. [DOI] [PMC free article] [PubMed] [Google Scholar]
- 18.Borthakur A, Regatte RR, Akella SV, Wheaton AJ, Kneeland JB, Reddy R. 3D T1-weighted MRI of the human knee at 1.5T. Radiology. 2002;225:329–329. [Google Scholar]
- 19.Falcao AX, Udupa JK, Samarasekera S, Sharma S, Hirsch BE, Lotufo RDA. User-steered image segmentation paradigms: Live wire and live lane. Graph Mod Image Proc. 1998;60(4):233–260. [Google Scholar]
- 20.Borthakur A, Mellon E, Niyogi S, Witschey W, Kneeland JB, Reddy R. Sodium and T(1rho) MRI for molecular and diagnostic imaging of articular cartilage. NMR Biomed. 2006;19(7):781–821. doi: 10.1002/nbm.1102. [DOI] [PMC free article] [PubMed] [Google Scholar]
- 21.Wheaton AJ, Dodge GR, Borthakur A, Kneeland JB, Schumacher HR, Reddy R. Detection of changes in articular cartilage proteoglycan by T-1p, magnetic resonance imaging. J Ortho Res. 2005;23(1):102–108. doi: 10.1016/j.orthres.2004.06.015. [DOI] [PMC free article] [PubMed] [Google Scholar]
- 22.Duvvuri U, Reddy R, Patel SD, Kaufman JH, Kneeland JB, Leigh JS. T-1 rho-relaxation in articular cartilage: Effects of enzymatic degradation. Magn Res Med. 1997;38(6):863–867. doi: 10.1002/mrm.1910380602. [DOI] [PubMed] [Google Scholar]
- 23.Akella SVS, Regatte RR, Gougoutas AJ, Borthakur A, Shapiro EM, Kneeland JB, Leigh JS, Reddy R. Proteoglycan-induced changes in T-1 rho-relaxation of articular cartilage at 4T. Magn Reson Med. 2001;46(3):419–423. doi: 10.1002/mrm.1208. [DOI] [PubMed] [Google Scholar]
- 24.Wheaton AJ, Dodge GR, Elliott DM, Nicoll SB, Reddy R. Quantification of cartilage biomechanical and biochemical properties via T-1p magnetic. Magn Reson Med. 2005;54(5):1087–1093. doi: 10.1002/mrm.20678. [DOI] [PubMed] [Google Scholar]
- 25.Redfield AG. Nuclear magnetic resonance saturation and rotary saturation in solids. Phys Rev. 1955;98(6):1787–1809. [Google Scholar]
- 26.Charagundla SR, Borthakur A, Leigh JS, Reddy R. Artifacts in T-1 rho-weighted imaging: correction with a self-compensating spin-locking pulse. J Magn Reson. 2003;162(1):113–121. doi: 10.1016/s1090-7807(02)00197-0. [DOI] [PubMed] [Google Scholar]
- 27.Witschey WRT, Borthakur A, Elliott MA, Mellon E, Niyogi S, Wang CY, Reddy R. Compensation for spin-lock artifacts using an off-resonance rotary echo in T-1 rho(off)-weighted imaging. Magn Reson Med. 2007;57(1):2–7. doi: 10.1002/mrm.21134. [DOI] [PMC free article] [PubMed] [Google Scholar]
- 28.Solomon I. Rotary spin echoes. Phys Rev Lett. 1959;2(7):301–302. [Google Scholar]
- 29.Akella SVS, Regatte RR, Wheaton AJ, Borthakur A, Reddy R. Reduction of residual dipolar interaction in cartilage by spin-lock technique. Magn Reson Med. 2004;52(5):1103–1109. doi: 10.1002/mrm.20241. [DOI] [PubMed] [Google Scholar]
- 30.Slichter CP. Principles of magnetic resonance. Berlin ; New York: Springer-Verlag; 1990. [Google Scholar]


