

Abstract
The effectiveness of sequence alignment in detecting structural homology among protein sequences decreases markedly when pairwise sequence identity is low (the so-called “twilight zone” problem of sequence alignment). Alternative sequence comparison strategies able to detect structural kinship among highly divergent sequences are necessary to address this need. Among them are alignment-free methods, which use global sequence properties (such as amino acid composition) to identify structural homology in a rapid and straightforward way. We explore the viability of using tetramer sequence fragment composition profiles in finding structural relationships that lie undetected by traditional alignment. We establish a strategy to recast any given protein sequence into a tetramer sequence fragment composition profile, using a series of amino acid clustering steps that have been optimized for mutual information. Our method has the effect of compressing the set of 160,000 unique tetramers (if using the 20-letter amino acid alphabet) into a more tractable number of reduced tetramers (around 15 to 30), so that a meaningful tetramer composition profile can be constructed. We test remote homology detection at the topology and fold superfamily levels using a comprehensive set of fold homologs, culled from the CATH database, that share low pairwise sequence similarity. Using the receiver operating characteristic (ROC) measure, we demonstrate potentially significant improvement in using information-optimized reduced tetramer composition, over methods relying only on the raw amino acid composition or on traditional sequence alignment, in homology detection at or below the “twilight zone”.
1. Introduction
Sequence-based homology searching is an important tool for inferring the structure of a newly sequenced protein from databases of known structures. Accuracy in detecting structural homology is relatively high when sequence homology is significant, but decreases dramatically as sequence similarity approaches the so-called “twilight zone”.1 In this region (up to ~35% pairwise residue identity), detection of structural homology by traditional sequence alignment becomes increasingly difficult.
There are conceptual and practical difficulties associated with alignment-based homology searching. A fundamental problem arises from the assumption, intrinsic in alignment methods, that, in seeking proteins with structures similar to that of the query sequence, one is interested in evolutionarily related sequences. It is now well understood that fold selection and protein folding are degenerate,2 in the sense that sequences found unrelated by any criterion have been shown to assume essentially identical folds. Indeed, proteins which vary in chain length by a factor of 2 or more are known to assume similar folds. It is therefore clear that a search for structural homology based on sequence similarity will miss many homologues. This problem is compounded by known issues associated with any alignment-based method.3 Alignment-based approaches rely heavily on the presumption of linear correspondence between sequences, and are unable to detect homology that may be masked by reshuffling of conserved elements, or those obscured by significant variability in sequence length. Furthermore, all alignment-based methods rely on arbitrary parameters, including gap initiation, propagation penalties and amino acid substitution matrices, which are difficult to define rigorously.
Because of these considerations, there is interest in exploring methods for homology searching that judges sequence similarity without using traditional alignment. Homology detection without sequence alignment has distinct advantages.3 These methods have the potential to detect structural similarities between significantly divergent sequences, and to conduct searches and classification using large data sets rapidly, without the computational difficulties (and approximations) associated with multiple alignments. They automatically account for insertions and deletions, therefore obviating the necessity for gap penalty functions, which are ad hoc in nature.
The first practical question to be addressed is the explicit choice of sequence representation. The simplest specification of sequence is amino acid composition. The composition vector, made up of occurrence frequencies of each of the 20 amino acids in the polypeptide chain, is thought to contain a certain amount of information relevant to structure. Composition vectors have proven effective in inferring global structural features—for instance, in predicting the relative proportions of secondary structure of a sequence4–6 and also in specifying the location of unfolded segments, if any, within the sequence.7;8 More relevant to the current work is the observation that similarity in composition vectors among sequences can be used to infer structural homology, specifically in classifying sequences into the general structural classes (all-alpha, all-beta, and mixed alpha/beta),9–11 and into fold families. 12–20
Extending the description to (overlapping) dipeptide composition, or to the composition of amino acid pairs separated by a number of residues, improves the performance of homology detection algorithms.21–25 Because employing dipeptides and longer fragments, rather than just composition, reinstates some sequential information, this improvement should come as no surprise. The benefits of including partial sequence information via fragment composition are achieved while still using fast and simple procedures for alignment-free comparison. The fragment composition strategy becomes impractical with longer fragments, however, because the composition vectors become statistically unreliable due to a shortage of data. To illustrate, there are 203 (or 8,000) unique trimers and 204 (160,000) unique tetramers if the full 20-amino acid alphabet is used, so that a protein of reasonable length is unable to supply enough data to meaningfully define a composition vector. A strategy to reduce dimensionality in sequence representation space is needed if description is to be extended beyond the shortest length scale.
In this work, we demonstrate that it is possible to build statistically meaningful fragment composition profiles for fold homolog detection. We make use of methods developed previously26;27 to contract sequence fragment space to a tractable alphabet size, using purely structural criteria. An alignment-free procedure can then be applied without any complication. This strategy incorporates both sequence and structural information into the composition vector, without unduly increasing the size of the descriptor space. Improvement in classifier performance is achieved without increasing the complexity of the computation. We note that our amino acid alphabet size reduction has been proven by independent studies to perform well in alignment and fold recognition tests, compared to other alphabet reduction schemes.28;29
We demonstrate the utility of this strategy for detecting structural similarity using a comprehensive set of fold homologs, culled from the CATH database,30–32 that share low pairwise sequence similarity. We explore the use of a reduced tetramer composition profile as a means to determine the membership of sequence domains in the T (topology) and H (homologous superfamily) levels of classification. We elaborate on previous studies by exploring the entire universe of folds for an indication of the effectiveness of both amino acid and fragment composition in gauging structural similarity. Our data set of 7,794 sequences encompasses 1,084 topologies and 2,091 homologous superfamilies, far exceeding the size of previously used databases.
2. Methodology
Each chain is represented by its tetramer fragment composition, computed from a count of all overlapping contiguous tetramers. The composition vector, a frequency distribution of all n unique tetramers, is then used to indicate the location of the chain in an n-dimensional composition space. The operating assumption of composition-based homology searching is that chains with similar composition have a high probability of sharing a fold or structural family. Similarity between chains is estimated using the distances between chains, here calculated as a difference between their tetramer fragment compositions.
The central issue we address here is compression of the tetramer sequence alphabet to a more tractable size, in order to achieve meaningful statistics. The challenge is to cluster all 160,000 unique, full-20-amino-acid alphabet tetramer fragments into 15 to 30 groups. A reduced tetramer fragment representation is built using a series of clustering steps, which we outline here. First, the 160,000-member tetramer set was reduced to a smaller number of tetramers using a position-specific amino acid alphabet reduction scheme devised in previous work.26;27 This step dramatically reduces the number of unique tetramers, to less than 1000. Each of these reduced tetramers was further clustered into a final number of groups (15 to 30) using similarities in their backbone structural propensities. With this reduction, the overlapping tetramer composition of a typical protein chain can be characterized roughly by the same number of sequence states as result from the more commonly used 20-amino-acid monomer composition. The details of this progressive reduction are discussed below, and illustrated in Figure 1.
FIGURE 1.

An illustration of the sequence reduction steps used in this study. (A) Overlapping tetramer fragments are extracted from the full amino acid sequence. (B) Each of the tetramer fragments is rewritted in reduced form, from the full 20-letter amino acid alphabet to the information-optimized {4.6.8.4} configuration, according to Table 1. (C) The cluster membership of the reduced alphabet tetramers is determined. In this example, the data described in the Appendix, at cluster number nclus = 20, was used. (D) Finally, the structure-based reduced tetramer (STC) composition profile of the protein chain is determined, by computing the frequency of each of the 20 clusters.
2.1. Reduced tetramer representation via optimized reduced alphabet
In order to reduce the number of unique tetramer sequences, we clustered the 20-letter amino acid alphabet into a smaller number of groups for each residue position of the tetramer. One amino acid grouping was selected, out of the enormous number of possible groupings, using the information maximization procedure developed in previous work.27 This entails a Monte Carlo search across combinations of groupings, using mutual information between sequence and structure as the objective function. Mutual information, which can be thought of as the amount of structural information contained in the amino acid sequence, is expressed by the following equation:
| (1) |
where c is conformation, s is amino acid sequence, p(c|s) expresses the probability of sequence s to be in structure c in native folds, and p(c) is the probability of finding a particular conformation c in native folds irrespective of sequence. The summation is made across all combinations of (c,s) found in empirical data. In our application, mutual information is computed from probabilities derived from the ensemble of backbone structural propensities of all reduced tetramers found in a representative data set of high-resolution X-ray structures of protein chains. From this equation, it can be seen that mutual information is dependent on the way c and s are defined and discretized.
For conformation c, we chose three structural descriptors to characterize the conformation c of a tetramer fragment s: by connecting successive residues with virtual alpha-carbon bonds, the tetrameric structure can be described completely by a set of angles: two bond angles (using the middle two residues as the two vertices) and one dihedral angle (pivoting around the bond between the middle two residues). We will refer to these angles as {ba1, ba2, da} respectively. We partitioned the bond angles into 6 discrete states (at 60° resolution) and the dihedral angle into 12 states (at 30° resolution).
For sequence s, we recognize that there are many ways to cluster twenty amino acids into a smaller number of groups. Each amino acid clustering, which we will refer to as Kc, gives rise to a new set of reduced-sequence-dependent structural probabilities p(c|s(Kc)) because changing the amino acid groupings KC alters the sequence descriptor s. This in turn affects the quantity of mutual information (Eq.(1)). Consistent with our previous work on the information-theoretic analysis of protein sequences,26;27 the optimum amino acid clustering is that which maximizes mutual information. The search for the optimum amino acid clustering is done using a direct Monte Carlo optimization procedure.26;27
The number of amino acid groupings at each position of the tetramer fragment is also treated as a variable in the optimization. We denote the tetramer sequence clustering by {k1.k2.k3.k4}, where ki is the number of amino acid groups at position i of the tetramer. (In this notation, the full 20-amino acid alphabet expression is the configuration {20.20.20.20}.) We calculated the mutual information of various amino acid clusterings for 3≤ ki ≤10. Again, we used Monte Carlo optimization from previous work to search through the possible cluster patterns as well as cluster configurations.
In summary, the specific form of the mutual information equation for a particular amino acid grouping KC and a particular cluster partition {k1.k2.k3.k4} becomes:
| (2) |
where the conformation variable c refers to the set of angles {ba1, ba2, da} that completely describe the tetramer backbone of each reduced sequence tetramer. Maximization of mutual information, therefore, requires us to find two optimal parameters: first, the best clustering partition {k1.k2.k3.k4}, and second, the actual amino acid grouping KC within the given clustering partition:
| (3) |
As in previous work,27 we relied on an intensive Monte Carlo search across different clustering partitions and different amino acid groupings to arrive at their optimal values.
The results of our Monte Carlo optimization are as follows. We found that the most informative tetramer sequence space partition is described in Table I. Among the cluster configurations examined, {4.6.8.4} generates the highest mutual information, at 0.189 nats. The amino acid clustering patterns emerging from this optimization (Table I) are similar to those observed previously.26 Among the most important features: the uniqueness of Gly and Pro in encoding backbone configuration, a general partition between hydrophobic and polar side chains, and the clustering of small polar side chains (e.g., Ser, Thr) with proclivity for side-chain-backbone interactions prevalent in turns. Other observations include the following:
TABLE I.
The optimal reduced tetramer configuration
| amino end | 2nd position | 3rd position | carboxyl end | |
|---|---|---|---|---|
| No. of clusters | 4 | 6 | 8 | 4 |
| amino acid membership | ||||
| A | 1 | 4 | 7 | 3 |
| C | 2 | 5 | 6 | 2 |
| D | 1 | 4 | 8 | 3 |
| E | 1 | 4 | 7 | 3 |
| F | 1 | 2 | 6 | 2 |
| G | 1 | 3 | 2 | 1 |
| H | 1 | 4 | 6 | 3 |
| I | 1 | 2 | 4 | 2 |
| K | 1 | 4 | 7 | 3 |
| L | 1 | 2 | 3 | 2 |
| M | 3 | 2 | 7 | 2 |
| N | 1 | 4 | 8 | 3 |
| P | 1 | 1 | 5 | 4 |
| Q | 1 | 4 | 7 | 3 |
| R | 1 | 4 | 7 | 3 |
| S | 1 | 4 | 1 | 3 |
| T | 1 | 4 | 1 | 2 |
| V | 1 | 2 | 4 | 2 |
| W | 4 | 6 | 6 | 2 |
| Y | 1 | 2 | 6 | 2 |
More information about backbone conformation is contained in the third residue position of the tetramer, as demonstrated by increased mutual information when the number of groups at this position is maximal.
Grouping pattern is unique to position in the tetramer. For example, the terminal positions both have four amino acid clusters, but have very different cluster patterns.
The optimal clustering at the amino end of the tetramer exhibits three amino acids, cysteine methionine, and trytophan, each separating out into its own cluster while the rest of the amino acids combine to form a large (17-member) cluster. We are currently investigating this unusual clustering pattern, to see just how robust a result this is, and whether there are biological and/or structural reasons for the three amino acids at the amino end to induce unusual effects on the conformational propensities of tetramers.
The size of the data set from which these partitions are optimized is a dominant factor. As the non-redundant data set increases in size, greater numbers of amino acid clusters may be accommodated for every tetramer position. We emphasize that the entire alphabet reduction and clustering are carried out automatically, driven only by maximization of mutual information between sequence and structure.
To summarize, Figure 1 illustrates how a typical amino acid sequence is transformed into a set of overlapping full 20-amino acid alphabet tetramers, as illustrated in Step A. In Step B, each of the tetramers is translated into reduced alphabet form, using Table 1. The procedure for the succeeding steps is described below.
2.2. Clustering reduced tetramers into groups of similar structural coding propensities
The configuration {4.6.8.4} reduces the number of possible tetramers from 160,000 to 768. We wish to decrease this number further by clustering together tetramers sharing similar structure encoding propensities. Structure propensities for each reduced tetramer sequence can be computed by taking note of the {ba1, ba2, da} structure of each occurrence of the tetramer in the data set, and then placing them into discrete bins or structural states, as in the previous section (Again, we note that ba1 and ba2 are discretized into 6 bins, at 60° resolution, and da into 12 bins, at 30° resolution). These counts are then converted into frequencies, by normalization using the total number of occurrences of the tetramer in the data set. Thus, the structural propensity of tetramer x can be described by the frequency distribution {f(c|x)}, where c refers to the bins made to discretize {ba1, ba2, da}.
Among the possible ways to measure “distance” between pairs of tetramers x and y, we chose a simple Euclidean distance D:
| (4) |
where fi(c|x) is the occurrence frequency of tetramer x in structural state ci, and the summation runs through all discrete structural states. (We also tested the performance of total divergence, an information-theoretic quantity, as distance measure.27 While details of the tetramer clustering are different, fold homology results are markedly similar. We chose Euclidean distance for ease of application.) This distance measure allowed us to compute distances between all pairs of tetramers. The resulting distance matrix can then be used to cluster together the 768 tetramers into a smaller number of groups. Specifically, we used K-means cluster analysis to group the 768 tetramers into nclus = 15, 20, 25, and 30 clusters. Convergence was achieved after repeated application of the K-means procedure. We include cluster results for nclus = 20 in the Appendix (online). This clustering procedure effectively reduces the number of unique tetramers from 768 to a more manageable size (nclus).
2.3. Structure-based reduced tetramer composition (STC) distance between two chains
To summarize, the tetramer composition of any protein chain can be evaluated as follows. For a sequence of length n, the n-3 overlapping tetramers are extracted (Figure 1, Step A). Each tetramer is translated into reduced sequence form (Figure 1, Step B), using the rules of Section 2.1 and Table I, after which the reduced tetramer’s membership in the optimum clustering, described in Section 2.2 and the Appendix (online), is determined (Figure 1, Step C). The number of occurrences for each tetramer cluster is then normalized by n-3 to arrive at a mole fraction (Figure 1, Step D). We will refer to this composition as the structure-based reduced tetramer composition, or STC.
We hypothesize that a similarity in STC between two chains is indicative of a similarity in structural fold. To quantify the similarity between the STC profile of protein chains A and B, we again use the Euclidean distance D:
| (5) |
where fj(A) is the frequency of occurrence of reduced tetramer j in chain A, and nclus is the total number of reduced tetramers in the STC description. (We again tested total divergence as a distance measure, and found that it gave the same over-all results in fold-homology detection. Again, for simplicity, we chose the Euclidean distance for our similarity measure.) We now examine the ability of STC to detect structural homology among sequentially dissimilar chains, as described below.
2.4. Fold homology test
One way to evaluate the effectiveness of STC is to see how well it performs in identifying chains that belong to fold classes and families, and those which are structurally unrelated. We use the CATH database of structural domains30–32 to organize a comprehensive data set with which to test our methodology. CATH is a hierarchic classification of protein domains into Class (secondary structure content), Architecture (large-scale orientation of topological elements), Topology (or fold), and Homologous superfamily (homologous structures of demonstrable evolutionary relationship). We focus our test on the more challenging T and H levels of classification. We ask how well the STC distance between two query sequences correlates with the probability of finding them in the same topology or homologous superfamily.
We use a non-redundant subset of the CATH database, in which sequences share no more than 35% pairwise sequence identity (in the vicinity of the twilight zone). Our data set, which contains 7,794 domains, represents 1,084 topologies and 2,091 homologous superfamilies, and is, to the best of our knowledge, the largest “twilight zone” data set used in structural homology detection by sequence. Our comprehensive test, to measure the ability of STC to classify any two sequences in the data set as belonging to the same T or H group, involves over 30 million pairwise comparisons.
A stringent evaluation of any discrete classifier is to construct its receiver operating characteristic (ROC) curve,33;34 which measures performance over the entire range of values of the critical classification score (in this case, the STC distance). ROC curves are especially informative because they account for the cost of increasing the number of correct classifications (true positives and true negatives) as reflected in the proportion of incorrect classifications (false positives and false negatives). In particular, the area under the ROC curve measures the extent to which a classifier is successful in limiting the latter while maintaining accuracy in true classifications. ROC results for the STC classifier are compared to ROC curves generated by traditional alignment using both BLAST and PSI-BLAST (using the BLOSUM62 scoring matrix and standard gap penalties of 11 for initiation and 1 for extension), as well as by the simple 20-letter amino acid composition (AAC). PSI-BLAST is an improvement over BLAST in that it generates a position-specific sequence profile from the first set of BLAST alignments, which is then employed in the next search to identify potentially related sequences. The growing set of related sequences is subsequently used to update and refine the sequence profile for succeeding searches. We set the PSI-BLAST to do up to 6 iterations, and we defined whichever sequences it captures after 6 iterations to be related to our query sequence.
3. Results and Discussion
Classifier evaluation involves pairwise comparisons between all 7,794 domains that comprise our non-redundant data set of fold homologs. A correct hit is tallied when two structurally homologous sequences are correctly placed in the same structural class (true positive), as well as when two non-homologous sequences are determined to be in different structural classes (true negative). From the series of more than 30 million pairwise comparisons, the tally of correct and incorrect hits is summarized into ROC curves. ROC curves were computed for correct homology detection at the T (topology) and H (homologous superfamily) levels of CATH, for four STC alphabet sizes: nclus = 15, 20, 25, and 30. In addition, ROC curves were also computed for homology detection based on the similarity in single-residue 20-letter amino acid composition (AAC). The latter ROC curves serve as the baseline from which to assess any improvement in homology searches brought about by using longer length scales (i.e., tetramer vs. monomer) in defining compositional similarities. Lastly, ROC curves for traditional alignment via BLAST and PSI-BLAST were also calculated.
These curves are shown in Figure 2. The plot shows only the T and H levels for STC alphabet size 20, but the other STC alphabet sizes return very similar curves. The areas under the curve (AUCs) of these ROC curves, quantified as a proportion of the square plot, are summarized in Table II. As should be expected, traditional alignment using BLAST performs poorly in finding any significant homology in a data set comprised of fold homologs with less than 35% pairwise sequence identity. At the H level, where sequences of demonstrable evolutionary kinship are grouped together, traditional alignment is able to successfully classify some pairs that barely align, with E-values in the range of 0.001 to 5.0. This accounts for the initial spike at the x-axis of the plot. However, beyond the threshold for alignment detection by BLAST, no other homologous pair is correctly classified, resulting in a straight line for the rest of the ROC plot. At the T level, where homologous pairs with some detectible alignment (i.e., those belonging in the same H class) are mixed with many pairs that share no evolutionary or obvious sequence kinship, the ROC curve demonstrates the inability of traditional alignment to detect fold homologies, with an AUC value of 0.51, close to the random classifier performance (and absolute minimum possible AUC) of 0.5.
FIGURE 2.

The ROC curves for BLAST and PSI-BLAST alignments, AAC, and STC classifiers in classifying homologous domains in the T and H levels of CATH. The STC classifier results illustrated are for cluster number k = 20. For the AAC classifier, the ROC curves are nearly identical for classification in the T and H levels.
TABLE II.
Area under the ROC
| CAT | CATH | |
|---|---|---|
| BLAST | 0.51 | 0.56 |
| PSI-BLAST | 0.52 | 0.64 |
| AAC | 0.67 | 0.67 |
| STC-15 | 0.75 | 0.71 |
| STC-20 | 0.76 | 0.73 |
| STC-25 | 0.76 | 0.72 |
| STC-30 | 0.74 | 0.72 |
PSI-BLAST, more sensitive to distant evolutionary relationships, shows improvement in detecting structural homology, particularly in the H level of CATH. The AUC of the ROC curve for PSI-BLAST is 0.64, due to the increased initial spike in identifying homologous pairs at the left side of the ROC curve (Figure 2), similar to that observed when BLAST is used at the H level of CATH.
The AAC classifier performs better than BLAST and PSI-BLAST sequence alignment, with an AUC of 0.67 for both T and H levels of CATH. However, the improvement brought about by using the tetramer fragment representation STC is greater, with an AUCs of 0.76 and 0.73 at the T and H levels. These composition-based ROC plots exhibit smooth concave curves, indicating a substantial number of pairings occurring across the span of STC distances. These plots show a rapid increase in the classifier sensitivity (for correct homology classification) at low threshold STC distance values, at moderate cost (incorrect classification). However, as the threshold STC is relaxed to higher distance values, any increase in the rate of correct homology assignment is accompanied by a rapid increase in the number of non-homologous pairs incorrectly identified.
We looked further into the comparison between AAC and STC classifiers. From the ROC plot, it can be seen that, given any false positive rate (the x-axis), the STC classifier delivers more true positives than the AAC. We asked how using tetramer composition improves the distance scores for fold homologs compared to using only the amino acid composition. To avoid the need to define any “cut-off distance” to indicate homology detection, we asked how much the relative rank of the distance given by a fold homolog pair (as defined by being in the same H class) is improved if STC is used instead of AAC. By relative rank, we mean the rank of the distance as compared to the ensemble of distances given by all the possible pairings in the data set (whether the pair is homologous or not). We plot the distribution of percentile ranks of fold homologs for both STC and AAC classifiers in Figure 3. Foremost, we found that, in an ensemble of more than 30 million possible pairings of 7,794 sequences, the average percentile rank of the distance given by fold homologs is 22.5% (raw mean rank of 6,833,494) using the AAC classifier, and 20.8% (raw mean rank of 6,332,612) using the STC classifier, a rank improvement of 500,882 (7.3%) or a percentile difference of 1.7%. While the plot shows that the distribution of ranks is similar for the two classifiers, the advantage of using STC is shown by a detectible shift of the rank distribution towards lower ranks (i.e., the proportion of pairs is increased in the region below the 27th percentile, and decreased correspondingly in the region above the 40th percentile).
FIGURE 3.

The distribution of percentile ranks of the distances between true fold homolog pairs for the STC and AAC classifiers. The percentile ranks are calculated by locating the position of the distances of homolog pairs in the spectrum of all 30 million distances calculated from every pair in the data set (irrespective of homology). The plot shows that STC classifier improves the average percentile rank of fold homolog distances in a significant manner across the board.
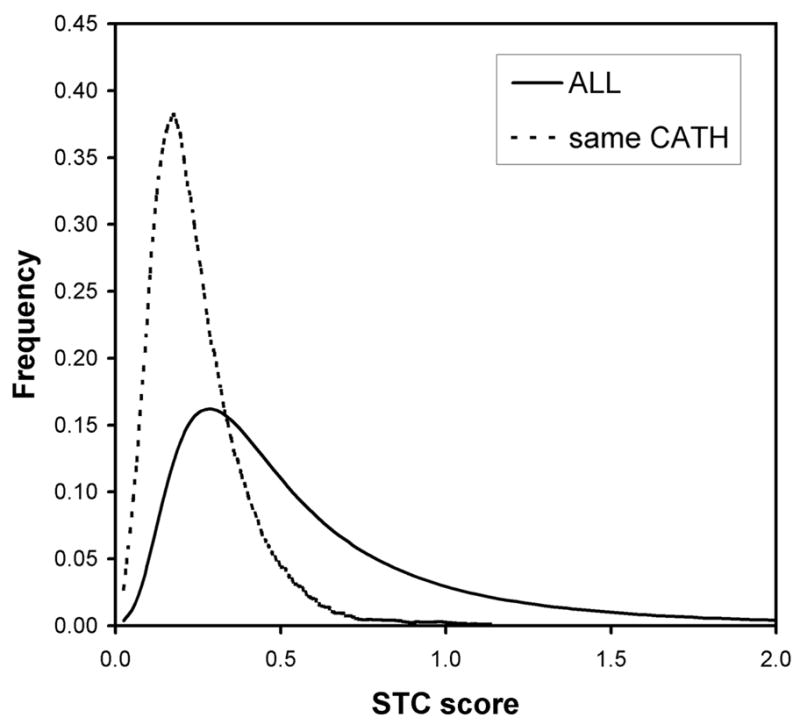
We examine the distances given by the STC classifier further. In Figure 4, we confirm that the STC distances are significantly smaller for sequence pairs that occur in the same H class as compared to typical STC distances given by a sequence pair in our data set of fold homologs. Looking further at the STC distances reveals an important advantage of alignment-free procedures. We plotted the frequency of scores of fold homologs (same H class) in our data set according to their difference in chain length in Figure 5. The plot compares the proportion of pairs judged to be homologous by BLAST and by STC. The criteria for these two methods have been relaxed, to aid in the comparison: for BLAST, any score of 22 bits (or any E-value on the order of 1.0) was taken to be an alignment; and for STC, any distance less than 0.379, the mean distance for pairs in the same H class, was taken to be indicative of homology. The plot illustrates that traditional alignment rapidly loses effectiveness as the difference in chain length between the two query sequences increases. At length differences over 50 residues, STC detects twice the number of fold homologs as BLAST, demonstrating the relative insensitivity of alignment-free methods to variability in length. As a further illustration, we plotted in Figure 6 the STC scores of pairs, of significantly different lengths (i.e., greater than 100 residues), that BLAST judged to be non-homologous. The distribution of scores for those pairs that are actual fold homologs (again, as defined by the H class) is shifted significantly towards low STC distances, compared to the scores of all pairs of chains that differ by more than 100 residues in length. Despite high chain length variability, the STC measure is able to assign consistently lower distances to pairs of fold homologs, including those undetectible by traditional alignment.
FIGURE 4.

The distribution of STC distances of the ensemble of fold homologous pairs (i.e., same CATH classification) as compared to the STC distances given by the entire data set (irrespective of homology).
FIGURE 5.

The distribution of scores of true fold homologs (same H classification in CATH) partitioned by difference in chain lengths of the homologous pair. For the BLAST classifier, any score of 22 bits (or any E-value on the order of 1.0) was taken to be an alignment (and therefore indicative of homology). For the STC classifier, any distance less than 0.379, the mean distance for pairs in the same H classification, was taken to be indicative of homology.
FIGURE 6.
The distribution of STC scores of true homologous pairs of significantly different chain lengths (i.e., greater than 100 residues) that BLAST judged to be non-homologous. The distribution of scores for those pairs that are actual fold homologs (again, as defined by the H classification) is shifted significantly towards low STC distances, compared to the scores of all pairs of chains that differ by more than 100 residues in length irrespective of homology.
Next, we examine the ability of STC to differentiate the different homologous superfamilies (H level). In this analysis, we consider only 40 superfamilies represented by at least 25 sequences in our fold homolog data set to have an adequate number of data points for stable measurements. We first ask how distinct these 40 superfamilies are if STC is used to characterize them. One way to measure family integrity is to compare the intra-family STC distances with inter-family distances. To accomplish this, we computed the following quantities: (a) the intra-family mean STC distance from every pair of homologous sequences in each family; (b) the interfamily mean STC distance, derived from every pair of sequences taken from different families; and (c) an integrity factor for every superfamily, which is the proportion of mean interfamily distances that are larger than the mean intra-family distance.
An integrity factor equal to 1.0 means that the superfamily can be sufficiently delineated in factor space if STC (or any other classifier) is used, while an integrity factor below 1.0 indicates considerable dispersion of the sequences in factor space relative to other superfamilies. The integrity factor values for each of the 40 superfamilies are tabulated in Table III. There are 6 families with perfect integrity, and an additional 4 with near-perfect integrity. It should be noted that the set of families run the span of integrity scores, suggesting that the STC classifier cannot identify all fold homolog families with equal consistency.
TABLE III.
Detection of major superfamilies by AAC and STC*
| STC-20 | STC-20 | AAC | AAC | |||
|---|---|---|---|---|---|---|
| CATH | HOMOLOGOUS SUPERFAMILY | INTEGRITY | ACC-1 | ACC-3 | ACC-1 | ACC-3 |
| 1.10.510.10 | Transferases | 1.00 | 0.87 | 0.96 | 0.96 | 0.96 |
| 3.20.20.80 | Glycosidases (TIM Barrel) | 1.00 | 0.81 | 0.94 | 0.63 | 0.83 |
| 2.10.25.10 | Laminin | 1.00 | 0.74 | 0.86 | 0.91 | 0.94 |
| 3.20.20.70 | Aldolases (TIM Barrel) | 1.00 | 0.72 | 0.89 | 0.46 | 0.78 |
| 2.60.120.20 | Virus/viral protein (Jelly roll) | 1.00 | 0.71 | 0.84 | 0.94 | 0.97 |
| 1.20.1250.10 | Cytokine/growth hormone | 1.00 | 0.56 | 0.64 | 0.52 | 0.72 |
| 3.10.100.10 | Mannose-binding protein A | 0.98 | 0.44 | 0.70 | 0.33 | 0.47 |
| 3.40.640.10 | Aspartate aminotransferase-like | 0.98 | 0.38 | 0.83 | 0.68 | 0.80 |
| 3.40.50.1820 | Hydrolase (Rossmann fold) | 0.98 | 0.10 | 0.58 | 0.05 | 0.63 |
| 3.40.50.150 | Vaccinia virus protein (Rossmann fold) | 0.98 | 0.09 | 0.75 | 0.11 | 0.58 |
| 3.60.20.10 | Glutamine phosphoribosylpyrophosphate | 0.95 | 0.27 | 0.55 | 0.62 | 0.93 |
| 2.60.120.200 | Agglutinin (Jelly roll) | 0.95 | 0.02 | 0.66 | 0.07 | 0.59 |
| 1.10.490.10 | Globins | 0.93 | 0.52 | 0.67 | 0.07 | 0.22 |
| 2.60.120.260 | Galactose-binding domain-like (Jelly roll) | 0.93 | 0.15 | 0.46 | 0.00 | 0.11 |
| 2.60.40.420 | Cupredoxins (Immunoglobulin-like) | 0.91 | 0.24 | 0.41 | 0.05 | 0.18 |
| 2.10.70.10 | Complement module, domain 1 | 0.91 | 0.23 | 0.57 | 0.13 | 0.40 |
| 3.40.50.300 | nucl.triphosphate hydrolase (Rossmann fold) | 0.91 | 0.00 | 0.19 | 0.01 | 0.20 |
| 3.40.50.720 | NAD(P) binding domain (Rossmann fold) | 0.91 | 0.00 | 0.11 | 0.00 | 0.09 |
| 2.40.70.10 | Acid proteases | 0.88 | 0.13 | 0.57 | 0.13 | 0.40 |
| 3.50.50.60 | Hydrolase inhibitor | 0.88 | 0.09 | 0.22 | 0.11 | 0.37 |
| 2.60.40.10 | Immunoglobulins (Immunoglobulin-like) | 0.88 | 0.03 | 0.19 | 0.00 | 0.08 |
| 3.40.50.620 | RNA synthetase (Rossmann fold) | 0.88 | 0.00 | 0.06 | 0.00 | 0.08 |
| 2.60.120.10 | Jelly rolls (Jelly roll) | 0.81 | 0.02 | 0.21 | 0.00 | 0.10 |
| 2.30.42.10 | Cell adhesion | 0.79 | 0.06 | 0.11 | 0.14 | 0.38 |
| 3.40.50.2300 | Signaling protein (Rossmann fold) | 0.79 | 0.00 | 0.18 | 0.00 | 0.07 |
| 2.60.40.30 | Fibronectin type III (Immunoglobulin-like) | 0.79 | 0.00 | 0.10 | 0.00 | 0.10 |
| 2.80.10.50 | Hormone/growth factor | 0.77 | 0.00 | 0.21 | 0.00 | 0.03 |
| 3.90.1150.10 | Aspartate aminotransferase, domain 1 | 0.77 | 0.00 | 0.28 | 0.02 | 0.09 |
| 1.10.238.10 | EF hand | 0.74 | 0.00 | 0.15 | 0.18 | 0.32 |
| 2.40.30.10 | Translation factors | 0.74 | 0.00 | 0.08 | 0.21 | 0.31 |
| 3.40.630.30 | Transferases | 0.74 | 0.00 | 0.00 | 0.00 | 0.00 |
| 3.40.190.10 | Periplasmic binding protein-like II | 0.74 | 0.00 | 0.00 | 0.00 | 0.08 |
| 1.10.10.10 | “Winged helix” repressor DNA binding domain | 0.63 | 0.00 | 0.01 | 0.00 | 0.01 |
| 3.40.30.10 | Glutaredoxin | 0.63 | 0.00 | 0.00 | 0.00 | 0.03 |
| 3.30.70.330 | RNA-binding protein | 0.60 | 0.00 | 0.00 | 0.00 | 0.00 |
| 2.40.10.10 | Trypsin-like serine proteases | 0.60 | 0.00 | 0.00 | 0.00 | 0.01 |
| 3.30.200.20 | Phosphorylase kinase | 0.58 | 0.00 | 0.00 | 0.10 | 0.26 |
| 2.40.50.140 | Isomerase | 0.47 | 0.00 | 0.00 | 0.00 | 0.03 |
| 1.10.10.60 | Homeodomain-like | 0.42 | 0.18 | 0.34 | 0.04 | 0.18 |
| 2.30.30.40 | SH3 domains | 0.21 | 0.00 | 0.00 | 0.00 | 0.00 |
Table headings have the following definitions: (a) CATH: the ID code given by CATH; (b) HOMOLOGOUS SUPERFAMILY: the H-level groups in CATH with at least 25 members in our data set; (c) INTEGRITY: the integrity factor, which is a comparison of two quantities: namely, the intra-family mean STC distance from every pair of homologous sequences in each family, and the interfamily mean STC distance, derived from every pair of sequences taken from different families. The integrity factor is the proportion of mean interfamily distances that are larger than the mean intra-family distance. (Thus, an integrity factor of 1.0 means that the superfamily can be sufficiently delineated in factor space via STC.) (d) STC-20: the STC profile using 20 reduced tetramer clusters; (e) AAC: amino acid composition profile; (f) ACC-1: the accuracy rate of identifying the correct superfamily, for each member of the superfamily, as top choice; (g) ACC-10: the accuracy rate of identifying the correct superfamily, for each member of the superfamily, as among the top three. NOTE: shaded values are those that differ by 0.1 when STC-20 and AAC accuracies are compared.
To measure the predictive performance of the STC classifier, we also designed a simple classification algorithm, which assigns a query sequence to the superfamily “closest” to it. We took the mean distance between the query sequence and each of the members of a particular superfamily as a measure of distance, and the closest superfamily is that which gives the lowest mean distance. We applied it to all the sequences in our data set, and asked how many of them were assigned to the correct superfamily. To gauge the advantage of using the reduced tetramer over the monomer composition, we also repeated this classification test using the AAC classifier.
The accuracy rates of both STC and AAC classifiers are summarized in Table III. The accuracy of identifying the correct superfamily as top choice (ACC-1) and as among the top three (ACC-3) are included. Significant differences in accuracy between the two classifiers (0.1 or more) are indicated by shading. The first observation is that the STC and AAC classifiers differ significantly in the accuracy of predicting membership in 24 out of 40 superfamilies. There are families which STC is superior in identifying homology, including both TIM barrel families (glycosidases and aldolases), mannose-binding protein A, globins, cupredoxins, complement module (domain 1), and homeodomain-like domains. On the other hand, AAC is superior to STC in identifying homology within the following superfamilies: virus/viral proteins, glutamine PRPP, EF hand, translation factor, and phosphorylase kinase.
The improvement in homology detection by STC over AAC for a number of families suggests an encoding of higher-order structural propensity signals in short fragments that is common across family members, but not directly apparent from amino acid composition. If these short fragments can be thought of as building blocks each of which has specific structural propensities, then the STC descriptor in effect supplements our understanding by providing a more structure-based description of composition. Detection of similarity in structure-based fragment distribution among seemingly unrelated sequences of the same fold suggests that there are local structural signals hidden in the sequence that are essential in determining the fold of these superfamilies. The existence of such STC “signatures,” and the uniqueness of the distribution of these signals in particular homologous families (such as TIM barrels) may be useful traits for the correct assignment of newly sequenced domains to these folds.
On the other hand, it appears that there are useful patterns in amino acid composition that homologous sequences share in particular superfamilies that are not reflected in their tetramer fragment compositions. While the STC classifier outperforms the AAC classifier over-all, as measured by their ROC curves, these superfamily classification results suggests that STC does not embody all of the information encoded in AAC. This appears to be contradictory, since tetramer composition ought to implicitly include the information in single-residue composition. But our methodology compresses the amino acid alpabet and clusters structurally similar tetramers, and therefore some information is inevitably lost. A more thorough analysis is necessary to trace the difference in information between these two sequence descriptors.
Finally, the scope of this study has allowed for a critical evaluation of the performance of alignment-free procedures vis-à-vis traditional alignment in homology detection. AUC measurements of ROC curves reveal an advantage of STC over BLAST and PSI-BLAST in detecting homologous pairs in a data set of sequences with less than 35% pairwise identity. These AUC measurements are, by definition, evaluated over the entire range of false positive rates. However, the ROC curves also illustrate the distinct advantage of sequence alignment over any composition-vector-based homology method: most any true homology detection by BLAST or PSI-BLAST does not come at a significant cost in terms of false positives. In other words, those pairs deemed homologous by BLAST or PSI-BLAST are most certainly homologous; conversely, pairs that are actually homologous but have no discernible sequence alignment will, obviously, never be detected by BLAST or PSI-BLAST. STC and other alignment-free methods, on the other hand, are able to identify more true homologs, but at some cost in terms of false positives. This leads us to recognize the complementarity of alignment and alignment-free methods in homology detection: sequence alignment remains the most certain signal of structural homology, while alignment-free methods such as STC can potentially assist in identifying homologs among chains bearing no discernible sequence similarity.
We recognize that the significant rate of false positives currently produced by STC will not make it a practical stand-alone tool as of yet, but incorporating it into a more comprehensive strategy may make it useful in homology detection. We note that the existence of STC “signatures” has the potential to make STC and other composition-vector-based methods a good predictive tool for specific folds and families. Nonetheless, future work should explore ways to reduce the false positive rate. One promising avenue is to explore longer length scales in assembling the composition vector. If AUC measurements are improved by going from single-residue (AAC) to tetramer (STC) composition profiles, then perhaps deriving the best sequence reduction at longer length scales will further improve accuracies.
4. Conclusion
Significant similarity in amino acid sequence among proteins, as detected by sequence alignment, is regarded as a strong indicator of structural homology. The challenge in protein structure modeling is that the reverse is not always true. There exist structurally homologous proteins which do not share any similarity in sequence detectible by sequence alignment. However they emerged, information is encoded in their amino acid sequences which causes them to fold into similar conformations. What are these shared features among “highly divergent” sequences? The amino acid composition (AAC) is among those shared features. AAC is the simplest description of a protein sequence, reducing the chain of amino acids of any length to a 20-dimensional vector. It has been observed that AAC is an excellent indicator of secondary structure class (i.e., α, β, α/β, α+β, and irregular), and that proteins belonging in these classes separate distinctly in composition space.9–11 Because amino acids have varying propensities for helical and extended backbone conformations,35 the aggregate of these propensities, as dictated by amino acid composition, ought to be able to sufficiently indicate the relative contents of α and β secondary structures. Methods exist to predict the secondary structure content of a protein chain given only the sequence, partly stemming from this phenomenon. Going higher in detail than the three (or four) structural classes, a number of studies have examined the viability of using AAC (in combination with other global sequence features) in classifying sequences into a limited number of folds (at the T level of CATH).12–14;16–20 Our work, in extending these investigations, finds evidence of the ability of the composition vector to find structural homology among sequences coming from a much more inclusive set of 1,084 topologies or folds and 2,091 homologous families.
Growing interest in methods employing AAC and related composition vectors in determining structural homology stems from their computational efficiency and algorithmic simplicity.3 Such alignment-free methods are able to classify and analyze large sets of sequences, increasingly important for dealing with growing genomic and proteomic databases. A number of them have supplemented composition profiles with other aggregate properties of the protein sequence, including hydrophobicity patterns and molecular weight (e.g. ref. [24]), which appear to increase prediction power. An effective strategy is to use longer length scale composition (e.g., the dipeptide composition profile), in order to reinstate some of the sequence information, while still retaining all the advantages of alignment-free algorithms.17;21;22;23;25 The challenge is that extending to higher length scales exponentially increases the dimensionality of the composition vector.
In this work, we examined the use of tetramers to elucidate structural homology among sequences with low pairwise sequence identity. To circumvent the problem of high dimensionality, we designed a procedure to collapse 160,000 tetramers into 15 to 30 groups, via a two-step clustering method based solely on maximizing structural information. The performance of the resulting STC classifier was measured by its ability to detect fold homolog pairs, at the T and H levels of CATH, in a large data set of domain sequences at and below the “twilight zone” of sequence similarity (i.e., ≤ 35% pairwise sequence identity). These were compared to results given by the AAC classifier and by alignment using BLAST and PSI-BLAST. More than 30 million pairwise comparisons between domain sequences in the data set generated the ROC curve in Figure 2. The area under the ROC curve reveals that STC is an improvement over the AAC classifier, and certainly over the BLAST and PSI-BLAST alignment classifier. (We recognize that superior homology detection tools that employ profile-profile alignment (such as HHPred36) exist, whose performance in this data set vis-à-vis the STC method remains to be evaluated.)
Increased performance of STC over AAC points to the ability of the former to incorporate higher order structural information in the reduced tetramer sequence, beyond the general secondary structure propensities encoded in individual amino acids. We observe that the relative percentile ranking of the distances assigned between homologous pairs among all possible pairs in the data set, irrespective of homology, is increased significantly when STC is used instead of AAC. Recalling that the STC classifier arises from a reduced alphabet of tetramers that take into account local structural propensities, these results suggest that similarity in the aggregate composition of structural propensities encoded in the sequence can be indicative of fold family. At the conceptual level, it may be that diverse sequences in the same fold families share similar local folding signals which are encoded in the tetramer “jigzaw puzzle” pieces.
We compared the ability of both classifiers to detect the 40 largest superfamilies in the data set (Table III). It is interesting to note that there are fold families that are better detected by the tetramer-level alphabet, alluding to the possibility of identifying specific STC signatures or folding instructions that are encoded in the local level for these families. However, not all fold families are better detected by STC, suggesting the heterogeneity of the factors relevant to determining structure. We will examine these issues more closely in future work, together with other questions relating to the actual nature of tetramer-level structural coding in the specific domain superfamilies where STC performs significantly better than AAC.
Contributor Information
Armando D. Solis, Email: asolis@citytech.cuny.edu.
Shalom R. Rackovsky, Email: shalom.rackovsky@mssm.edu.
References
- 1.Rost B. Twilight zone of protein sequence alignments. Prot Eng. 1999;12:85–94. doi: 10.1093/protein/12.2.85. [DOI] [PubMed] [Google Scholar]
- 2.Bowie JU, Reidhaar-Olson JF, Lim WA, Sauer RT. Deciphering the message in protein sequences: tolerance to amino acid substitution. Science. 1990;247:1306–10. doi: 10.1126/science.2315699. [DOI] [PubMed] [Google Scholar]
- 3.Vinga S, Almeida J. Alignment-free sequence comparison a review. Bioinformatics. 2003;19:513–523. doi: 10.1093/bioinformatics/btg005. [DOI] [PubMed] [Google Scholar]
- 4.Eisenhaber F, Imperiale F, Argos P, Frommel C. Prediction of secondary structural content of proteins from their amino acid composition alone. I. New analytic vector decomposition methods. Prot Struct Funct Genet. 1995;25:157–168. doi: 10.1002/(SICI)1097-0134(199606)25:2<157::AID-PROT2>3.0.CO;2-F. [DOI] [PubMed] [Google Scholar]
- 5.Eisenhaber F, Frommel C, Argos P. Prediction of secondary structural content of proteins from their amino acid composition alone. II. The paradox with secondary structural class. Prot Struct Funct Genet. 1995;25:169–179. doi: 10.1002/(SICI)1097-0134(199606)25:2<169::AID-PROT3>3.0.CO;2-D. [DOI] [PubMed] [Google Scholar]
- 6.Zhang Z, Sun S-R, Zhang C-T. A new approach to predict the helix/strand content of globular proteins. J Theor Biol. 2001;208:65–78. doi: 10.1006/jtbi.2000.2201. [DOI] [PubMed] [Google Scholar]
- 7.Coeytaux K, Poupon A. Prediction of unfolded segments in a protein sequence based on amino acid composition. Bioinform. 2005;21:1891–1900. doi: 10.1093/bioinformatics/bti266. [DOI] [PubMed] [Google Scholar]
- 8.Han P, Zhang X, Norton RS, Feng Z-P. Predicting disordered regions in proteins based on decision trees of reduced amino acid composition. J Comput Biol. 2006;13:1723–1734. doi: 10.1089/cmb.2006.13.1723. [DOI] [PubMed] [Google Scholar]
- 9.Nakashima H, Nishikawa K, Ooi T. The folding type of a protein is relevant to the amino acid composition. J Biochem. 1986;99:153–162. doi: 10.1093/oxfordjournals.jbchem.a135454. [DOI] [PubMed] [Google Scholar]
- 10.Wang Z-X, Yuan Z. How good is prediction of protein structural class by the component-coupled method? Prot Struct Funct Genet. 2000;38:165–175. doi: 10.1002/(sici)1097-0134(20000201)38:2<165::aid-prot5>3.0.co;2-v. [DOI] [PubMed] [Google Scholar]
- 11.Du Q-S, Jiang Z-Q, He W-Z, Li D-P, Chou K-C. Amino acid principal component analysis (AAPCA) and its applications in protein structural class prediction. J Biomol Struct Dyn. 2006;23:635–640. doi: 10.1080/07391102.2006.10507088. [DOI] [PubMed] [Google Scholar]
- 12.van Heel M. A new family of powerful multivariate statistical sequence analysis techniques. J Mol Biol. 1991;220:877–997. doi: 10.1016/0022-2836(91)90360-i. [DOI] [PubMed] [Google Scholar]
- 13.Reczko M, Bohr H. The DEF data base of sequence based protein fold class predictions. Nucl Acids Res. 1994;22:3616–3619. [PMC free article] [PubMed] [Google Scholar]
- 14.Dubchak I, Muchnik I, Holbrook SR, Kim S-H. Prediction of protein folding class using global description of amino acid sequence. Proc Natl Acad Sci USA. 1995;92:8700–8704. doi: 10.1073/pnas.92.19.8700. [DOI] [PMC free article] [PubMed] [Google Scholar]
- 15.Hobohm W, Sander C. A Sequence Property Approach to Searching Protein Databases. J Mol Biol. 1995;255:390–399. doi: 10.1006/jmbi.1995.0442. [DOI] [PubMed] [Google Scholar]
- 16.Ding CHQ, Dubchak I. Multi-class protein fold recognition using support vector machines and neural networks. Bioinform. 2001;17:349–358. doi: 10.1093/bioinformatics/17.4.349. [DOI] [PubMed] [Google Scholar]
- 17.Edler L, Grassmann J, Suhai S. Role and results of statistical methods in protein fold class prediction. Math Comput Model. 2001;33:1401–1417. [Google Scholar]
- 18.Shen H-B, Chou K-C. Ensemble classifier for protein fold pattern recognition. Bioinform. 2006;22:1717–1722. doi: 10.1093/bioinformatics/btl170. [DOI] [PubMed] [Google Scholar]
- 19.Ofran Y, Margalit H. Proteins of the same fold and unrelated sequences have similar amino acid composition. Prot Struct Funct Bioinfom. 2006;64:275–279. doi: 10.1002/prot.20964. [DOI] [PubMed] [Google Scholar]
- 20.Taguchi Y-h, Gromiha MM. Application of amino acid occurrence for discriminating different types of globular proteins. BMC Bioinform. 2007;8:404. doi: 10.1186/1471-2105-8-404. [DOI] [PMC free article] [PubMed] [Google Scholar]
- 21.Pertilli P. Classification of protein sequences by their dipeptide composition. CABIOS. 1993;9:205–209. doi: 10.1093/bioinformatics/9.2.205. [DOI] [PubMed] [Google Scholar]
- 22.Gracy J, Argos P. Automated protein sequence database classification. I. Integration of compositional similarity search, local similarity search, and multiple sequence alignment. Bioinform. 1998;14:164–173. doi: 10.1093/bioinformatics/14.2.164. [DOI] [PubMed] [Google Scholar]
- 23.Deshmukh S, Khaitan S, Das D, Gupta M, Wangikar PP. An alignment-free method for classification of protein sequences. Prot Pept Lett. 2007;14:647–657. doi: 10.2174/092986607781483804. [DOI] [PubMed] [Google Scholar]
- 24.Homaeian L, Kurgan LA, Ruan J, Cios KJ, Chen K. Prediction of protein secondary structure content for the twilight zone sequences. Prot Struct Funct Bioinform. 2007;69:486–498. doi: 10.1002/prot.21527. [DOI] [PubMed] [Google Scholar]
- 25.Kurgan L, Chen K. Prediction of protein structural class for the twilight zone sequences. Biochem Biophys Res Comm. 2007;357:453–460. doi: 10.1016/j.bbrc.2007.03.164. [DOI] [PubMed] [Google Scholar]
- 26.Solis AD, Rackovsky S. Optimally informative backbone structural propensities in proteins. Prot Struct Funct Genet. 2002;48:463–86. doi: 10.1002/prot.10126. [DOI] [PubMed] [Google Scholar]
- 27.Solis AD, Rackovsky S. Improvement of statistical potentials and threading score functions using information maximization. Prot Struct Funct Bioinform. 2006;62:892–908. doi: 10.1002/prot.20501. [DOI] [PubMed] [Google Scholar]
- 28.Melo F, Marti-Renom MA. Accuracy of sequence alignment and fold assessment using reduced amino acid alphabets. Prot Struct Funct Bioinform. 2006;63:986–995. doi: 10.1002/prot.20881. [DOI] [PubMed] [Google Scholar]
- 29.Peterson EL, Kondev J, Theriot JA, Phillips R. Reduced amino acid alphabets improve the sensitivity and selectivity of pairwise sequence alignments. Bioinformatics. 2009;25:1356–62. doi: 10.1093/bioinformatics/btp164. [DOI] [PMC free article] [PubMed] [Google Scholar]
- 30.Orengo CA, Michie AD, Jones S, Jones DT, Swindells MB, Thornton JM. CATH a hierarchic classification of protein domain structures. Structure. 1997;5(8):1093–108. doi: 10.1016/s0969-2126(97)00260-8. [DOI] [PubMed] [Google Scholar]
- 31.Orengo CA, Martin AM, Hutchinson G, Jones S, Jones DT, Michie AD, Swindells MB, Thornton JM. Classifying a protein in the CATH database of domain structures. Acta Crystallogr D Biol Crystallogr. 1998;54:1155–67. doi: 10.1107/s0907444998007501. [DOI] [PubMed] [Google Scholar]
- 32.Orengo CA, Pearl FM, Bray JE, Todd AE, Martin AC, Lo Conte L, Thornton JM. The CATH Database provides insights into the protein structure/function relationships. Nucleic Acids Res. 1999;27:275–9. doi: 10.1093/nar/27.1.275. [DOI] [PMC free article] [PubMed] [Google Scholar]
- 33.Fawcett T. An introduction to ROC analysis. Pattern Recog Lett. 2006;27:861–874. [Google Scholar]
- 34.Sonego P, Kocsor A, Pongor S. ROC analysis: applications to the classification of biological sequences and 3D structures. Brief Bioinform. 2008;9:198–209. doi: 10.1093/bib/bbm064. [DOI] [PubMed] [Google Scholar]
- 35.Koehl P, Levitt M. Structure-based conformational preferences of amino acids. Proc Natl Acad Sci USA. 1999;96:12524–9. doi: 10.1073/pnas.96.22.12524. [DOI] [PMC free article] [PubMed] [Google Scholar]
- 36.Söding J, Biegert A, Lupas AN. The HHpred interactive server for protein homology detection and structure prediction. Nucleic Acids Res. 2005;33:W244–W248. doi: 10.1093/nar/gki408. [DOI] [PMC free article] [PubMed] [Google Scholar]