Abstract
In this work, we study the collective behaviour of fish shoals in annular domains. Shoal mates are modelled as self-propelled particles moving on a discrete lattice. Collective decision-making is determined by information exchange among neighbours. Neighbourhoods are specified using the perceptual limit and numerosity of fish. Fish self-propulsion and obedience to group decisions are described through random variables. Spatio-temporal schooling patterns are measured using coarse observables adapted from the literature on coupled oscillator networks and features of the time-varying network describing the fish-to-fish information exchange. Experiments on zebrafish schooling in an annular tank are used to validate the model. Effects of group size and obedience parameter on coarse observables and network features are explored to understand the implications of perceptual numerosity and spatial density on fish schooling. The proposed model is also compared with a more traditional metric model, in which the numerosity constraint is released and fish interactions depend only on physical configurations. Comparison shows that the topological regime on which the proposed model is constructed allows for interpreting characteristic behaviours observed in the experimental study that are not captured by the metric model.
Keywords: biological models, collective behaviour, complex systems, graph theory, synchronization
1. Introduction
Fish schooling is an evolutionarily refined collective behaviour that optimizes beneficial aspects of social life, such as predator evasion and swimming efficiency (e.g. Weihs 1973; Partridge 1982; Pitcher & Parrish 1993). Even the most primitive decisions of gregarious fish, such as spawning and eating, are informed by the climate within the school (Pitcher & Parrish 1993). Schooling is characterized by alignment of bodies and coordinated swimming velocity throughout the school (Partridge 1982). In addition, this collective behaviour is identified by characteristic spatio-temporal patterns of the school, including relatively small distances among adjacent individuals, hydrodynamically motivated staggering of leaders and followers, and sharp delineation of the group as a whole in space (Weihs 1973; Partridge 1982).
The mechanics of schooling depends on the sensory capabilities of each individual fish. Sensing, including vision and chemical/flow sensing, determines schooling behaviour (e.g. Partridge & Pitcher 1980). Fish schools can be comprised of single or multiple species (Krause et al. 1996, 2005), many or few fish (Partridge 1980), experienced or novice foragers (Lachlan et al. 1998; Reebs 2000, 2001), or shy or bold mates (Leblond & Reebs 2006). External stimuli generally affect schooling tendency and can promote individual versus collective behaviour. For example, schools can temporarily fragment under perceived predation (Sumpter et al. 2008) and can become more well defined under intense light conditions or in the presence of leaders (Tegeder & Krause 1995; Torisawa et al. 2007).
Mathematical models of collective behaviour fall into two major categories, which consider the school as either a continuum (e.g. Topaz et al. 2006), or as a collection of individuals (e.g. Couzin et al. 2002; D'Orsogna et al. 2006). Here, we take on an individual-based model as it lends itself to implementation in our experimental study, where only relatively small fish schools are considered.
Individual-based models have been extensively studied in the literature (Aoki 1982; Niwa 1994; Couzin et al. 2002; Erdmann et al. 2005). Group mates are sometimes considered as self-propelled particles communicating through short- and long-distance potentials (e.g. Niwa 1996; Olfati-Saber 2006; Chuang et al. 2007; Li 2008). Alternatively, individuals' interactions can be described using behavioural rules that simulate the complex decision-making in animal groups (e.g. Parrish et al. 2002; Viscido et al. 2004; Zheng et al. 2005). These models are capable of reproducing different collective behaviours found in nature, from swarming to highly polarized schooling, and allow for understanding important group reactions, such as escaping from predation. Experimental validations of such models are presented in Aoki (1984) and Viscido et al. (2007). Some models assume the speed of individuals to be constant (e.g. Couzin et al. 2002; Kolpas et al. 2007, 2008), while a few others describe the individual speed through a random variable (Aoki 1982). A probabilistic speed can approximate a more realistic condition of a wide range of individual speeds. Important relationships between experimental observations and modelling efforts are discussed in Sumpter (2006). While many of these models examine realistic two- and three-dimensional environments, recently, one-dimensional problems have been considered in the literature (Kolpas et al. 2007, 2008; Yates et al. 2009). The reduction of the problem to one dimension allows for highlighting specific features of fish schooling, while limiting the computational complexity to the core of the phenomenon.
We consider an individual-based model with both deterministic and stochastic components. As in Aoki (1982), we adopt a stochastic approach to describe the fish self-propulsion. In addition, we partially account for the complexity of fish decision-making through a random variable that condenses the fish will to follow the group motion, referred to as obedience. This is easily applicable to one-dimensional models and a similar approach is proposed in Kolpas et al. (2007). The parameter for the random variable used to describe motion in the model is derived from experimental observations. The effect of variations of fish obedience on the collective behaviour of schools of different sizes is also studied. Inspired by the transformative results in Ballerini et al. (2008) we use topological distances to specify the information exchange in the school. That is, we assume that each fish interacts with a set of mates within its perception range and that this set is selected using a random variable. The cardinality of this set of neighbours is fixed and depends on the fish species (Partridge 1981). We implement our model in a one-dimensional environment similar to Kolpas et al. (2007); however, we realize the domain as a circle instead of the real line. Not only is this a practical laboratory construction, the periodicity inherent in the set-up inhibits individual isolation as the group size increases and potentially enriches the collective dynamics of the group when compared with infinitely extended domains. We introduce two coarse observables to analyse fish schooling in the ring. These observables are used to provide a first experimental validation of topologically identified interactions in fish schools. In addition, we use tools from complex systems and graph theory (e.g. Bollobas 1998; Gonzalez-Miranda 2004; Wu 2007) to elucidate the role of each fish in the school. By considering the network formed by fish-to-fish interactions, we introduce significant descriptors of fish schooling. We analyse degree centrality, betweenness centrality and connectivity to provide useful insight into the schooling phenomenon.
The paper is organized as follows. In §2, we describe the mathematical model developed to study the schooling behaviour. In §3, we outline the experiment and analyse results from live fish. In §4, we present a parametric study of fish schooling. Discussion of the results and conclusions are presented in §5. Appendix A on graph theory results used in this paper appears after the conclusions.
2. Modelling
In agreement with traditional nomenclature, we define a shoal to be a social aggregation of fish and a school to be a group within the shoal that exhibits a collective behaviour (e.g. Pitcher & Parrish 1993). The definition of neighbours dictates the flow of information within the group and is specific to the underlying modelling framework. In metric models, information flow is exclusively governed by the physical configuration of the group (e.g. Aoki 1982; Couzin et al. 2002). In topological models, animal perception is used to detach information flow from geometrical constraints (Ballerini et al. 2008).
A metric regime is often pursued in the modelling of animal groups. This approach relies on the partition of the animal perception region into physical zones within which characteristic social behaviours are prescribed. For example, the perception region of fish is generally partitioned into the zones of repulsion, orientation and attraction (Couzin et al. 2002). However, some relevant observed features of schooling, such as macroscopic variations of school physical dimension and limits to physical perception, are better explained by detaching information sharing from physical distances (Ballerini et al. 2008). Interactions among topological rather than metric neighbours allow the physical distance between neighbours to vary while maintaining the flow of information among them. This regime centres on the phenomenon of perceptual numerosity that sets a critical limit of perceivable numbers and thus limits the degree of distribution of the graph describing fish-to-fish interactions.
2.1. Shoal dynamics
We consider a shoal of N fish on a circular ring of radius R centred at the origin O of a Cartesian coordinate system Oxy. We assume that the time variable is discrete and we use  to identify the generic time instant. We also discretize the circular domain of the position variable to CT cells,
  . We assume that there is no limit to the number of fish that can reside in the same cell and we assume the fish to be identical. At time t, the state of fish i in the shoal is described by its position pi(t) and its heading hi(t). The heading of fish i belongs to {−1, +1}, where +1 denotes counterclockwise heading and −1 clockwise. The cellular position along the ring belongs to {0, 1, … , CT − 1}. We denote the maximum possible cells perceived by fish i in the direction of its heading as the number of cells Cp. The region perceived by fish i extends Cp cells from pi(t) in the direction of hi(t).
We employ a topological regime to define interactions in the model. More specifically, we assume that a fish interacts with at most n of its perceivable shoal mates, where n is the numerosity constant. For each time t, shoal mates of fish i are sought in its cell pi(t). If fish i does not have at least n neighbours in its cell, we extend our search in the direction of hi(t) by adding cells until fish i has at least n potential neighbours or until the perceptual limit of the fish is reached. We choose at most n neighbours from this set of perceived shoal mates by using a uniformly distributed random variable. At time t, we define the set of topological neighbours of fish i as the indices of these fish and denote this set as 𝒩i(t). This selection criterion causes interactions to be more probable among fish that are physically proximal. Such fish may visually occlude further shoal mates. Therefore, neighbourhoods are affected by both the physical configuration of the shoal mates and their perceptual capability.
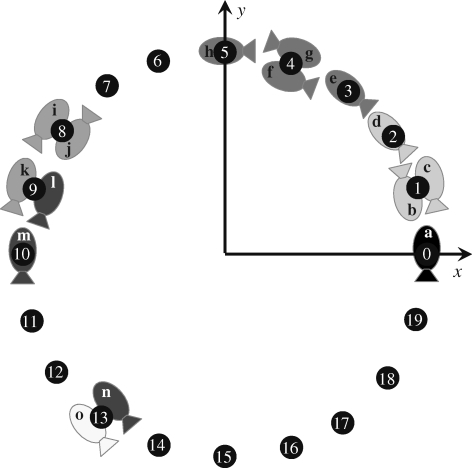
Figure 1 illustrates the neighbours' selection algorithm with two examples at a given time. Suppose Cp = 5 and n = 3. Fish a in cell 0 has fish b, c and d in cells 1 and 2 as topological neighbours, while it can perceive fish b, c, d, e, f, g and h in the cell set {1, 2, 3, 4, 5}. Fish o in cell 13 has fish l, m and n in the cell set {9, 10, 13} as topological neighbours, while it can perceive fish i, j, k, l, m and n in the cell set {8, 9, 10, 13}. Notice that fish l is a topological neighbour of fish o while fish k is not, although they share the same cell. According to our algorithm, we search for fish o's potential neighbours in cells 13, 12, 11 and 10 without finding at least three shoal mates. When we examine cell 9, we have a total of four potential neighbours from which to choose. The selection of which three of these four shoal mates becomes a topological neighbour is equally likely in our algorithm.
Figure 1.
Schematic of a fish shoal on the discretized domain.
Interactions among shoal members at time t determine the desired heading for fish i in the ring. In particular, the influence of interaction with neighbours in 𝒩i(t) is modelled through the ideal heading ĥi as
 |
2.1 |
which reflects the propensity of a schooling fish to match its heading to the headings of its neighbours. We note that equation (2.1) is indeterminate when hi(t) = −∑j∈𝒩i hj(t). In this case, we let one's own heading dominate by setting ĥi(t + 1) = hi(t). Note that, if n ≥ N − 1, topological neighbours coincide with metric neighbours in an interaction region of Cp cells, as further discussed in §5; and equation (2.1) reduces to the alignment behaviour discussed for example in Vicsek et al. (1995). Opinion dynamics problems are often modelled using averaging rules similar to equation (2.1) (Deffuant et al. 2001; Kozma & Barrat 2008). In such problems, the set of neighbours is generally independent of the individuals' states. In contrast, the set of neighbours depends on the individual heading and position for the problem at hand. Analytical studies on the convergence of opinion dynamics protocols can be found for example in Bertekas & Tsitsiklis (1989), Hatano & Mesbahi (2005), Porfiri & Stilwell (2007) and Ren & Beard (2008).
To partially incorporate the complexity of live fish, we introduce a parameter co ∈ [0,1] that dictates the obedience of a fish to the heading model. The heading hi(t + 1) of fish i at time t + 1 is a discrete random variable which equals ĥ(t + 1)i with probability co and −ĥ(t + 1)i with probability 1 − co. This approach is also used in Kolpas et al. (2007).
Fish i's discrete motion is modelled as an instantaneous jump of one cell length. We define a parameter cv, such that 1 − cv is the probability that, at time t, fish i jumps a cell in the direction of its heading. This parameter is set constant throughout the shoal. For example, cv = 0 indicates fish i jumps one cell at every time step and cv = 1 means that fish i never moves out of its cell. This parameter can be potentially identified through experiments on mean fish speed.
The model for the cellular position of fish i on the circle of radius R has the form of a differential approximation, that is,
| 2.2 |
where V is the discrete random variable that equals 0 with probability cv and equals 1 with probability 1 − cv. It is necessary to take the position modulo CT to identify cells across the x-axis depicted in figure 1. The governing equations for our model are equations (2.1) and (2.2). In a broad sense, the fish in the ring can be assimilated to the colliding beads studied in Susca et al. (2007). In this way, the decision-making process can be regarded as the result of multiple collisions among the beads.
2.2. Coarse observables
In characterizing the consensus of the shoal on a common heading, we use a discretized version of the polarization adopted in Couzin et al. (2002)
 |
2.3 |
The tendency of a shoal to polarize corresponds to the alignment of bodies exhibited by schooling fish. This quantity is in [0, 1], where Pol = 1 means that all shoal members have a common heading. For N even, Pol = 0 means that N/2 fish have heading +1 and N/2 fish have heading −1. For N odd, the smallest attainable polarization value is Pol = 1/N, which occurs when (N + 1)/2 fish have heading ±1 and (N − 1)/2 fish have heading ∓1.
To examine the physical dispersion of the shoal at time t, we recruit the order parameter used to describe synchronization of phase oscillators in Kuramoto (1984). We define the cohesion
 |
2.4 |
where I is the imaginary unit. The cohesion of a shoal corresponds to the physical proximity of the fish. This quantity is inherently normalized, that is, Coh is in [0,1], where Coh = 1 describes the coincidence of the positions of all N fish and shoal members tend to be equally spaced around the ring as Coh approaches 0.
The concept of average nearest neighbour is used in Kolpas et al. (2007) to study collective behaviour along a line. For the problem under investigation, this quantity always approaches zero as the shoal's size increases owing to the finite number of cells on the ring and is thus not considered in our study.
2.3. Network features
We complement the physical description of the fish shoal in terms of the positions and headings of its members by studying the properties of the network of fish-to-fish interactions. We employ a graph theoretic perspective to formalize a social description of the fish shoal. A similar approach to building a graph based on interactions is presented in Jensen (2008) to analyse emerging network structures. We consider the fish indices 𝒱 = {1, … , N} to be a set of vertices. At time t, we define fish i interacting with fish j as fish i being a topological neighbour of fish j, that is i ∈ 𝒩j(t). This interaction is seen as information transferred from fish i to fish j and is denoted as the directed edge (i, j) in the edge set ℰ. Thus, the shoal at time t can be viewed as a directed unweighted graph 𝒢(t) = (𝒱, ℰ(t)) that is constructed based on pi(t), hi(t) and the random component in the formation of 𝒩i(t). Notice that the edge set ℰ varies in time, thus yielding a time-varying graph 𝒢. The network assembly allows for the presence of bidirectional communication between vertices. Such links can occur if fish occupy the same cell or if they are in different cells while pointing towards each other. Further details on the properties of graphs are presented in appendix A. Here, we concisely introduce the main parameters analysed for the graph representations of fish shoals.
We define a school to be a subgraph of 𝒢 that has a spanning tree, which corresponds to the physical requirement of a path of information from an individual fish to all other fish in the school. Consequently, a shoal is the disjoint union of schools and the minimum number of trees that span the graph is equal to the number of schools in the shoal, denoted 𝒮̂. An analogous measure of physical connectivity appears in Kolpas et al. (2007), where group fragmentation based on physical distance between shoal mates is defined. Here, the minimum number of trees required to span the network of interactions captures the connectedness of interactions over the shoal. We normalize this quantity in the range [0,1] by defining
| 2.5 |
Next, we place the individual fish in the context of the shoal by using two different ideas of centrality of a vertex in 𝒢, that is, degree centrality and betweenness centrality. Degree centrality quantifies how connected a given fish is to each other member of the shoal. The complete graph maximizes degree centrality, with each vertex having degree N − 1. Thus, the degree centrality of fish i is
| 2.6 |
We notice that the degree centrality is scaled in [0, 1] and that the out-degree of a vertex is used in accordance with our definition of the graph Laplacian in appendix A.
The betweenness centrality of a fish quantifies its importance in the overall information sharing of the shoal. Measures of betweenness centrality are used to study complex networks, such as social networks for football tournaments (Bell et al. 1999), networks of contacts for disease transmission (Girvan & Newman 2002; Keeling & Eames 2005) and scale-free large technological networks such as the Internet (Bollt & ben Avraham 2005). We define betweenness centrality for fish i as
 |
2.7 |
where σab is the number of shortest paths from vertex a to vertex b and σab(i) is the number of shortest paths from a to b which contain vertex i (e.g. Godsil & Royle 2002). Betweenness centrality is also normalized in [0, 1].
3. Experiment
As the experimental counterpart to the above illustrated modelling framework, in this section we study the collective response of groups of gregarious fish swimming in annular domains.
3.1. Experimental procedure
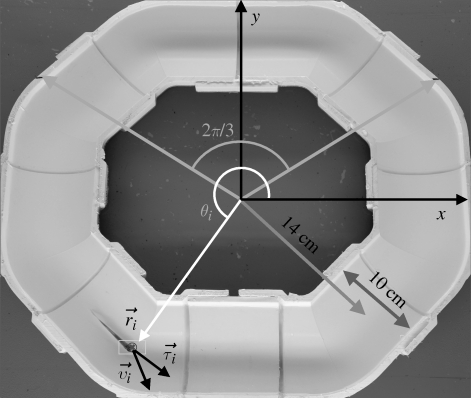
Experimental trials are conducted on members of a shoal of zebrafish (Danio rerio) housed in a large aquarium with dimensions 180 × 43 × 63 cm. The subjects experience 10 h of light condition and 14 h of dark condition daily and are fed twice daily. A sample of 15 fish from our shoal of 50 have mean body length of 2.2 cm from nose to peduncle, with standard deviation (s.d.) of 0.18 cm. We define the average body length (BL) as this mean value. The shoal is observed in an annular opaque PVC tank (figure 2). The ring has a mid-channel radius of R = 14 cm, a semi-circular cross section of 5 cm radius and a wall thickness of 7 mm. These dimensions are chosen corresponding to the average BL of the fish to encourage swimming along the middle of the channel, while not discouraging reversal of direction.
Figure 2.
Experimental set-up with ring dimensions. The instantaneous position  , velocity
  , angular position θi = arctan (yi/xi) and unit vector
  orthogonal to
  aligned with the fish speed are indicated.
The ring tank is placed in a shallow observation structure of dimensions 120 × 120 × 20 cm to account for possible evacuation of the ring. Shoals of fish with 4–16 members are observed in the ring for 1 min intervals and recorded using a Canon Vixia HG20 video camera and ambient fluorescent lighting of the order of 100 lux. For each shoal size, a representative 30 s schooling event is selected. The events are analysed using manual and automatic feature tracking in ProAnalyst, a motion analysis software (Xcitex Inc. 2006). Visual data largely require manual tracking since the frame rate of the trials allows for a fish to completely reverse direction in one time step. During such manoeuvres, large deformations in the fish body limit the effectiveness of the automatic tracking feature of ProAnalyst. A single fish can be seen in figure 2, with the widest part of its body tracked as it would be by ProAnalyst.
3.2. Parameter identification
Since zebrafish have acute vision, we estimate the perceptual limit from the maximum angle that gives a view unobstructed by the walls of the ring. The rays in figure 2 display an estimate of this angle which we approximate at 2π/3 rad. We take Cp = ⌊CT/3⌋, where ⌊•⌋ denotes the floor function. In discretizing the time variable, we take the characteristic time between successive time steps Δt to be equal to the acquisition period of the used video camera, that is, 33 ms. This corresponds to the time for a rapid heading change of a typical shoal member and allows for accurately discretizing in time the individual complex motion. In discretizing the annular domain, we select the cell size to be equal to 1 BL. As a consequence, the ring is divided into CT = 40 cells. The finite size of cells in the ring practically accommodates for interactions of individuals with other mates slightly behind them (e.g. Aoki 1982). Such interactions are possible owing to the experimental implementation of the one-dimensional ring model with a finite cross-section annulus.
Captured images are used to estimate the position and velocity of the fish on the Cartesian plane with origin at the centre of the ring. These quantities are further manipulated to extract the reduced order kinematics of the fish in the ring illustrated in §2. We refer to the nomenclature in figure 2, in which  identifies the position of fish i and
  is its velocity. The angular position of fish i is θi(t) = arctan(yi(t)/xi(t)) ∈ [0, 2π]. We discretize the position for fish i as pi(t) = ⌊CTθi(t)/(2π)⌋. We project the velocity onto the unit vector
  that is orthogonal to
  and we take the sign of this projection as the heading hi(t).
We first analyse the motion of a single fish. We count the number of time steps that a single fish remains in a given cell as a fraction of total time steps analysed to extract the velocity constant cv. Thus, 1 − cv represents the proportion of time steps when a fish jumps between cells. From a sample of eight single fish, we find a mean value of cv equal to 0.901 and standard deviation of 0.023, corresponding to a mean speed of 3 BL s−1. This implies that, for the selected space and time discretization, remaining in the same cell is generally preferred to jumping between cells.
The obedience constant co may be computed by counting the number of turns made by a single fish as a proportion of total time steps. However, isolating a single fish in the ring may elicit an immobilizing fear response, which means the heading remains constant. This confounds the experimental estimation of co, which is therefore taken as a varying parameter in our study. We identify the number of topological neighbours n by referring to the study of Tegeder & Krause (1995) in which a stickleback is shown to perceive a maximum of three to five shoal mates. We use the limit of n = 3 neighbours for the zebrafish, that are in the same taxonomic infraclass as sticklebacks (Pitcher & Parrish 1993). We note that the value of n is indirectly correlated to the selected time step Δt since the neighbour selection is a randomized process that takes place at each discrete time instant. Decreasing Δt would correspond to increasing the effective numerosity of the fish, as each fish would practically be able to process more information at each discrete instant.
3.3. Data analysis
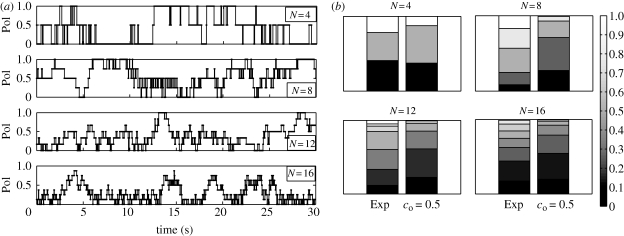
We present experimental results for shoals of 4, 8, 12 and 16 fish. Polarization data are reported in figure 3a. A further insight into the polarization data is possible by analysing the stacked normalized histograms of shoal polarization in figure 3b. We compare these data for four shoal sizes to the probability of each polarization if every heading configuration was equally likely. The probability distribution in this case can be explicitly computed by a counting argument. The condition of all headings being equally likely is equivalent to the implementation of the model in §2 with full disobedience, that is, co = 0.5. These terms are used interchangeably. For every shoal size, the stacked normalized histograms for the observed polarizations consistently differ from the equally likely case, by displaying preference of the live shoal for high polarization states.
Figure 3.
(a) Raw polarization data as discrete data points and (b) stacked normalized polarization histograms of experimental data and predictions with co = 0.5.
We quantitatively compare the stacked normalized histograms for each value of N using an error measure based on the vector one-norm (e.g. Horn & Johnson 1985); alternative measures of similarities between probability distributions may also be adapted (e.g. Banks et al. 2001). In particular, the error measure is defined as γ = 1/2∑i=1q |Ei − Oi|, where Ei is the expected frequency of each polarization value in the co = 0.5 histogram, Oi is the observed frequency of each polarization value for the experimental histogram and q is the number of values Pol can achieve. In our experiments, the number of shoal mates N is even and therefore q = N/2 + 1. Since ∑i=1q Ei = 1, ∑i=1q Oi = 1, Ei > 0 and Oi > 0 for all i, the error measure is normalized in [0, 1]. By direct computation, we find γ = 0.127 for N = 4, γ = 0.465 for N = 8, γ = 0.272 for N = 12 and γ = 0.174 for N = 16. The magnitude of these errors suggests that the equally likely scenario is not appropriate for describing experimental observations.
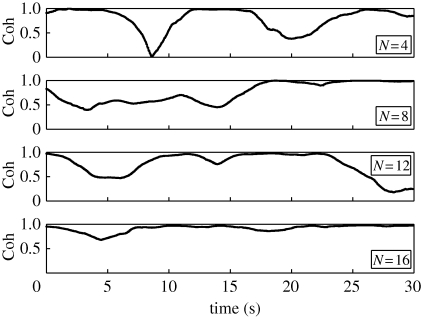
Cohesion data are presented in figure 4. We note that cohesion data appear smoother than polarization data because, while they are both discrete, cohesion can take on considerably more values in [0, 1] than polarization owing to the relatively large number of cells against the binary value of heading. Experiments show that fish in the shoal prefer states with high physical proximity. Statistical properties of the polarization and cohesion computed over the 30 s time window are given in table 1. We note that the mean value of the polarization is not monotonically varying with respect to the shoal size. In particular, it is maximized in the case of the eight fish shoal. In contrast, the standard deviation of the polarization seems to decrease as the shoal size increases. Cohesion data are generally high for every experiment and do not exhibit a well-defined trend with respect to the shoal size.
Figure 4.
Raw cohesion data.
Table 1.
Experimental data in the form of mean ±1 s.d.
| N | Pol | Coh |
|---|---|---|
| 4 | 0.405 ± 0.384 | 0.790 ± 0.237 |
| 8 | 0.567 ± 0.292 | 0.749 ± 0.209 |
| 12 | 0.371 ± 0.249 | 0.754 ± 0.242 |
| 16 | 0.280 ± 0.228 | 0.916 ± 0.071 |
4. Parameter study
4.1. Simulation procedure
We investigate the role of two parameters of interest in our model, shoal size N and obedience constant co. Table 2 shows the parameter values used in the computer simulations that are consistent with those in §3. The obedience parameter varies in a broad spectrum to span the full range from deterministic to purely random decision-making processes. Initial conditions for shoal position and heading are randomly generated and a single simulation is run for  time steps for each pair of parameters. Owing to the random nature of the neighbours' selection and decision-making, the process is ergodic for co < 1. Thus, equivalent quantitative results can be gathered by running shorter replicate simulations with random initial conditions. The mean and standard deviation of the scalar-valued quantities Coh, Pol and 𝒮 are computed by averaging over the entire simulation. The computation of the mean and standard deviation of the degree and betweenness centrality, referred to as bc and dc, requires a second averaging over the shoal.
Table 2.
Parameter values used in the simulation study.
| parameter | abbreviation | value |
|---|---|---|
| school size | N | 4–128 |
| maximum time steps | tf | 25 000 |
| total number of cells | CT | 40 |
| perceivable cells | Cp | 13 |
| topological neighbours | n | 3 |
| velocity constant | cv | 0.901 |
| obedience constant | co | 0.5–1 |
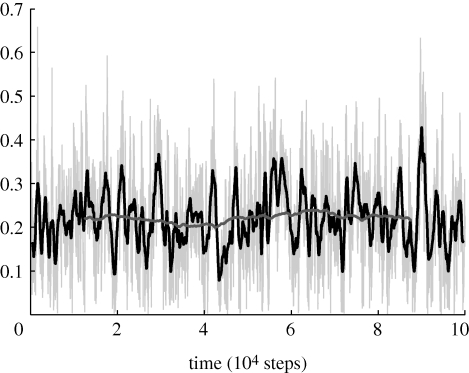
We select tf to guarantee that the statistics of the simulation represent the stationary distribution of the underlying ergodic process. In particular, we consider a test simulation of 105 time steps and compute moving averages of the mean and variance of Coh, Pol, 𝒮, bc and dc by using different time windows within the larger simulation, as shown in figure 5 for cohesion. The quantity tf is chosen to obtain variations of the moving average within 10 per cent of the mean computed over 105 steps and is found to be 25 000. As an illustration, figure 5 shows Coh with moving averages of length 900 and 25 000 displayed at the midpoint of each window. The stationarity of the process is evidenced by the approximate constancy of the 25 000 step moving average.
Figure 5.
Cohesion for a 105 time step simulation with N = 16 and co = 0.95. Moving averages with 900 and 25 000 time-step windows are shown. Light grey thin line, Coh; black line, 900 step moving average; dark grey line, 25 000 step moving average.
4.2. Coarse observables
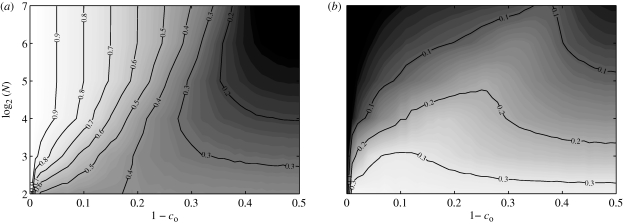
Owing to the direct influence of the obedience parameter on the heading dynamics, we find that the mean polarization has a strong dependence on co. A common heading is reached and maintained for all shoal sizes when 1 − co = 0. As 1 − co increases, the mean polarization decreases with a rate dependent on N, as illustrated in figure 6a. For a fixed co < 1, the mean polarization exhibits a distinct non-monotonic trend with increasing N. In addition, for a given shoal size, standard deviation is minimized when the fish are fully obedient (figure 6b).
Figure 6.
(a) Mean and (b) standard deviation of the polarization as functions of shoal size and obedience.
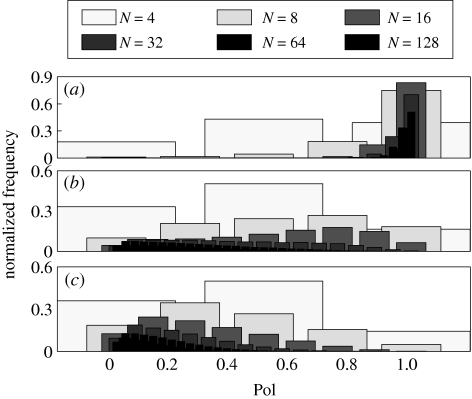
The same trends are ascertained from figure 7, which simultaneously shows normalized polarization histograms for all shoals at three representative values of co. For co = 0.80 and co = 0.99, the most probable values of Pol are independent of the shoal size. In particular, for co = 0.80, all shoals favour low polarizations and for co = 0.99, all shoals favour high polarizations. In the case co = 0.90, the most likely polarization varies with N and the histogram has a larger spread. The most likely polarization is maximized for N = 8 or N = 16 and its maximum is Pol = 0.75. In addition, the distribution of polarization for smaller shoals has larger spread by construction, since the number of possible polarization values is proportional to N.
Figure 7.
Normalized polarization histograms for all shoal sizes, for (a) co = 0.99, (b) co = 0.90 and (c) co = 0.80.
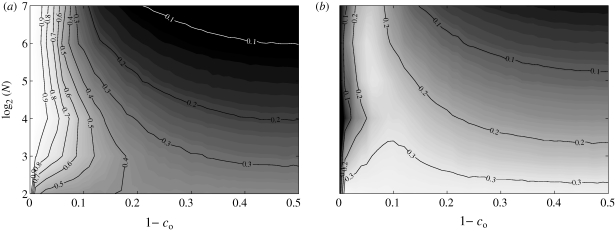
The dependence of mean cohesion on co shows two distinct trends (figure 8a). For large values of 1−co, the mean cohesion increases as N decreases. For decreasing values of 1−co, the mean cohesion increases with N, with a peak at approximately 1−co=0.05. The standard deviation in figure 8b shows a similar trend.
Figure 8.
(a) Mean and (b) standard deviation of the cohesion as functions of shoal size and obedience.
4.3. Network features
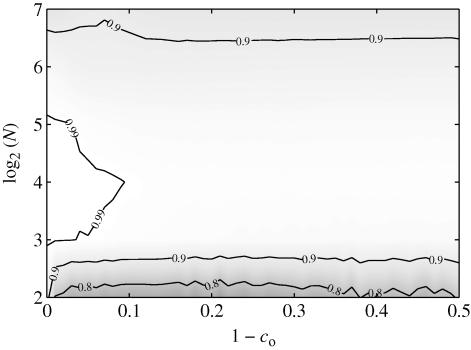
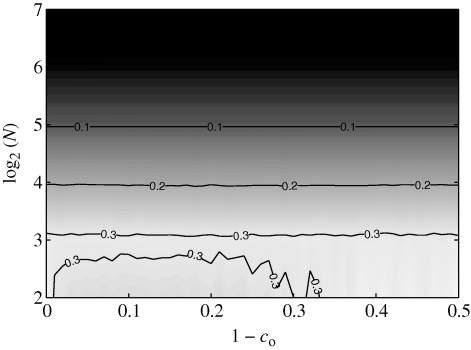
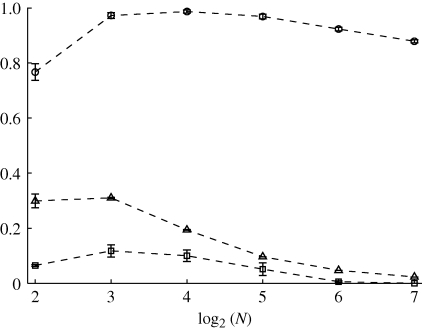
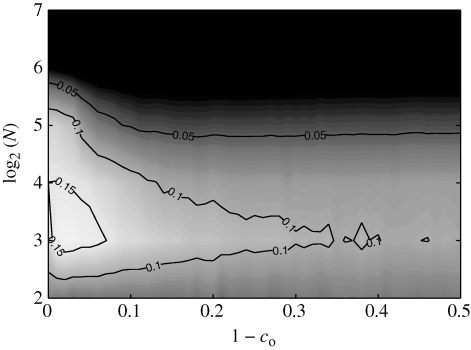
Network features are presented in figures 9–11. We find that the network features are approximately independent of the obedience constant co. Standard deviations approach zero as the shoal size increases and are thus not individually reported as contour plots for brevity. The average values over the studied obedience range of degree centrality, betweenness centrality and number of schools varying as functions of N are presented in figure 12 for comparison. Note that the quantities in figure 12 have no physical meaning outside of the interval [0, 1].
Figure 9.
Mean of the normalized number of schools as a function of shoal size and obedience.
Figure 11.
Mean of the degree centrality as a function of shoal size and obedience.
Figure 12.
Mean number of schools (circles), degree centrality (triangles) and betweenness centrality (squares) as a function of shoal size computed by averaging the full dataset with respect to obedience. Error bars refer to 1 s.d.
The mean value of 𝒮 is maximized when N is approximately equal to eight (figures 9 and 12). This may be attributed to the interplay between the increasing density of fish in the ring and the constrained numerosity. For small shoals, increasing group size favours the formation of paths between physically far fish. As the shoal size is further increased, the cells in the ring become densely populated and each fish is only able to establish with shoal mates in its own cell. This in turn results in the formation of multiple schools of limited physical extension. As expected, the betweenness centrality shows a similar trend. Indeed, for small shoals, each fish is important in the overall information-sharing process. As disconnected components arise in the shoal owing to its increasing size, the information flow is inhibited and, therefore, the relevance of a single fish decreases.
Figure 10.
Mean of the betweenness centrality as a function of shoal size and obedience.
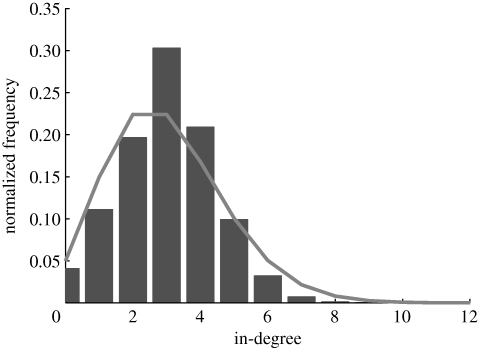
Owing to the fixed numerosity in the model, as the shoal size increases, the average degree centrality approaches zero. In particular, every fish is connected to n neighbours as the shoal size increases. Thus, the mean degree centrality scales as n/N and the standard deviation goes to zero. Further properties of the underlying network can be gathered by looking at the in-degree distribution. The mean value of the in-degree equals the mean of the out-degree, while the standard deviations are different. Figure 13 shows the histogram of the in-degree distribution for a shoal of 128 members. The histogram shows that the in-degree distribution is well approximated by a Poisson distribution. Therefore, the directed network can be considered as a random out-regular network (Jaworski & Smit 1987), that is, an Erdös–Rényi directed graph with a constant out-degree over all vertices.
Figure 13.
Normalized histogram of in-degrees for N = 128 and co = 0.95, with identified Poisson distribution. Grey bars, in-degree histogram; grey line, Poisson distribution.
5. Discussion
The non-monotonic behaviour of the polarization as a function of the shoal size is observed in both the experimental and numerical study (table 1 and figure 6). Numerical results show that, for 1 − co in the range [0.1, 0.2], the polarization is maximized in the vicinity of N = 8 and its maximum is in the range [0.35, 0.55]. In addition, as N is varied from 8, the polarization is reduced to values as small as 0.3. The standard deviation shows a rather monotonic decrease from approximately 0.35 to 0.2 as N varies from 4 to 16. These values are in good agreement with the experimental results.
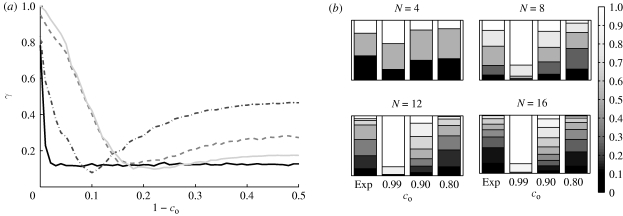
A further assessment of the model predictive capabilities can be garnered by comparing the entire histograms of polarization from experimental data and numerical results. In figure 14a, we plot the error measure γ used in §3.3 as a function of 1 − co. The error between experiments and simulations has a clear minimum for all shoals larger than four and it is minimized by co = 0.89 for N = 8, co = 0.82 for N = 12 and co = 0.77 for N = 16. Quantitative comparison between experiments and predictions for N = 4 is limited by the small numbers of admissible polarization states. Consistent with the discussion above on the mean and standard deviations of the polarization, the minimizing values of 1 − co are approximately in the range [0.1, 0.2]. As a demonstration, the stacked normalized polarization histograms for experiments and representative values of co are presented in figure 14b. Visual inspection confirms a correlation between the histograms with minimized error measure and experimental data. The minimized error is smaller than the error obtained by comparing experimental data to the equally probable scenario discussed in §3.3, which supports the predictive potential of the proposed model upon proper selection of its parameters.
Figure 14.
(a) Error measure of experimental and simulation normalized polarization histograms and (b) stacked normalized polarization histograms from experimental data and simulations for co = 0.80, co = 0.90, and co = 0.99 at each shoal size. Solid black line, N = 4; dotted dashed line, N = 8; dashed line, N = 12; solid grey line, N = 16.
However, definitive statements about the predictive capacity of the model cannot be drawn at this point owing to the short duration of the experiments when compared with the long time horizon used in the simulation to guarantee the process ergodicity and the lack of data for large shoal sizes. In practice, longer experiments are difficult to conduct owing to the fish active learning of the environment. In addition, considering large shoal sizes without modifying the ring dimensions would violate the modelling assumption of unlimited cell occupancy.
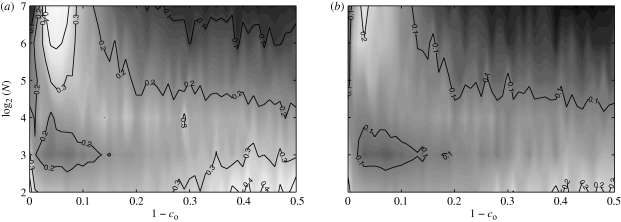
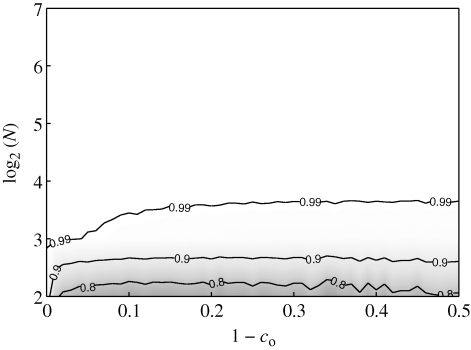
As a validation of the topological regime, in figure 15, we report polarization data computed by discarding numerosity, that is, by setting n = N − 1. In this case, each fish interacts with every shoal mate in its region of perception, and the model can be assimilated to a traditional metric model (Vicsek et al. 1995). Within this framework, polarization increases monotonically as a function of the shoal size irrespective of the value of co, hinting that numerosity is an important mechanism for describing schooling of gregarious fish. In contrast with the topological model (figure 9), the mean value of the normalized number of schools reported in figure 16 monotonically increases with N and rapidly reaches one. Therefore, allowing each fish to potentially interact with every mate in its physical proximity favours the information exchange in the group when compared with the topological model in which fragmentation arises owing to numerosity. The emergence of highly connected networks is also visible from the degree centrality. As N increases, the average degree centrality rapidly approaches a non-zero limit value, which is related to the fish perceptual limit. In addition, the in- and out-degree distributions share the same Poisson distribution, indicating that the network is well described by a random directed graph.
Figure 15.
(a) Mean and (b) standard deviation of the polarization as functions of shoal size and obedience using n = N − 1 topological neighbours.
Figure 16.
Contour plots of mean normalized number of schools using n = N − 1 topological neighbours.
Despite the good agreement between modelling predictions and experimental results on polarization, experimental data on cohesion are considerably larger than numerical results. This can be directly attributed to the limited time duration of the selected events that may drastically bias the computation of the statistical moments. For example, figure 5 shows the cohesion data that would be gathered by averaging the computer results with time windows comparable with those used in the experiments. In other words, the highly cohesive events observed in the experiments may correspond to well-localized travelling schools in the shoal as illustrated in figure 17. Such cohesive configurations are also found in two- and three-dimensional metric models in Chate et al. (2008) in the form of bands and sheets, respectively. These metric models share the lack of an explicit rule of attraction with the proposed one.
Figure 17.
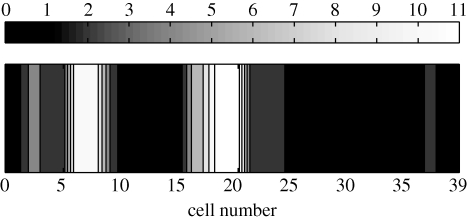
Density of shoal with N = 128 and co = 0.95 simulated with proposed topological model at a single time-step in the ring.
Future works include incorporating shoal responses to stimuli such as ambient light conditions and flow disturbances as well as further exploring the mathematical features of the proposed model, including its transient behaviour. The tools developed in this study are currently being used to quantitatively ascertain the potential leadership role of biomimetic robotic vehicles in fish shoals (Aureli et al. in press).
Acknowledgements
This work was supported by the National Science Foundation under CAREER grant no. CMMI-0745753 and GK-12 Fellows grant no. DGE-0741714. The authors would like to gratefully acknowledge Mr Matteo Aureli, Ms Francesca Fiorilli, Dr Sean D. Peterson and Dr Davide Spinello for useful discussions and careful review of the manuscript. The authors would also like to thank the anonymous reviewers for their careful reading of the manuscript and for giving useful suggestions that have helped improve the work and its presentation.
Appendix A. Graph Theory
We construct a simple directed graph 𝒢(t) = (𝒱, ℰ(t)) with vertex set 𝒱 = {1, … , N} and directed edge set ℰ = {(i, j): ∃ an edge from i to j}. We say that the edge (i, j) originates at vertex i and terminates at vertex j. These edges can be condensed in the adjacency matrix A whose ij-th entry is equal to 1 if (i, j) ∈ ℰ and equal to 0 if (i, j) ∉ ℰ. Since 𝒢 has no self-loops, that is, edges that originate and terminate at the same vertex, the diagonal of the adjacency matrix A has all zero entries. For i ∈ 𝒱, we define the out-degree degout(i) as the number of edges originating at i and the in-degree degin(i) as the number of edges terminating at i. At time t, the degree matrix of 𝒢 is the diagonal matrix (D)ii = degout(i). The graph Laplacian is defined as L = D − A, and similarly to D and A, varies with time. By construction, L has zero row sum, and consequently has zero as an eigenvalue (see Fiedler 1973). Also, all the eigenvalues of L lie in the closed right half-plane (see Ren & Beard 2005). In addition, a tree is a weakly connected acyclic graph with a root and a spanning tree of 𝒢 is a tree with vertex set equal to 𝒱 and edge set ℰ′⊆ℰ.
A path of length k from vertex a to vertex b is a sequence of k + 1 distinct vertices starting with a and ending with b, such that consecutive vertices are adjacent with respect to the edges of the graph. A shortest path from a to b minimizes k. A common definition of betweenness centrality of vertex i is  (i) = ∑a≠b≠i∈V
σab(i)/σab, which sums the fraction of shortest paths between vertices on which vertex i lies. For all directed graphs on N vertices, the vertex with maximum betweenness centrality is the centre of a star graph that is defined as N − 1 vertices with edges to and from a centre vertex. The betweenness centrality of the centre is (N − 1)(N − 2) (e.g. White & Borgatti 1994).
We use L̃ to denote the Laplacian of the reversal of 𝒢, that is defined as 𝒢̃ = (𝒱, ℰ̃) where ℰ̃ = {(i,j):(j,i) ∈ ℰ}. From corollaries 2.24 and 2.25 in Wu (2007), we know that the zero eigenvalue of L̃ has algebraic multiplicity equal to one if and only if 𝒢 has a spanning tree, which occurs if and only if L̃ is irreducible. In addition, from theorem 2.23 of Wu (2007) we know that if L̃ is reducible, the algebraic multiplicity of its zero eigenvalue is equal to the minimum number of trees that together span 𝒢. Therefore, in general, the algebraic multiplicity of the zero eigenvalue of L̃ equals the minimum number of trees whose union span 𝒢. Alternative identification procedures for trees can also be adopted (e.g. Wu 2007).
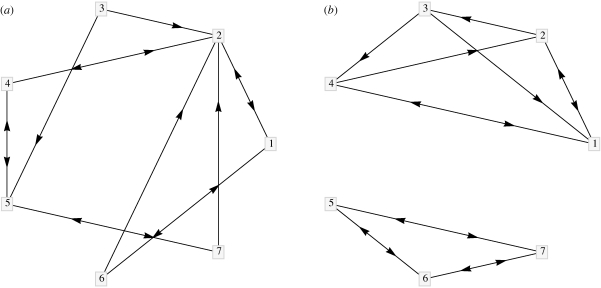
For example, the graph in figure 18a is spanned by a single tree, while the graph in figure 18b is spanned by a minimum of two trees. This result is equivalently evidenced by the Laplacian of the reversal of the graph in figure 18a
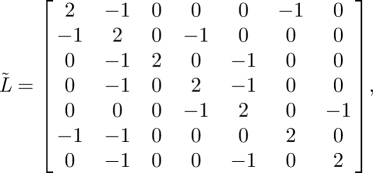 |
A 1 |
which has a zero eigenvalue with multiplicity one. Similarly, it can be shown that the Laplacian of the reversal of the graph in figure 18b,
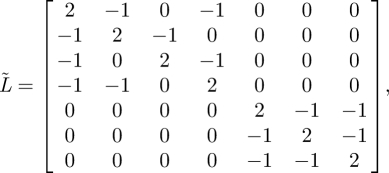 |
A 2 |
has a zero eigenvalue with multiplicity two.
Figure 18.
Two realizations of directed graphs on seven vertices with constant out-degree equal to two. (a) The graph is spanned by a single tree. (b) The graph is spanned by a minimum of two trees.
References
- Aoki I. 1982. A simulation study on the schooling mechanism in fish. Bull. Jpn. Soc. Sci. Fish. 48, 1081–1088. [Google Scholar]
- Aoki I. 1984. Internal dynamics of fish schools in relation to inter-fish distance. Bull. Jpn. Soc. Sci. Fish. 50, 751–758. [Google Scholar]
- Aureli M., Kopman V., Porfiri M. In press Free-locomotion of underwater vehicles actuated by ionic polymer metal composites. IEEE/ASME Trans. Mech. ( 10.1109/TMECH.2009.2030887) [DOI] [Google Scholar]
- Ballerini M., Cabibbo N., Candelier R., Cavagna A., Cisbani E., Giardina I., Lecomte V., Orlandi A., Parisi G. 2008. Interaction ruling animal collective behavior depends on topological rather than metric distance: evidence from a field study. Proc. Natl Acad. Sci. USA 105, 1232–1237. ( 10.1073/pnas.0711437105) [DOI] [PMC free article] [PubMed] [Google Scholar]
- Banks J., Carson J. S., Nelson B. L., Nicol D. M. 2001. Discrete-event system simulation. Englewood Cliffs, NJ: Prentice Hall. [Google Scholar]
- Bell D. C., Atkinson J. S., Carlson J. W. 1999. Centrality measures for disease transmission networks. Soc. Netw. 21, 1–21. ( 10.1016/S0378-8733(98)00010-0) [DOI] [Google Scholar]
- Bertekas D., Tsitsiklis J. 1989. Parallel and distributed computation: numerical methods. Englewood Cliffs, NJ: Prentice Hall. [Google Scholar]
- Bollobas B. 1998. Modern graph theory. Berlin, Germany: Springer. [Google Scholar]
- Bollt E. M., ben Avraham D. 2005. What is special about diffusion of scale-free nets? New J. Phys. 7, 26–47. [Google Scholar]
- Chate H., Ginelli F., Gregoire G., Peruani F., Raynaud F. 2008. Modeling collective motion: variations on the Vicsek model. Eur. Phys. J. B 64, 451–456. ( 10.1140/epjb/e2008-00275-9) [DOI] [Google Scholar]
- Chuang Y.-L., D'Orsogna M. R., Marthaler D., Bertozzi A. L., Chayes L. S. 2007. State transitions and the continuum limit for a 2D interacting, self-propelled particle system. Physica D 232, 33–47. ( 10.1016/j.physd.2007.05.007) [DOI] [Google Scholar]
- Couzin I., Krause J., James R., Ruxton G. D., Franks N. R. 2002. Collective memory and spatial sorting in animal groups. J. Theor. Biol. 218, 1–11. ( 10.1006/jtbi.2002.3065) [DOI] [PubMed] [Google Scholar]
- Deffuant G., Neau D., Amblard F., Weisbuch G. 2001. Mixing beliefs among interacting agents. Adv. Complex Syst. 3, 87–98. ( 10.1142/S0219525900000078) [DOI] [Google Scholar]
- D'Orsogna M. R., Chuang Y. L., Bertozzi A. L., Chayes L. S. 2006. Self-propelled particles with soft-core interactions: patterns, stability, and collapse. Phys. Rev. Lett. 96, 104302 ( 10.1103/PhysRevLett.96.104302) [DOI] [PubMed] [Google Scholar]
- Erdmann U., Ebeling W., Mikhailov A. S. 2005. Noise-induced transition from translational to rotational motion of swarms. Phys. Rev. E 71, 051904 ( 10.1103/PhysRevE.71.051904) [DOI] [PubMed] [Google Scholar]
- Fiedler M. 1973. Algebraic connectivity of graphs. Czech. Math. J. 23, 298–305. [Google Scholar]
- Girvan M., Newman M. E. J. 2002. Community structure in social and biological networks. Proc. Natl Acad. Sci. USA 99, 7821–7826. ( 10.1073/pnas.122653799) [DOI] [PMC free article] [PubMed] [Google Scholar]
- Godsil C., Royle G. 2004. Algebraic graph theory. Berlin, Germany: Springer. [Google Scholar]
- Gonzalez-Miranda J. M. 2004. Synchronization and control of chaos. London, UK: Imperial College Press. [Google Scholar]
- Hatano Y., Mesbahi M. 2005. Agreement over random networks. IEEE Trans. Autom. Control 50, 1867–1873. ( 10.1109/TAC.2005.858670) [DOI] [Google Scholar]
- Horn R. A., Johnson C. R. 1985. Matrix analysis. Cambridge, UK: Cambridge University Press. [Google Scholar]
- Jaworski J., Smit I. H. 1987. On a random digraph. Ann. Discret. Math. 33, 111–127. [Google Scholar]
- Jensen H. J. 2008. Emergence of network structure in models of collective evolution and evolutionary dynamics. Proc. R. Soc. A 464, 2207–2217. ( 10.1098/rspa.2008.0032) [DOI] [Google Scholar]
- Keeling M., Eames K. T. D. 2005. Networks and epidemic models. J. R. Soc. Interface 2, 295–307. ( 10.1098/rsif.2005.0051) [DOI] [PMC free article] [PubMed] [Google Scholar]
- Kolpas A., Moehlis J., Kevrekidis I. G. 2007. Coarse-grained analysis of stochasticity-induced switching between collective motion states. Proc. Natl Acad. Sci. USA 104, 5931–5935. ( 10.1073/pnas.0608270104) [DOI] [PMC free article] [PubMed] [Google Scholar]
- Kolpas A., Moehlis J., Frewen T. A., Kevrekidis I. G. 2008. Coarse analysis of collective motion with different communication mechanisms. Math. Biosci. 214, 49–57. ( 10.1016/j.mbs.2008.06.003) [DOI] [PubMed] [Google Scholar]
- Kozma B., Barrat A. 2008. Consensus formation on adaptive networks. Phys. Rev. E 77, 016102 ( 10.1103/PhysRevE.77.016102) [DOI] [PubMed] [Google Scholar]
- Krause J., Godin J.-G. J., Brown D. 1996. Size-assortiveness in multi-species fish shoals. J. Fish Biol. 49, 221–225. ( 10.1111/j.1095-8649.1996.tb00018.x) [DOI] [Google Scholar]
- Krause J., Ward A. J., Jackson A. L., Ruxton G. D., James R., Currie S. 2005. The influence of differential swimming speeds on composition of multi-species fish shoals. J. Fish Biol. 67, 866–872. ( 10.1111/j.0022-1112.2005.00768.x) [DOI] [Google Scholar]
- Kuramoto Y. 1984. Chemical oscillations, waves, and turbulence. Berlin, Germany: Springer. [Google Scholar]
- Lachlan R. F., Crooks L., Laland K. N. 1998. Who follows whom? Shoaling preferences and social learning of foraging information in guppies. Anim. Behav. 56, 181–190. ( 10.1006/anbe.1998.0760) [DOI] [PubMed] [Google Scholar]
- Leblond C., Reebs S. G. 2006. Individual leadership and boldness in shoals of golden shiners. Behaviour 143, 1263–1280. ( 10.1163/156853906778691603) [DOI] [Google Scholar]
- Li W. 2008. Stability analysis of swarms with general topology. IEEE Trans. Syst. Man Cybern. Part B Cybern. 38, 1084–1097. ( 10.1109/TSMCB.2008.923528) [DOI] [PubMed] [Google Scholar]
- Niwa H.-S. 1994. Self-organizing dynamic model of fish schooling. J. Theor. Biol. 171, 123–136. ( 10.1006/jtbi.1994.1218) [DOI] [Google Scholar]
- Niwa H.-S. 1996. Newtonian dynamical approach to fish schooling. J. Theor. Biol. 181, 47–63. ( 10.1006/jtbi.1996.0114) [DOI] [Google Scholar]
- Olfati-Saber R. 2006. Flocking for multi-agent dynamical systems: algorithms and theory. IEEE Trans. Autom. Control 51, 401–420. ( 10.1109/TAC.2005.864190) [DOI] [Google Scholar]
- Parrish J. K., Viscido S. V., Grunbaum D. 2002. Self-organized fish schools: an examination of emergent properties. Biol. Bull. 202, 296–305. ( 10.2307/1543482) [DOI] [PubMed] [Google Scholar]
- Partridge B. L. 1980. The effect of school size on the structure and dynamics of minnow schools. Anim. Behav. 28, 68–77. ( 10.1016/S0003-3472(80)80009-1) [DOI] [Google Scholar]
- Partridge B. L. 1981. Internal dynamics and the interrelations of fish in schools. J. Comp. Physiol. 144, 313–325. ( 10.1007/BF00612563) [DOI] [Google Scholar]
- Partridge B. L. 1982. The structure and function of fish schools. Sci. Am. 246, 114–123. ( 10.1038/scientificamerican0682-114) [DOI] [PubMed] [Google Scholar]
- Partridge B. L., Pitcher T. J. 1980. The sensory basis of fish schools: relative roles of lateral line and vision. J. Comp. Physiol. 135, 315–325. ( 10.1007/BF00657647) [DOI] [Google Scholar]
- Pitcher T. J., Parrish J. K. 1993. Function of shoaling behaviour in teleosts. In Behaviour of teleost fishes (ed. Pitcher T. J.), pp. 363–440. London, UK: Chapman and Hall. [Google Scholar]
- Porfiri M., Stilwell D. J. 2007. Consensus seeking over random weighted directed graphs. IEEE Trans. Autom. Control 52, 1767–1773. ( 10.1109/TAC.2007.904603) [DOI] [Google Scholar]
- Reebs S. G. 2000. Can a minority of informed leaders determine the foraging movements of a fish shoal? Anim. Behav. 59, 403–409. ( 10.1006/anbe.1999.1314) [DOI] [PubMed] [Google Scholar]
- Reebs S. G. 2001. Influence of body size on leadership in shoals of golden shiners, Notemigonus crysoleucas. Behaviour 138, 797–809. ( 10.1163/156853901753172656) [DOI] [Google Scholar]
- Ren W., Beard R. W. 2005. Consensus seeking in multiagent systems under dynamically changing interaction topologies. IEEE Trans. Autom. Control 50, 655–661. ( 10.1109/TAC.2005.846556) [DOI] [Google Scholar]
- Ren W., Beard R. W. 2008. Distributed consensus in multi-vehicle cooperative control. Berlin, Germany: Springer. [Google Scholar]
- Sumpter D. J. T. 2006. The principles of collective animal behaviour. Phil. Trans. R. Soc. B 361, 5–22. ( 10.1098/rstb.2005.1733) [DOI] [PMC free article] [PubMed] [Google Scholar]
- Sumpter D. J. T., Krause J., James R., Couzin I. D., Ward A. J. W. 2008. Consensus decision making by fish. Curr. Biol. 18, 1773–1777. ( 10.1016/j.cub.2008.09.064) [DOI] [PubMed] [Google Scholar]
- Susca S., Bullo F., Martinez S. 2007. Synchronization of beads on a ring. In Proc. of the IEEE Conf. on Decision and Control, New Orleans, LA, pp. 4854–4850. [Google Scholar]
- Tegeder R. W., Krause J. 1995. Density dependence and numerosity in fright simulated aggregation behaviour of shoaling fish. Phil. Trans. R. Soc. Lond. B 350, 381–390. ( 10.1098/rstb.1995.0172) [DOI] [Google Scholar]
- Topaz C. M., Bertozzi A. L., Lewis M. A. 2006. A nonlocal continuum model for biological aggregation. Bull. Math. Biol. 68, 1601–1623. ( 10.1007/s11538-006-9088-6) [DOI] [PubMed] [Google Scholar]
- Torisawa S., Takagi T., Fukuda H., Ishibashi Y., Sawada Y., Okada T., Miyashita S., Suzuki K., Yamane T. 2007. Schooling behaviour and retinomotor response of juvenile pacific bluefin tuna Thunnus orientalis under different light intensities. J. Fish Biol. 71, 411–420. ( 10.1111/j.1095-8649.2007.01498.x) [DOI] [Google Scholar]
- Vicsek T., Czirok A., Ben-Jacob E., Cohen I., Shochet O. 1995. Novel type of phase transition in a system of self-driven particles. Phys. Rev. Lett. 75, 1226–1229. ( 10.1103/PhysRevLett.75.1226) [DOI] [PubMed] [Google Scholar]
- Viscido S. V., Parrish J. K., Grunbaum D. 2004. Individual behavior and emergent properties of fish schools: a comparison of observation and theory. Mar. Ecol. Prog. Ser. 273, 239–249. ( 10.3354/meps273239) [DOI] [Google Scholar]
- Viscido S. V., Parrish J. K., Grunbaum D. 2007. Factors influencing the structure and maintenance of fish schools. Ecol. Model. 206, 153–165. ( 10.1016/j.ecolmodel.2007.03.042) [DOI] [Google Scholar]
- Weihs D. 1973. Hydromechanics of fish schooling. Nature 241, 290–291. ( 10.1038/241290a0) [DOI] [Google Scholar]
- White D. R., Borgatti S. P. 1994. Betweenness centrality measures for directed graphs. Soc. Netw. 16, 335–346. ( 10.1016/0378-8733(94)90015-9) [DOI] [Google Scholar]
- Wu C.-W. 2007. Synchronization in complex networks of nonlinear dynamical systems. Singapore: World Scientific. [Google Scholar]
- Xcitex, Inc. 2006. ProAnalyst reference guide. See http://www.xcitex.com. [Google Scholar]
- Yates C. A., Erban R., Escudero C., Couzin I. D., Buhl J., Kevrekidis I. G., Maini P. K., Sumpter D. J. T. 2009. Inherent noise can facilitate coherence in collective swarm motion. Proc. Natl Acad. Sci. USA 106, 5464–5469. ( 10.1073/pnas.0811195106) [DOI] [PMC free article] [PubMed] [Google Scholar]
- Zheng M., Kashimori Y., Hoshino O., Fujita K., Kambara T. 2005. Behavior pattern (innate action) of individuals in fish schools generating efficient collective evasion from predation. J. Theor. Biol. 235, 153–167. ( 10.1016/j.jtbi.2004.12.025) [DOI] [PubMed] [Google Scholar]


