

Abstract
Background and purpose:
5-aminosalicylate (5-ASA) raises levels of 6-thioguanine nucleotides (6-TGN), the active metabolites of thiopurines such as azathioprine (AZA). Changes in levels of each individual TGN – 6-thioguanosine mono-, di- and triphosphate (6-TGMP, 6-TGDP, 6-TGTP) – and of 6-methylmercaptopurine ribonucleotides (6-MMPR) after 5-ASA are not known.
Experimental approach:
Effects of increasing 5-ASA doses on AZA metabolites were investigated prospectively in 22 patients with inflammatory bowel disease in 4-week study periods. Patients started with 2 g 5-ASA daily, and then were increased to 4 g daily and followed by a washout period. Thiopurine doses remained unchanged throughout the entire study. Levels of 6-TGMP, 6-TGDP, 6-TGTP and 6-MMPR as well as of 5-ASA and N-acetyl-5-aminosalicylic acid (N-Ac-5-ASA) were determined each study period.
Key results:
Median baseline levels in 17 patients of 6-TGDP, 6-TGTP and 6-MMPR were 52, 319 and 1676 pmol per 8 × 10⁸ red blood cells respectively. After co-administration of 2 g 5-ASA daily, median 6-TGDP and 6-TGTP levels increased but median 6-MMPR levels were unchanged. Increasing 5-ASA to 4 g daily did not affect median 6-TGDP and 6-TGTP levels, but median 6-MMPR levels decreased. After discontinuation of 5-ASA, both 6-TGDP and 6-TGTP levels decreased and median 6-MMPR levels increased. The 6-TGTP/(6-TGDP+6-TGTP)-ratio did not change during the study, but 6-MMPR/6-TGN ratios decreased.
Conclusions and implications:
Individual 6-TGN metabolites increased after addition of 5-ASA, but 6-MMPR-levels and the 6-MMPR/6-TGN ratios decreased. Further studies are needed to decide whether this pharmacokinetic interaction would result in improvement of efficacy and/or increased risk of toxicity of AZA.
Keywords: azathioprine, 6-mercaptopurine, 5-aminosalicylates, mesalazine, inflammatory bowel disease, 6-thioguanine nucleotides, 6-methyl-mercaptopurine ribonucleotides, 6-thioguanosine triphosphate, drug interaction, clinical pharmacology
Introduction
Azathioprine (AZA) and 6-mercaptopurine (6-MP) are immunosuppressive drugs used for treatment of ulcerative colitis (UC), Crohn's disease (CD) and indeterminate colitis (IC) (De Boer et al., 2007a). Their metabolism is complex (Figure 1) and involves in part polymorphically expressed drug metabolizing enzymes such as thiopurine methyltransferase (TPMT) and inosine triphosphate pyrophosphatase (ITPase). The metabolic pathway ultimately results in formation of 6-thioguanine nucleotides (6-TGN) and methylated compounds (e.g. 6-methylmercaptopurine ribonucleotides, 6-MMPR) (Teml et al., 2007). Pharmacological activity of thiopurines in inflammatory bowel disease (IBD) is attributed to the metabolite 6-thioguanosine-triphosphate (6-TGTP), which is the final product of successive intracellular phosphorylations of 6-thioguanosine mono- and 6-thioguanosine diphosphate (6-TGMP; 6-TGDP). Tiede et al. (2003) revealed that binding of 6-TGTP to the GTPase Rac1 resulted in a stimulation of the mitochondrial pathway of apoptosis in CD3-CD28 co-stimulated T cells. In detail, 6-TGTP primarily blocks the guanosine exchange factor Vav1, leading to accumulation of inactive 6-TGDP-loaded Rac1 and subsequent suppression of CD-28 lamellipodia formation and interferon (IFN)-γ production (Poppe et al., 2006).
Figure 1.
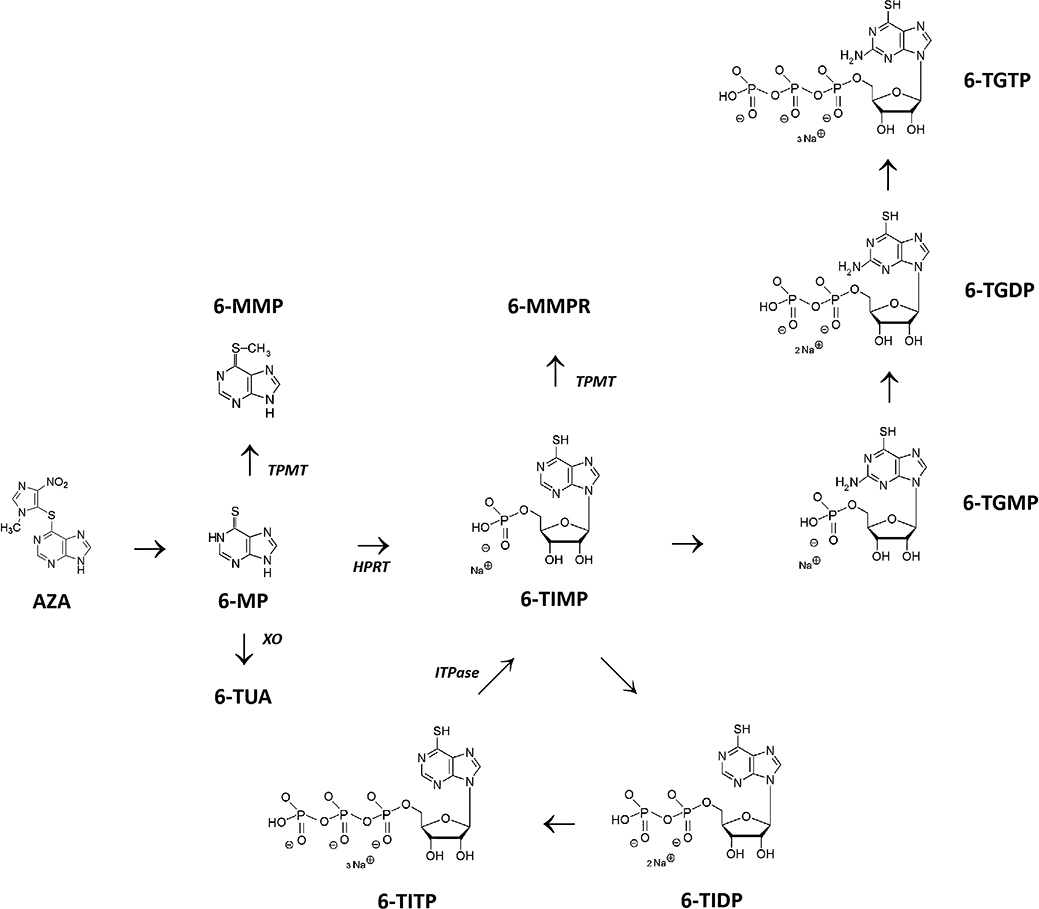
Thiopurine metabolism (simplified). Azathioprine (AZA) is non-enzymatically degraded to 6-mercaptopurine (6-MP). Xanthine oxidase (XO) inactivates 6-MP by the formation of 6-thiouric-acid (6-TUA). Thiopurine S-methyltransferase (TPMT) methylates 6-MP into 6-methylmercaptopurine (6-MMP). Via hypoxanthine phosphoribosyl transferase (HPRT), 6-MP is converted to 6-thioinosine-monophosphate (6-TIMP). Via two other enzymatic steps, inosine monophosphate dehydrogenase (IMPDH) and guanosine monophosphate synthetase (GMPS), a pool of 6-thioguanine nucleotides (6-TGN) is ultimately generated, consisting of 6-thioguanine monophosphate (6-TGMP), 6-thioguanine diphosphate (6-TGDP) and 6-thioguanine triphosphate (6-TGTP). 6-TIMP may also be methylated by TPMT leading to 6-methylmercaptopurine ribonucleotides (6-MMPR) (consisting of 6-methyl-thioinosine monophosphate, 6-methyl-thioinosine diphosphate and 6-methyl-thioinosine triphosphate). In a closed cycle, 6-TIMP may be phosphorylated to 6-thioinosine-diphosphate (6-TIDP), subsequently to 6-thioinosine triphosphate (6-TITP) and ultimately back to 6-TIMP, via the inosine triphosphate pyrophosphatase (ITPase).
In IBD, optimal therapeutic response has been associated with 6-TGN levels above 235 pmol per 8 × 10⁸ red blood cells (RBC), although 6-TGN levels higher than 490 pmol per 8 × 10⁸ RBC are associated with an increased risk to develop myelotoxicity. High levels of 6-MMPR (above 5700 pmol per 8 × 10⁸ RBC) are associated with an increased risk for hepatotoxicity, but also with treatment failure (Nygaard et al., 2004; Osterman et al., 2006). A 6-MMPR/6-TGN ratio lower than 11 is suggested to be indicative of a good response to AZA or 6-MP therapy, whereas a ratio higher than 11 appears to be an indicator for failure of AZA/6-MP-therapy, even after dose escalation (Dubinsky et al., 2002). Routine therapeutic monitoring of 6-TGN and 6-MMPR in RBC during thiopurine therapy is advocated to optimize thiopurine therapy and verify therapeutic compliance (Osterman et al., 2006; Bokemeyer et al., 2007). Nevertheless, the risk for developing adverse events requires frequent monitoring of routine laboratory parameters.
In addition to thiopurines, 5-aminosalicylate (5-ASA) is also frequently used in treatment of IBD. The exact pharmacological mechanism of 5-ASA is unknown, although a local anti-inflammatory effect is considered (van Bodegraven and Mulder, 2006). After absorption, 5-ASA is metabolized to the major inactive metabolite N-acetyl-5-aminosalicylate (N-Ac-5-ASA) by the N-acetyl-transferase-1 enzyme in intestinal epithelial and liver cells (Klotz, 1985; Allgayer et al., 1989).
Various studies have reported elevated 6-TGN levels, due to an alteration in thiopurine metabolism probably caused by co-administration of 5-ASA during thiopurine therapy. This increase has been associated with a higher risk for leukopenia, but also improved efficacy (Szumlanski and Weinshilboum, 1995; Lewis et al., 1997; Lowry et al., 2001; Dewit et al., 2002; Xin et al., 2005; Hande et al., 2006; De Boer et al., 2007b). The underlying pharmacological mechanism remains to be verified. It has been suggested that TPMT activity may be inhibited by 5-ASA, shunting metabolite formation from 6-MMPR towards 6-TGN (Szumlanski and Weinshilboum, 1995; Dewit et al., 2002; Xin et al., 2005), but the data are in part contradictory (Dilger et al., 2007).
Recently, we have published a prospective pharmacokinetic interaction study in IBD patients on steady state maintenance AZA or 6-MP therapy (De Boer et al., 2007b). A dose-dependent effect was observed for two different 5-ASA doses (2 g followed by 4 g, both daily during 4 weeks) on total levels of 6-TGN and 6-MMPR metabolites. Total 6-TGN levels increased significantly whereas 6-MMPR metabolite levels tended to decrease. However, the effect of 5-ASA on levels of the individual nucleotides (6-TGMP, 6-TGDP and the pivotal 6-TGTP) is currently unknown. Therefore, the present study aimed to determine the influence of 5-ASA on levels of 6-TGMP, 6-TGDP and 6-TGTP as well as 6-MMPR, using a subcohort of the previously described study population.
Methods
Patient selection
The study protocol was approved by the ethical committee of the VU University Medical Center and all patients gave written consent before enrolment in the study. The detailed inclusion criteria and prospective study design have been fully described elsewhere (De Boer et al., 2007b). All IBD patients were on steady-state thiopurine therapy at baseline with AZA or 6-MP for at least eight consecutive weeks (T1). The study scheme consisted of 2 g 5-ASA once daily (T2), followed by 2 g 5-ASA twice daily (T3), both during 4 weeks with continuation of AZA or 6-MP in unchanged doses (see Figure 2). Finally, there was a washout period of 4 weeks (T4). The 4-week intervals were chosen in order to reach steady-state levels of thiopurine metabolites (Derijks et al., 2004). The 5-ASA was given as Pentasa® microgranules (Ferring, Hoofddorp; the Netherlands). Metabolites were assessed at baseline (T1) and at the end of each 4-week study interval (T2–T4). Demographic data and disease activity (Harvey-Bradshaw index for CD and Truelove-Witts index for UC) were collected at baseline. Levels of thiopurine metabolites (6-MMPR; 6-TGMP, 6-TGDP and 6-TGTP in RBC) as well as 5-aminosalicylate levels (5-ASA- and N-Ac-5-ASA levels in serum) were determined at each study interval.
Figure 2.
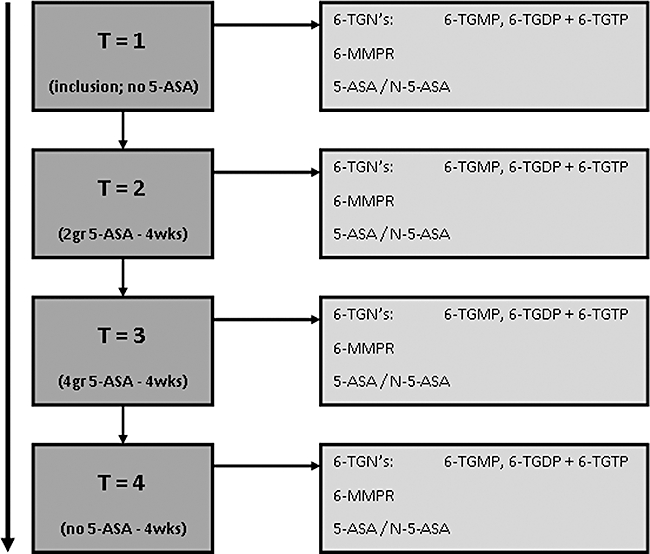
Trial design. The effect of increasing 5-ASA doses on AZA metabolite levels was investigated in three study periods of 4 weeks. Patients started with 2 g 5-ASA daily, which was subsequently increased to 4 g daily and followed by a washout period. Thiopurine doses remained unchanged throughout the entire study. Levels of 6-TGMP, 6-TGDP, 6-TGTP and 6-MMPR as well as those of 5-ASA and N-acetyl-5-aminosalicylic acid (N-Ac-5-ASA) were determined in each study period. 5-ASA, 5-aminosalicylate; 6-MMPR, 6-methylmercaptopurine ribonucleotides; 6-TGDP, 6-thioguanosine diphosphate; 6-TGMP, 6-thioguanosine monophosphate; 6-TGN, 6-thioguanine nucleotides; 6-TGTP, 6-thioguanosine triphosphate; AZA, azathioprine.
Outcome measurements
Primary outcome parameters were the changes in levels and ratio's of the 6-TGMP, 6-TGDP, 6-TGTP and 6-MMPR metabolites during the different 5-ASA dosage regimes.
Determination of 6-TGMP/6-TGDP/6-TGTP,6-MMPR and 6-TGN levels in RBC
Blood samples were collected in coated lithium heparin tubes, homogenized immediately and divided in equal portions for analysis of 6-MMPR or 6-TGMP/6-TGDP/6-TGTP levels respectively. The 6-MMPR samples were refrigerated and subsequently sent to the laboratory of the Clinical Pharmacy in the Orbis Medical Center (Sittard-Geleen, the Netherlands) for analysis and kept frozen until analysis of the 6-MMPR levels. The 6-MMPR levels were determined using a validated assay, based on a modified method as previously described by Derijks et al. (2004). The lower limit of detection (LOD) and lower limit of quantification (LOQ) of the 6-MMPR assay was found to be 150 and 300 pmol per 8 × 10⁸ RBC respectively.
Determination of 6-TGMP, 6-TGDP and 6-TGTP levels in RBC requires a strict pre-analytical sample procedure since substantial interconversion between these metabolites due to phosphorylation and transphosphorylation processes in RBC has been found. Furthermore, the stability of the thiopurine metabolites after patient sampling is critical (De Graaf et al., 2008; Karner et al., 2010). The second sample was therefore centrifuged immediately for isolation of RBC, subsequently washed with PBS buffer solution and counting of RBC was performed. All samples were stored at –80 °C until analysis. Levels of 6-TGMP, 6-TGDP and 6-TGTP in RBC were determined at the Dr Margarete Fischer-Bosch Institute of Clinical Pharmacology by a previously described high performance liquid chromatography (HPLC) assay (Neurath et al., 2005). The LOD for all 6-thioguanosine phosphates (TGMP, TGDP, TGTP) was 20 pmol·mL−1 RBC, corresponding to approximately 1.6 pmol per 8 × 10⁸ RBC. The LOQ for all analytes was 100 pmol·mL−1, corresponding to approximately 8.0 pmol per 8 × 10⁸ RBC.
Determination of 5-ASA and N-Ac-5-ASA levels
Blood samples were collected in serum tubes. The samples were centrifuged for at least 5 min at 1500×g. Subsequently, the serum was separated and stored at −20°C until analysis. The 5-ASA and N-Ac-5-ASA serum levels were measured in the Laboratory of Pharmacology & Toxicology (Orbis Medical Center, Sittard-Geleen, the Netherlands) using a slightly modified assay of Hussain et al. (1998). The LOD for both 5-ASA and N-acetyl-5-ASA was 4 ng·mL−1. LOQ for both 5-ASA and N-acetyl-5-ASA was 10 ng·mL−1. The within-run coefficient of variation was maximally 3.3% for both 5-ASA and N-acetyl-5-ASA in the range of the calibration.
Statistical analysis
Data are shown descriptively and expressed as median with range. Differences in metabolite levels, changes in 6-MMPR/6-TGN and 6-TGTP/(6-TGDP+TGTP) ratios were calculated and compared using the Wilcoxon Matched-Pairs Signed-Ranks Test. A mixed model analysis was used to detect parameters that influenced metabolite levels. Correlations between parameters were determined using the Pearson or Spearman test, when indicated. P-values of less than 0.05 were considered significant. Statistical Package for the Social Sciences (SPSS) for windows version 15.0 was used for statistical analysis.
Results
Patient demographics
Twenty-two IBD patients were included at the VU University Medical Center. Five patients were excluded from analysis due to incomplete data (all insufficient sample material), leaving 17 patients for analysis. Patient characteristics are presented in Table 1. All patients used AZA with a median dose of 1.90 mg·kg−1.
Table 1.
Patient characteristics
| Male/female | 6/11 (n = 17) |
| Age (median) | 41 years (range: 21–57) |
| Body mass index (median) | 21.7 (range: 15.9–27.8) |
| Crohn's disease/ulcerative colitis/indeterminate colitis | 11/5/1 |
| Truelove-Witts index (n = 5) (median) | 0 (range 0–1) |
| Harvey-Bradshaw index (n = 12) (median) | 1 (range 0–4) |
| Behaviour of Crohn's disease (n = 11) | Inflammatory = 8 |
| Stenotizing = 1 | |
| Fistulizing = 2 | |
| Daily dosage (median) | AZA = 150 mg·day−1 (range: 100–200) |
| Dosage per kg bodyweight (median) | AZA = 1.90 mg·kg−1 (range: 1.47–2.74) |
| Duration of thiopurine use (median) | 59 months (range: 11–147) |
AZA, azathioprine.
Pharmacokinetic outcomes
Median values of the individual 6-TGN, total 6-TGN, total 6-MMPR-levels and 5-ASA/N-5-Ac-ASA concentrations are shown in Figure 3.
Figure 3.
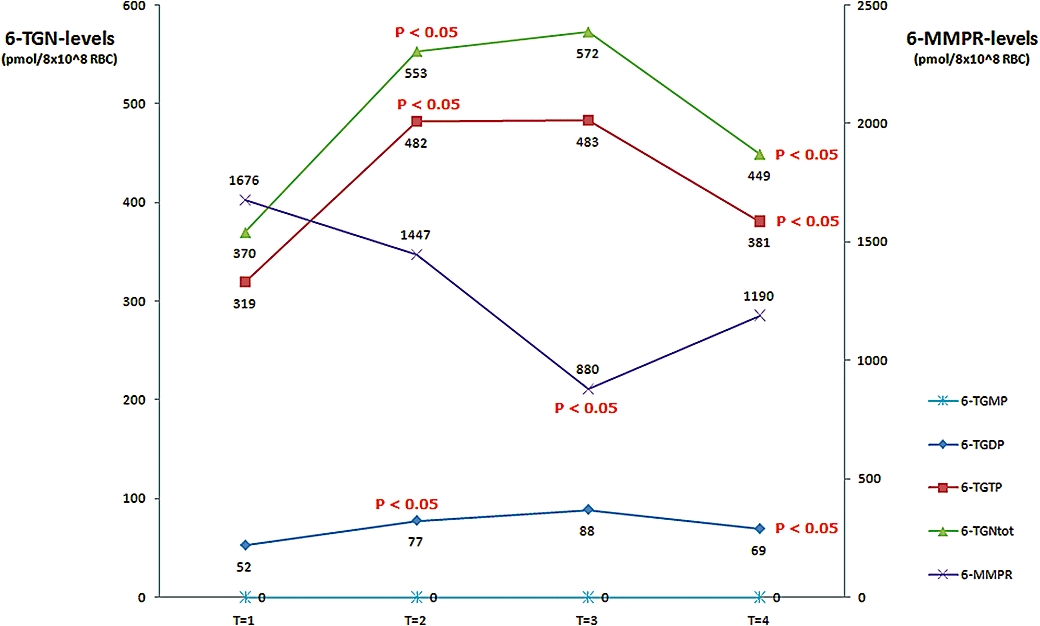
Influence of 5-ASA on individual thiopurine metabolite levels. The influence of different doses of 5-ASA on the median thiopurine metabolite levels of 6-TGMP, 6-TGDP, 6-TGTP and 6-MMPR in patients under steady-state thiopurine therapy. T1, baseline, no. 5-ASA; T2, 2 g 5-ASA daily; T3, 4 g 5-ASA daily; T4, washout, no. 5-ASA; note that thiopurine doses were not altered over these study periods. 5-ASA, 5-aminosalicylate; 6-MMPR, 6-methylmercaptopurine ribonucleotides; 6-TGDP, 6-thioguanosine diphosphate; 6-TGMP, 6-thioguanosine monophosphate; 6-TGN, 6-thioguanine nucleotides; 6-TGTP, 6-thioguanosine triphosphate.
Metabolite levels at T1
Median levels (and range) of total 6-TGN, 6-TGTP, 6-TGDP and 6-MMPR were 370 (96–682), 319 (83–583), 52 (14–192) and 1676 (0–9837) pmol per 8 × 10⁸ RBC respectively; 6-TGMP-levels were below the detection limit in all patients. The median total 6-TGN levels consisted of 85.5% 6-TGTP and 14.5% 6-TGDP. All except four patients showed total 6-TGN levels higher than 235 pmol per 8 × 10⁸ RBC. As expected, no 5-ASA or N-Ac-5-ASA was detected. No correlation was found between thiopurine dose (absolute or the relative dose per kg bodyweight) and individual and total 6-TGN or 6-MMPR levels.
Metabolite levels at T2
Co-medication with 2 g 5-ASA daily over 4 weeks (T2) led to a significant increase in 6-TGTP (P = 0.0002), 6-TGDP (P = 0.0002) and total 6-TGN (P = 0.0002) metabolite levels. Median levels (and range) of total 6-TGN, 6-TGTP, 6-TGDP and 6-MMPR were 553 (141–1139), 482 (123–949), 77 (18–242) and 1447 (0–10 412) respectively; 6-TGMP-levels were below the LOQ for all patients except one subject, reaching a value marginally above LOQ (123 pmol·mL−1). Serum levels of 5-ASA and N-Ac-5-ASA were 175 (6–4301) and 1260 (116–6241) ng·mL−1. The median relative increase in 6-TGDP, 6-TGTP and total 6-TGN-levels was 48%, 51% and 49%, respectively, being equivalent to an absolute rise of 25, 163 and 183 pmol per 8 × 10⁸ RBC. The 6-TGTP and 6-TGDP levels formed 84% and 16% of the total 6-TGN levels, similar to T1. Median 6-MMPR levels at T2 remained unchanged. All except three patients revealed total 6-TGN levels above 235 pmol per 8 × 10⁸ RBC.
Detailed analysis showed an increase in total 6-TGN levels in 14 patients (82%). Concerning 6-TGDP and 6-TGTP, elevation of metabolite levels was observed in 16 and 14 patients respectively (94% and 82%). Although statistically insignificant (P = 0.82), an overall decrease in 6-MMPR levels of 14% was observed, representing a median decrease of 229 pmol per 8 × 10⁸ RBC.
No correlations were observed between 6-TGN, 6-TGDP, 6-TGTP or 6-MMPR levels and serum 5-ASA or N-Ac5-ASA levels at T2, nor was the rise in individual 6-TGN, 6-TGDP and 6-TGTP levels associated with serum levels of 5-ASA or N-Ac-5-ASA.
Metabolite levels at T3
Further dose escalation of 5-ASA towards 4 g daily (T3) did not reveal a significant change in median levels of 6-TGDP, 6-TGTP and total 6-TGN levels compared with T2 (P = 0.404, P = 0.669 and P = 0.84 respectively). Median levels (and range) of total 6-TGN, 6-TGTP, 6-TGDP and 6-MMPR were 572 (184–1207), 483 (155–908), 89 (29–298) and 880 (0–9431) respectively. Again, 6-TGMP-levels were below the LOQ except in one case (141 pmol·mL−1), in which a very low level of 6-TGMP was also determined at T2. Serum levels of 5-ASA and N-Ac-5-ASA were 1295 (4–10 912) and 3049 (47–8348) ng·mL−1. The 6-TGTP and 6-TGDP levels attributed 84% and 16% to the total 6-TGN levels, comparable to T1 and T2. All except three patients had total 6-TGN levels above 235 pmol per 8 × 10⁸ RBC.
Compared with baseline (T1), an elevation of 6-TGDP and 6-TGTP metabolite levels was observed in 16 and 14 patients respectively. The median absolute increase in total 6-TGN, 6-TGDP, 6-TGTP-levels at T3 was comparable to those found at T2, being 203, 36 and 164 pmol per 8 × 10⁸ RBC respectively. Compared with T2, the median relative increase was marginal. Median 6-MMPR levels decreased significantly compared with T2 (P = 0.045) with a median decrease of 567 pmol per 8 × 10⁸ RBC.
Again, no correlations were observed between 6-TGN, 6-TGDP and 6-TGTP or 6-MMPR levels and serum 5-ASA or N-Ac-5-ASA levels at T3, nor was the increase in 6-TGN, 6-TGDP and 6-TGTP levels associated with 5-ASA or N-Ac-5-ASA serum levels.
Metabolite levels at T4
After discontinuation of 5-ASA (T4), the median levels of total 6-TGN (P = 0.004), 6-TGTP (P = 0.006) and 6-TGDP (P = 0.009) decreased significantly. Median levels (and range) of total 6-TGN, 6-TGTP, 6-TGDP and 6-MMPR were 449 (97–816), 381 (68–624), 69 (15–196) and 1190 (0–9811) respectively. Levels of 6-TGMP were undetectable in all patients, comparable to T1. Concentrations of 5-ASA and N-Ac-5-ASA could not be detected in the serum of any patient at T4.
Of note, two patients showed total 6-TGN levels still higher than 235 pmol per 8 × 10⁸ RBC. Total 6-TGN levels consisted of 83% 6-TGTP and 17% 6-TGDP levels, again comparable to all previous study phases. With respect to T3 the decline in median total 6-TGN levels by 123 pmol per 8 × 10⁸ RBC was observed in 13 patients (77%). For 6-TGDP and 6-TGTP, in 14 and 12 patients (82% and 71% respectively) a median absolute decline of 19 and 102 pmol per 8 × 10⁸ RBC respectively, was determined. Compared with T1, median metabolite levels of total 6-TGN (P = 0.034) and 6-TGDP (P = 0.018) levels were still significantly higher. The relative difference was 13% and 30%, representing 79 and 17 pmol per 8 × 10⁸ RBC. For 6-TGTP, the difference was 61 pmol per 8 × 10⁸ RBC (+19%), but only a trend towards significance was calculated (P = 0.057).
Median levels of 6-MMPR at T4 increased slightly by 310 pmol per 8 × 10⁸ RBC when compared with T3, but were still lower at 486 pmol per 8 × 10⁸ RBC) when compared with T1. However, both changes were non-significant (P = 0.083 and P = 0.78).
Changes in 6-MMPR/6-TGN ratio
A 6-MMPR/6-TGN ratio below 11 has been shown to correlate with clinical response to 6-MP therapy (Dubinsky et al., 2002). In our study, the median 6-MMPR/6-TGN ratio was below this value at any time point (Figure 4). However, total 6-TGN levels were always >235 pmol per 8 × 10⁸ RBC in patients with a 6-MMPR/6-TGN ratio <11. At T1, the median 6-MMPR/6-TGN ratio was 4.7 (range: 0–36); a ratio below 11 was observed in 13 patients (60%). Co-medication with 2 g 5-ASA (T2) showed a non-significant decrease of the median 6-MMPR/6-TGN ratio towards 2.4 (range: 0–24; P = 0.13). A ratio below 11 was observed in 14 patients (82%). Increasing 5-ASA dosage towards 4 g daily (T3) reduced the median 6-MMPR/6-TGN ratio further towards 1.7 (range: 0–11; P = 0.032) and a 6-MMPR/6-TGN ratio below 11 was observed in all patients at T3.
Figure 4.
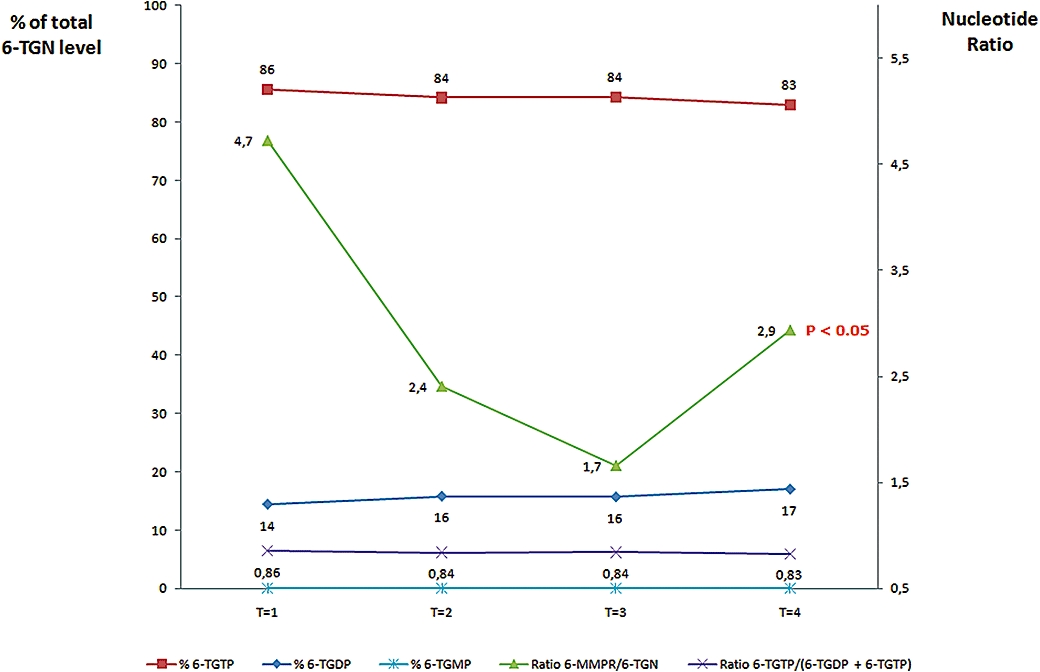
Influence of 5-ASA on different thiopurine metabolite ratios. Contribution of the individual levels of 6-TGDP and 6-TGTP to total 6-TGN-levels and the changes in 6-MMPR/6-TGN-ratio under co-administration of different 5-ASA doses in patients under steady-state thiopurine therapy. T1, baseline, no. 5-ASA; T2, 2 g 5-ASA daily; T3, 4 g 5-ASA daily; T4, washout, no. 5-ASA; note that thiopurine doses were not altered over these study periods. 5-ASA, 5-aminosalicylate; 6-MMPR, 6-methylmercaptopurine ribonucleotides; 6-TGDP, 6-thioguanosine diphosphate; 6-TGMP, 6-thioguanosine monophosphate; 6-TGN, 6-thioguanine nucleotides; 6-TGTP, 6-thioguanosine triphosphate.
Discontinuation of 5-ASA at T4 resulted in a significant increase of the median 6-MMPR/6-TGN ratio to 2.9 (range: 0–14; P = 0.01) when compared with T3. A 6-MMPR/6-TGN ratio below 11 was still observed in 12 patients (71%). No significant difference in median ratio was observed between T1 and T4 (P = 0.5).
6-TGDP- and 6-TGTP-concentrations in relation to total 6-TGN-levels
During the entire study period no alteration was seen for the relative contribution of 6-TGDP and 6-TGTP to total 6-TGN-levels as calculated by the 6-TGTP/(6-TGTP+6-TGDP) ratio (see Figure 4). Concerning 6-TGDP, the contribution was 14.5% at T1 (range: 9.6–28.8%), 15.8% at T2 (range: 12.2–23.8%), 15.7% at T3 (range: 12.1–32.4%) and 17.1% (range: 10.5–29.7%) at T4. For 6-TGTP, the relative contribution to total 6-TGN was 85.5% at T1 (range: 71.2–90.4%), 84.2% at T2 (range: 76.2–87.8%), 84.3% at T3 (range: 676–87.9%) and 82.9% (range: 70.3–89.5%) at T4. In line with previous publications (Neurath et al., 2005; Vikingsson et al. 2009; Karner et al., 2010), the 6-TGMP-levels were below or at the limit of detection.
As the contribution of individual 6-TGN levels did not change, the median 6-TGTP/(6-TGTP+6-TGDP) ratios were also comparable between all study periods: 0.86 at T1 (range: 0.71–0.90), 0.84 at T2 (range: 0.76–0.88), 0.84 at T3 (range: 0.68–0.88) and 0.83 (range: 0.71–0.90) at T4.
Discussion
Increase of total 6-TGN levels after addition of 5-ASA has been reported before (Szumlanski and Weinshilboum, 1995; Lewis et al., 1997; Lowry et al., 2001; Dewit et al., 2002; Xin et al., 2005; Hande et al., 2006; De Boer et al., 2007b). However, in the present study we have demonstrated that the elevation of total 6-TGN levels is caused only by an increase in both 6-TGTP and 6-TGDP concentrations whereas 6-TGMP levels were under the LOQ. This is also reflected by a constant ratio of 6-TGTP/(6-TGTP+6-TGDP), not influenced by increasing doses of 5-ASA. The metabolite 6-TGTP is the main metabolite within the total pool of 6-TGN (approximately 85%). Additionally, after dose escalation of 5-ASA to 4 g daily we have shown decreased 6-MMPR levels and subsequently an alteration of the 6-MMPR/6-TGN ratio.
As the metabolic pathway of thiopurines is complex, it is difficult to address the exact mechanism for this pharmacokinetic interaction. TPMT and xanthine oxidase (XO) are key enzymes in thiopurine metabolism, as both play an important role in the formation of the key metabolites, 6-TGN and 6-MMPR. Furthermore, both enzymes are also subject to pharmacogenetic polymorphisms (Teml et al., (2007).
The role of TPMT
The TPMT enzyme shunts the thiopurine metabolism towards the formation of 6-MMPR after absorption (Figure 1). Therefore, inhibition of TPMT by 5-ASA could result in reduced 6-MMPR-levels in favour of an increased formation of 6-TGN metabolites as we observed in our study. The effect of 5-ASA on TPMT activity or thiopurine metabolite levels has been demonstrated in vitro and ex vivo (Szumlanski and Weinshilboum, 1995; Xin et al., 2005). However, conflicting data are available as several in vivo studies do not confirm these results (Dewit et al., 2002; Gilissen et al., 2005; Dilger et al., 2007). This may be explained by analytical problems, such as an untimely 5-ASA removal from the sample matrix during analysis. However, Xin et al. (2005) have recently reported in vitro inhibitory concentrations (IC50-values) of 5-ASA (129–236 µM) and N-Ac-5-ASA (58–74 µM) for TPMT activity. Although in our study the median 5-ASA and N-Ac-5-ASA serum trough concentrations were below the published IC50-values for TPMT, our findings are in line with findings reported by others (Sandborn and Hanauer, 2003). Moreover, we cannot exclude the possibility that the IC50-values could be achieved intracellularly, for instance in RBC, by influencing the expression/function of efflux membrane transporters such as ABC transporters, thereby resulting in an increase of 6-TGN as observed at T2 and a decrease of 6-MMPR-levels at T3.
Effect of 5-ASA on 6-TGMP, 6-TGDP and 6-TGTP-levels
Earlier, we had demonstrated a dose-dependent effect of 5-ASA on total 6-TGN-levels (De Boer et al., 2007b). From our current findings, it is clear that phosphorylation of 6-TGDP to 6-TGTP is not influenced by 5-ASA or N-Ac-5-ASA as no changes in 6-TGTP/(6-TGTP+6-TGDP)-ratios were observed at all time points. This interaction therefore seems relevant for all 5-ASA formulations, including the new MMX extended release formulation (although this should be confirmed in clinical trials). Due to an increase in total 6-TGN and a decrease in 6-MMPR-levels, the median 6-MMPR/6-TGN ratio decreased significantly. Of note, our present data clearly indicate that the increase in total 6-TGN-levels is explained by the elevation of the individual 6-TGTP- and 6-TGDP-levels. Furthermore, 6-TGTP remains the main metabolite within the total pool of 6-TGN (approximately 85%) whereas the lack of 6-TGMP metabolites is in line with previous observations in IBD patients where individual 6-TGN levels were determined (Neurath et al., 2005; Vikingsson et al., 2009). Overall, our results show that determination of total 6-TGN-levels will suffice for routine monitoring of thiopurine metabolites.
Possible clinical importance of this pharmacological interaction
Publications concerning clinical relevance of individual 6-thioguanosine phosphate levels are few, following the landmark study by Neurath et al. (2005). They showed that higher 6-TGN levels combined with higher 6-TGDP levels were associated with reduced clinical response to AZA therapy. Furthermore, a 6-TGDP content of more than 15% of total 6-TGN levels was associated with poor response. Our study shows that the combination of AZA with 2 g 5-ASA daily will result in increased total 6-TGN as well as 6-TGTP levels while maintaining 6-TGDP levels around 15%. Furthermore, a reduction of 6-MMPR levels was observed after dose-escalation of 5-ASA to 4 g daily. Thus, theoretically an improved clinical response to AZA-therapy in IBD patients could be expected after co-administration with 5-ASA. Moreover, the combination of AZA and 5-ASA offers the opportunity to reduce the risk for hepatotoxic adverse reactions related to AZA, as elevated 6-MMPR levels have been clearly linked to hepatotoxicity (Dubinsky et al., 2002, Nygaard et al., 2004). In consequence the compliance in taking AZA may also be improved. Shunting thiopurine metabolism from 6-MMPR towards 6-TGN has been suggested earlier and can probably be achieved by adding 5-ASA (Dewit et al., 2002) and even possibly by allopurinol, a potent XO inhibitor, as recently mentioned (Sparrow et al., 2007; Ansari et al. 2008).
On the other hand, co-administration of 5-ASA could ultimately result in an increased risk for haematotoxicity such as leukopenia or bone marrow suppression. Signs of reversible myelotoxicity were observed in one patient of our study, possibly explained by a combined myelosuppressive effect of both 5-ASA and increased 6-TGN-levels. Decreased TPMT activity based on genetic polymorphisms could be an additional risk factor for developing AZA-related myelosuppression (Schwab et al., 2002; Teml et al., 2007) but unfortunately TPMT testing was not carried out in our trial.
Nevertheless, it should be mentioned that haematotoxicity can occur independent of TPMT activity in IBD patients treated with AZA, due to several others reasons, such as viral infection (Gisbert and Gomollón 2008). Moreover, serious haematological adverse events will occur early in patients with intermediate or low TPMT activity after onset of AZA therapy (Colombel et al., 2000; Gisbert and Gomollón, 2008). This is in line with the concept of a gene-dose effect related to TPMT (Schaeffeler and Fischer, 2004). Thus even in IBD patients without TPMT testing, co-administration of 5-ASA with increasing doses might be a feasible approach. Nevertheless regular laboratory controls (including haematological, hepatic and pancreatic markers), therapeutic drug monitoring and/or a prior-to-treat determination of TPMT activity may be helpful to predict a favourable risk/benefit ratio in the utilization of thiopurines in IBD patients.
In conclusion, we have demonstrated in this study that co-administration of 5-ASA 2 g daily in patients on steady-state AZA therapy induces an increase in median 6-TGDP, 6-TGTP and total 6-TGN-levels. Subsequent increase of the 5-ASA dosage to 4 g daily showed no further elevation of individual 6-TGN levels in RBC, but a reduction in total 6-MMPR levels and a substantial decrease of the 6-MMPR/6-TGN ratio. Elevation of total 6-TGN levels was caused by an increase of both 6-TGTP and 6-TGDP metabolite levels. No alteration of 6-thioguanosine phosphate levels was found during treatment with 5-ASA.
In theory, IBD patients unresponsive or refractory to standard thiopurine therapy may benefit from the co-administration of 5-ASA, leading to an increase of the pharmacologically active 6-TGN (i.e. 6-TGTP), a decrease in 6-MMPR levels and a reduced 6-MMPR/6-TGN-ratio. Monitoring of individual 6-TGN and 6-MMPR levels may provide detailed information concerning clinical response and treatment failure. To improve pharmacotherapy of thiopurines in treatment of patients with IBD, further clinical studies are warranted to elucidate our study results in representative patient cohorts.
Acknowledgments
The authors want to thank all technicians of the clinical pharmacological laboratories involved with this study for their skilful technical assistance with the individual thiopurine metabolites and 5-ASA/N-Ac-5-ASA analysis. The help of Dr KJ Kan with statistical analysis is greatly appreciated. MS and SK were supported by the Robert Bosch Foundation, Stuttgart, Germany. MS was in part supported by the Federal Ministry for Education and Research (BMBF, Berlin, Germany) Grant 03 IS 2061C.
Glossary
Abbreviations:
- 5-ASA
5-aminosalicylate
- 6-MMPR
6-methylmercaptopurine ribonucleotides
- 6-MP
6–mercaptopurine
- 6-TGDP
6-thioguanosine diphosphate
- 6-TGMP
6-thioguanosine monophosphate
- 6-TGN
6-thioguanine nucleotides
- 6-TGTP
6-thioguanosine triphosphate
- AZA
azathioprine
- CD
Crohn's disease
- IBD
inflammatory bowel disease
- IC
indeterminate colitis
- ITPase
inosine triphosphate pyrophosphatase
- LOD
limit of detection
- LOQ
lower limit of quantification
- N-Ac-5-ASA
N-acetyl-5-aminosalicylate
- TPMT
thiopurine methyltransferase
- UC
ulcerative colitis
- XO
xanthine oxidase
Conflicts of interest
This study was supported by an unrestricted research grant from Ferring BV (Hoofddorp, the Netherlands).
References
- Allgayer H, Ahnfelt NO, Kruis W, Klotz U, Frank-Holmberg K, Soderberg HN, et al. Colonic N-acetylation of 5-aminosalicylic acid in inflammatory bowel disease. Gastroenterology. 1989;97:38–41. doi: 10.1016/0016-5085(89)91412-1. [DOI] [PubMed] [Google Scholar]
- Ansari A, Elliott T, Baburajan B, Mayhead P, O'Donohue J, Chocair P, et al. Long-term outcome of using allopurinol co-therapy as a strategy for overcoming thiopurine hepatotoxicity in treating inflammatory bowel disease. Aliment Pharmacol Ther. 2008;28:734–741. doi: 10.1111/j.1365-2036.2008.03782.x. [DOI] [PubMed] [Google Scholar]
- van Bodegraven AA, Mulder CJ. Indications for 5-aminosalicylate in inflammatory bowel disease: is the body of evidence complete? World J Gastroenterol. 2006;12:6115–6123. doi: 10.3748/wjg.v12.i38.6115. [DOI] [PMC free article] [PubMed] [Google Scholar]
- de Boer NK, van Bodegraven AA, Jharap B, De Graaf P, Mulder CJ. Drug insight: pharmacology and toxicity of thiopurine therapy in patients with IBD. Nat Clin Pract Gastroenterol Hepatol. 2007a;4:686–694. doi: 10.1038/ncpgasthep1000. [DOI] [PubMed] [Google Scholar]
- de Boer NK, Wong DR, Jharap B, De Graaf P, Hooymans PM, Mulder CJ, et al. Dose-dependent influence of 5-aminosalicylates on thiopurine metabolism. Am J Gastroenterol. 2007b;102:2747–2753. doi: 10.1111/j.1572-0241.2007.01511.x. [DOI] [PubMed] [Google Scholar]
- Bokemeyer B, Teml A, Roggel C, Hartmann P, Fischer C, Schaeffeler E, et al. Adherence to thiopurine treatment in out-patients with Crohn's disease. Aliment Pharmacol Ther. 2007;26:217–225. doi: 10.1111/j.1365-2036.2007.03365.x. [DOI] [PubMed] [Google Scholar]
- Colombel JF, Ferrari N, Debuysere H, Marteau P, Gendre JP, Bonaz B, et al. F. Genotypic analysis of thiopurine S-methyltransferase in patients with Crohn's disease and severe myelosuppression during azathioprine therapy. Gastroenterology. 2000;6:1025–1030. doi: 10.1016/s0016-5085(00)70354-4. [DOI] [PubMed] [Google Scholar]
- Derijks LJ, Gilissen LP, Engels LG, Bos LP, Bus PJ, Lohman JJ, et al. Pharmacokinetics of 6-mercaptopurine in patients with inflammatory bowel disease: implications for therapy. Ther Drug Monit. 2004;26:311–318. doi: 10.1097/00007691-200406000-00016. [DOI] [PubMed] [Google Scholar]
- Dewit O, Vanheuverzwyn R, Desager JP, Horsmans Y. Interaction between azathioprine and aminosalicylates: an in vivo study in patients with Crohn's disease. Aliment Pharmacol Ther. 2002;16:79–85. doi: 10.1046/j.1365-2036.2002.01156.x. [DOI] [PubMed] [Google Scholar]
- Dilger K, Schaeffeler E, Lukas M, Strauch U, Herfarth H, Muller R, et al. Monitoring of thiopurine methyltransferase activity in postsurgical patients with Crohn's disease during 1 year of treatment with azathioprine or mesalazine. Ther Drug Monit. 2007;29:1–5. doi: 10.1097/FTD.0b013e3180312b9a. [DOI] [PubMed] [Google Scholar]
- Dubinsky MC, Yang H, Hassard PV, Seidman EG, Kam LY, Abreu MT, et al. 6-MP metabolite profiles provide a biochemical explanation for 6-MP resistance in patients with inflammatory bowel disease. Gastroenterology. 2002;122:904–915. doi: 10.1053/gast.2002.32420. [DOI] [PubMed] [Google Scholar]
- Gisbert JP, Gomollón F. Thiopurine-induced myelotoxicity in patients with inflammatory bowel disease: a review. Am J Gastroenterol. 2008;7:1783–1800. doi: 10.1111/j.1572-0241.2008.01848.x. [DOI] [PubMed] [Google Scholar]
- Gilissen LP, Bierau J, Derijks LJ, Bos LP, Hooymans PM, van Gennip A, et al. The pharmacokinetic effect of discontinuation of mesalazine on mercaptopurine metabolite levels in inflammatory bowel disease patients. Aliment Pharmacol Ther. 2005;22:605–611. doi: 10.1111/j.1365-2036.2005.02630.x. [DOI] [PubMed] [Google Scholar]
- de Graaf P, De Boer NK, Jharap B, Mulder CJ, van Bodegraven AA, Veldkamp AI. Stability of thiopurine metabolites: a potential analytical bias. Clin Chem. 2008;54:216–218. doi: 10.1373/clinchem.2007.092676. [DOI] [PubMed] [Google Scholar]
- Hande S, Wilson-Rich N, Bousvaros A, Zholudev A, Maurer R, Banks P, et al. 5-aminosalicylate therapy is associated with higher 6-thioguanine levels in adults and children with inflammatory bowel disease in remission on 6-mercaptopurine or azathioprine. Inflamm Bowel Dis. 2006;12:251–257. doi: 10.1097/01.MIB.0000206544.05661.9f. [DOI] [PubMed] [Google Scholar]
- Hussain FN, Ajjan RA, Moustafa M, Anderson JC, Riley SA. Simple method for the determination of 5-aminosalicylic and N-acetyl-5-aminosalicylic acid in rectal tissue biopsies. J Chromatogr B Biomed Sci Appl. 1998;716:257–266. doi: 10.1016/s0378-4347(98)00323-5. [DOI] [PubMed] [Google Scholar]
- Karner S, Shi S, Fischer C, Schaeffeler E, Neurath MF, Herrlinger KR, et al. Determination of 6-thioguanosine diphosphate and triphosphate and nucleoside diphosphate kinase activity in erythrocytes: novel targets for thiopurine therapy? Ther Drug Monit. 2010 doi: 10.1097/FTD.0b013e3181d12f19. Epub ahead of print. [DOI] [PubMed] [Google Scholar]
- Klotz U. Clinical pharmacokinetics of sulphasalazine, its metabolites and other prodrugs of 5-aminosalicylic acid. Clin Pharmacokinet. 1985;10:285–302. doi: 10.2165/00003088-198510040-00001. [DOI] [PubMed] [Google Scholar]
- Lewis LD, Benin A, Szumlanski CL, Otterness DM, Lennard L, Weinshilboum RM, et al. Olsalazine and 6-mercaptopurine-related bone marrow suppression: a possible drug-drug interaction. Clin Pharmacol Ther. 1997;62:464–475. doi: 10.1016/S0009-9236(97)90125-9. [DOI] [PubMed] [Google Scholar]
- Lowry PW, Franklin CL, Weaver AL, Szumlanski CL, Mays DC, Loftus EV, et al. Leucopenia resulting from a drug interaction between azathioprine or 6-mercaptopurine and mesalamine, sulphasalazine, or balsalazide. Gut. 2001;49:656–664. doi: 10.1136/gut.49.5.656. [DOI] [PMC free article] [PubMed] [Google Scholar]
- Neurath MF, Kiesslich R, Teichgraber U, Fischer C, Hofmann U, Eichelbaum M, et al. 6-thioguanosine diphosphate and triphosphate levels in red blood cells and response to azathioprine therapy in Crohn's disease. Clin Gastroenterol Hepatol. 2005;3:1007–1014. doi: 10.1016/s1542-3565(05)00697-x. [DOI] [PubMed] [Google Scholar]
- Nygaard U, Toft N, Schmiegelow K. Methylated metabolites of 6-mercaptopurine are associated with hepatotoxicity. Clin Pharmacol Ther. 2004;75:274–281. doi: 10.1016/j.clpt.2003.12.001. [DOI] [PubMed] [Google Scholar]
- Osterman MT, Kundu R, Lichtenstein GR, Lewis JD. Association of 6-thioguanine nucleotide levels and inflammatory bowel disease activity: a meta-analysis. Gastroenterology. 2006;130:1047–1053. doi: 10.1053/j.gastro.2006.01.046. [DOI] [PubMed] [Google Scholar]
- Poppe D, Tiede I, Fritz G, Becker C, Bartsch B, Wirtz S, et al. Azathioprine suppresses ezrin-radixin-moesin-dependent T cell-APC conjugation through inhibition of Vav guanosine exchange activity on Rac proteins. J Immunol. 2006;176:640–651. doi: 10.4049/jimmunol.176.1.640. [DOI] [PMC free article] [PubMed] [Google Scholar]
- Sandborn WJ, Hanauer SB. Systematic review: the pharmacokinetic profiles of oral mesalazine formulations and mesalazine pro-drugs used in the management of ulcerative colitis. Aliment Pharmacol Ther. 2003;17:29–42. doi: 10.1046/j.1365-2036.2003.01408.x. [DOI] [PubMed] [Google Scholar]
- Schaeffeler E, Fischer C, Brockmeier D, Wernet D, Moerike K, Eichelbaum M, et al. Comprehensive analysis of thiopurine S-methyltransferase phenotype-genotype correlation in a large population of German-Caucasians and identification of novel TPMT variants. Pharmacogenetics. 2004;7:407–417. doi: 10.1097/01.fpc.0000114745.08559.db. [DOI] [PubMed] [Google Scholar]
- Schwab M, Schäffeler E, Marx C, Fischer C, Lang T, Behrens C, et al. Azathioprine therapy and adverse drug reactions in patients with inflammatory bowel disease: impact of thiopurine S-methyltransferase polymorphism. Pharmacogenetics. 2002;6:429–436. doi: 10.1097/00008571-200208000-00003. [DOI] [PubMed] [Google Scholar]
- Sparrow MP, Hande SA, Friedman S, Cao D, Hanauer SB. Effect of allopurinol on clinical outcomes in inflammatory bowel disease nonresponders to azathioprine or 6-mercaptopurine. Clin Gastroenterol Hepatol. 2007;5:209–214. doi: 10.1016/j.cgh.2006.11.020. [DOI] [PubMed] [Google Scholar]
- Szumlanski CL, Weinshilboum RM. Sulphasalazine inhibition of thiopurine methyltransferase: possible mechanism for interaction with 6-mercaptopurine and azathioprine. Br J Clin Pharmacol. 1995;39:456–459. doi: 10.1111/j.1365-2125.1995.tb04478.x. [DOI] [PMC free article] [PubMed] [Google Scholar]
- Teml A, Schaeffeler E, Herrlinger KR, Klotz U, Schwab M. Thiopurine treatment in inflammatory bowel disease: clinical pharmacology and implication of pharmacogenetically guided dosing. Clin Pharmacokinet. 2007;46:187–208. doi: 10.2165/00003088-200746030-00001. [DOI] [PubMed] [Google Scholar]
- Tiede I, Fritz G, Strand S, Poppe D, Dvorsky R, Strand D, et al. CD28-dependent Rac1 activation is the molecular target of azathioprine in primary human CD4+ T lymphocytes. J Clin Invest. 2003;111:1133–1145. doi: 10.1172/JCI16432. [DOI] [PMC free article] [PubMed] [Google Scholar]
- Vikingsson S, Carlsson B, Almer SH, Peterson C. Monitoring of thiopurine metabolites in patients with inflammatory bowel disease-what is actually measured? Ther Drug Monit. 2009;31:345–350. doi: 10.1097/FTD.0b013e3181a1ea58. [DOI] [PubMed] [Google Scholar]
- Xin H, Fischer C, Schwab M, Klotz U. Effects of aminosalicylates on thiopurine S-methyltransferase activity: an ex vivo study in patients with inflammatory bowel disease. Aliment Pharmacol Ther. 2005;21:1105–1109. doi: 10.1111/j.1365-2036.2005.02460.x. [DOI] [PubMed] [Google Scholar]