Abstract
Herein, a systematic study on the identification and quantitation of choline-containing phospholipid molecular species, including choline glycerophospholipid (PC), lysoPC, and sphingomyelin (SM), is described using multi-dimensional mass spectrometry-based shotgun lipidomics after intrasource separation (MDMS-SL). Current methods for analysis of choline-containing lipids were improved through multiple modifications leading to: (1) identification of constituents present in the PC and SM classes, subclasses of PC, and individual molecular species using MDMS-SL analysis in the positive-ion mode; (2) identification of the fatty acyl constituents and their regiospecificity in diacyl PC molecular species through the neutral loss of trimethylamine plus fatty acids; (3) direct identification of the alkenyl chains of plasmenylcholine species using precursor ion scans of the fragment ions carrying the alkenyl chains; (4) elimination of the effects of polyunsaturation on the quantitation of PC species by multiple ratiometric comparisons; (5) accurate identification and quantitation of lysoPC molecular species including regioisomers by diagnostic fragment ions; and (6) accurate identification and quantitation of SM molecular species by neutral loss scans of phosphocholine plus methyl aldehyde which is specific to SM molecular species. With these enhancements, the application of MDMS-SL for the analyses of choline-containing phospholipid molecular species in biomedical research has been extended to a much larger number of molecular species with greater quantitative accuracy and an increased depth of structural information.
Keywords: Choline-containing phospholipid, Lipidomics, Lysoplasmenylcholine, Lysophosphatidylcholine, Multi-dimensional mass spectrometry, Plasmenylcholine, Shotgun lipidomics, Sphingomyelin
1. Introduction
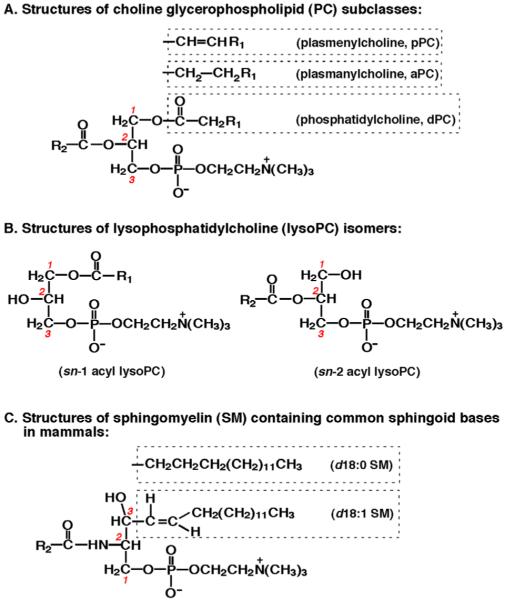
Choline-containing phospholipids (i.e., choline glycerophospholipid (PC), lysoPC, and sphingomyelin (SM)) (Fig. 1) are prominent constituents present in cellular membranes [1]. Since choline-containing phospholipids play crucial roles in multiple cellular functions [1], it is essential to investigate the kinetics and dynamics of choline-containing phospholipids. Many approaches have been developed to identify and quantitate the individual molecular species of these lipid classes including those present in low abundance using efficient methods to access large databases containing thousands of low abundance chemically distinct lipids (i.e., the lipidomic approach) [2-5].
Fig. 1.
Structures of choline-containing phospholipids. Choline glycerophospholipids (PC) are comprised of three subclasses based on their different linkages between aliphatic chain and the hydroxy group at the sn-1 position of glycerol which is indicated with red numbers (Panel A). These include ester, ether, and vinyl ether linkages corresponding to phosphatidylcholine (dPC), plasmanylcholine (aPC), and plasmenylcholine (pPC). Lysophosphatidylcholine (lysoPC) molecular species are present in sn-1 acyl and sn-2 acyl isomers (Panel B). Sphingosine (d18:1) and sphinganine (i.e., dihydrosphingosine, d18:0) are the most common sphingoid bases of sphingomyelin molecular species present in mammals (Panel C).
For example, many studies have employed electrospray ionization (ESI) mass spectrometry (MS) and/or tandem MS coupled with reversed phase high performance liquid chromatography (HPLC) with or without pre-separation of these classes with normal phase HPLC or thin layer chromatography [6-11]. These methods have exploited the synergy of chromatographic resolution with the rich structural information and sensitivity available from MS and MS/MS. Either ammonium-containing salts or weakly acidic conditions have been employed as modifiers in almost all these HPLC-coupled MS analyses of choline-containing phospholipids, under which the protonated molecular species of choline-containing phospholipids are solely detected [6]. A unique fragment ion at m/z 184 corresponding to phosphocholine is present in the product ion analysis of protonated choline-containing phospholipid molecular species [6]. This fragment ion is diagnostic for the presence of choline-containing phospholipids and its extraordinary sensitivity has proven useful in the analysis of PC particularly in combination with a multiple-reaction monitoring or selected ion monitoring techniques [11]. Unfortunately, only minimal information about the fatty acyl chains and regiospecificity can be detected from analysis of protonated molecular ions alone.
Similarly, any ESI-MS analysis of choline-containing phospholipids after direct infusion in the presence of either ammoniumcontaining salts or weak acids in the infused solution shows protonated molecular ions [3,6]. Precursor ion scan (PIS) of 184 Thomson (Th) from the protonated species has been frequently used for identification and quantitation of choline-containing molecular species [12-14]. In this approach, negative-ion ESI-MS/MS analyses of the anion adducts of choline-containing phospholipid species was performed to deduce useful structural information [14-16].
In multi-dimensional MS-based shotgun lipidomics after intrasource separation (MDMS-SL) which has been developed by our group [3,17], complex lipids extracted from biological samples have been analyzed directly in the absence or presence of LiOH [18-20]. For example, lysoPC molecular species have been directly interrogated in the positive-ion mode after ESI in the absence of LiOH in the infusion solution of a diluted lipid extract in the mass region of m/z 400–600 [21]. Neutral loss scan (NLS) of 59.0 U (NLS59.0, i.e., loss of trimethylamine) has been used to further “filter” extremely low abundant lysoPC molecular species in this region and identify the fatty aliphatic chains in those mass spectrometrically “isolated” ions [3,22].
PC molecular species in MDMS-SL have been visualized in the positive-ion ESI mass spectra acquired in the presence of a small amount of LiOH in the infusion solution of a diluted lipid extract in the mass region of m/z 600–900. NLS of 183.1 U (NLS183.1, i.e., phosphocholine), 189.1 U (NLS189.1, i.e., lithium cholinephosphate), or both have been used to “isolate” PC molecular species present in the lipid extracts of biological samples [3]. The interference of SM molecular species in the lipid extracts has been eliminated using “the nitrogen rule” in mass spectrometry [3]. The fatty acyl constituents of the “isolated” PC molecular species have been identified by NLS of all naturally occurring fatty acids from their lithium adducts [18]. SM molecular species in MDMS-SL have been visualized in the positive-ion ESI mass spectra acquired in the presence of a small amount of LiOH in the infusion solution of a diluted, alkaline-treated lipid extract in the mass region of m/z 600–900 [20]. NLS of 183.1 U (i.e., phosphocholine) has been used to “isolate” SM molecular species present in the alkaline-treated lipid extracts of biological samples [20]. The fatty amide constituents of SM molecular species have been deduced after NLS of sphingoid bases as described previously [19,20].
There exist some limitations in these approaches of MDMS-SL for the analysis of lysoPC, PC, and SM molecular species. For example, the presence of any other alkaline metal (e.g., lithium or potassium) influences the identification of lysoPC molecular species and induces false positive identification of SM species [3]. When relatively abundant amounts of triacylglycerol (TAG) species are present in a lipid extract, the facile neutral losses of fatty acids from those TAG molecular species in comparison to those resulting from PC species interferes with the identification of PC molecular species [18]. Furthermore, we also recognized the dependence of NLS183.1 or NLS189.1 on the physical properties (e.g., the degree of unsaturation) of individual PC molecular species [3].
Accordingly, in the current study, we developed a new approach through modification and/or extension of existing methods for the analysis of choline-containing phospholipid molecular species. In this improved method, lysoPC molecular species were further confirmed by NLS205.1 (corresponding to the loss of sodiated cholinephosphate); PC subclasses and molecular species were identified by combination of NLS59.0, NLS183.1, and NLS189.1 as well as the identification of alkenyl chains. The regiospecificity of their acyl chains in diacyl phosphatidylcholine (dPC) species were identified by NLS (59.0 plus the mass of fatty acids (FA)) in a two-dimensional mass spectrometric format. The combined utilization of NLS59.0, NLS183.1, and NLS189.1 in identification and quantitation of PC molecular species is extensively discussed. Specific NLS213.1 to SM molecular species was also employed. An example of the use of these methods in the systematic analysis of choline-containing phospholipid molecular species in lipid extracts of rabbit myocardium is given. Collectively, these enhancements of MDMS-SL greatly facilitate the identification and quantitation of choline-containing phospholipid molecular species including subclasses and regioisomers of all choline-containing phospholipids directly from extracts of biological samples.
2. Materials and methods
2.1. Materials
Synthetic phospholipids (including 1,2-dimyristoleoyl-sn-glycero-3-phosphocholine (14:1–14:1 dPC), 1-heptadecanoyl-2-hydroxyl-sn-glycero-3-phosphocholine (17:0 lysoPC), and N-lauroryl sphingomyelin (N12:0 SM)) were purchased from Avanti Polar Lipids, Inc. (Alabaster, AL). All the solvents were obtained from Burdick and Jackson (Honeywell International Inc., Burdick and Jackson, Muskegon, MI). All other chemicals were purchased from Sigma–Aldrich (St. Louis, MO).
2.2. Preparation of lipid extracts from biological samples
Mice (male, C57 BL/J background, 4 months of age) were purchased from The Jackson Laboratory (Bar Harbor, ME). Male New Zealand white rabbits (~1 kg body weight) were purchased from Myrtles Rabbitry, Inc. (Thompson Station, TN). All animal procedures were performed in accordance with the Guide for the Care and Use of Laboratory Animals and were approved by the Animals Studies Committee at Washington University. Animals were anesthetized by asphyxiation with CO2. Tissue samples including heart and brain were immediately harvested, perfused with ice-cold diluted (10×) phosphate-buffered saline (PBS), blotted with Kim-wipe, and freeze-clamped at the temperature of liquid nitrogen. The tissue wafers were pulverized into a fine powder with a stainless-steel mortar and pestle. A sample (approximately 10 mg) from each powdered tissue sample was weighed and homogenized in 1 ml of ice-cold diluted (10×) PBS with a Potter–Elvehjem tissue grinder. Protein assays on each individual homogenate were performed using a bicinchoninic acid protein assay kit (Pierce, Rockford, IL) with bovine serum albumin as a standard. An aliquot of homogenate (~1 ml) from each sample was transferred to a separate disposable culture borosilicate glass tube and total lipids were extracted in the presence of the selected internal standards as previously described [19]. It is necessary to add the internal standard solution to each tissue sample based on protein concentration prior to extraction of lipids (e.g., standards of 7.5 nmol 14:1–14:1 dPC/mg protein, 150 pmol 17:0 lysoPC/mg protein, and 900 pmol N12:0 SM/mg protein were spiked prior to extraction of rabbit myocardial lipids). This was to eliminate any possible incomplete extraction of a class of lipids of interest and to normalize the final lipid content to the protein content through ion intensity comparison between the selected internal standard and an unknown analyte (i.e., ratiometric comparison). The selection of the proper internal standards for quantitation has been extensively discussed previously [3]. Each individual lipid extract was reconstituted with a volume of 500 μl/mg of tissue protein in 1:1 chloroform/methanol. The lipid extracts were finally flushed with nitrogen, capped, and stored at −20 °C for ESI/MS (typically analyzed within 1 week) as previously described [23].
CHO cells (American Type Culture Collection) were cultured as described previously [24]. Lipid extraction of CHO cells was similarly performed as described above by using a Bligh–Dyer procedure after protein assay of a cell pellet from 3-cm culture dish (approximately 3 × 10⁵ cells) in the presence of internal standards (5.5 nmol 14:1–14:1 dPC/mg protein, 800 pmol 17:0 lysoPC/mg protein, and 3.5 nmol N12:0 SM/mg protein).
2.3. Mass spectrometric analysis of lipids
A TSQ Quantum Ultra Plus triple-quadrupole mass spectrometer (Thermo Fisher Scientific, San Jose, CA) equipped with an automated nanospray apparatus (i.e., Nanomate HD, Advion Bioscience Ltd., Ithaca, NY) and Xcalibur system software were utilized in the study as previously described [25]. Each lipid extract solution prepared above was properly diluted to less than 50 pmol of total lipids/μl with chloroform/methanol/isopropanol (1:2:4, v/v/v) prior to infusion to the mass spectrometer. This procedure was used to guarantee that no lipid aggregation occurred during analysis and to minimize any effects of residual inorganic components carried over during lipid extraction on ion suppression and/or chemical noise [3].
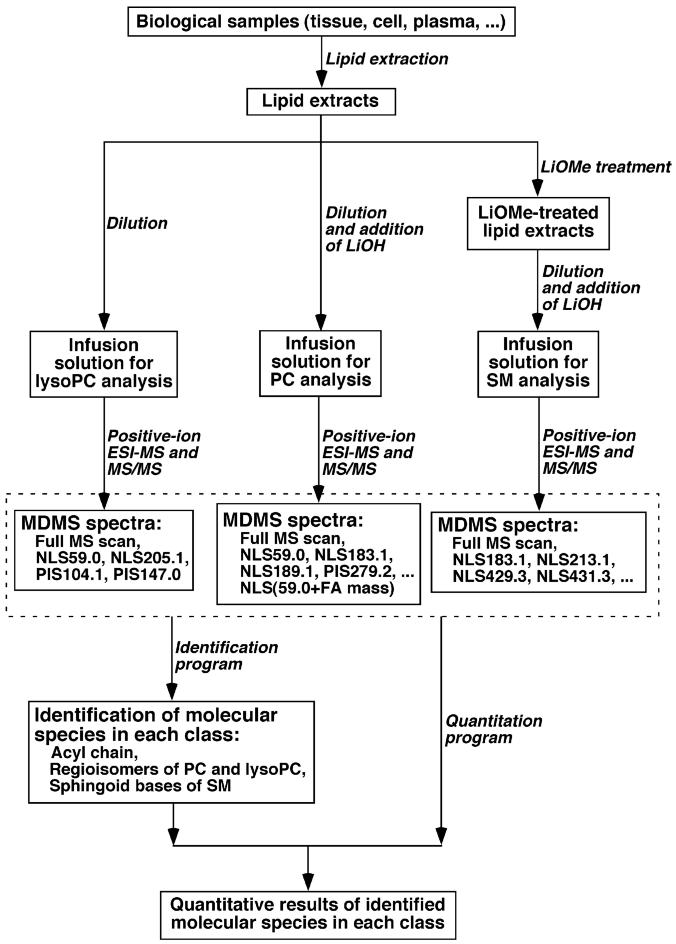
The first and third quadrupoles were used as independent mass analyzers with a mass resolution setting of 0.7 U while the second quadrupole served as a collision cell for tandem mass spectrometry. Typically, a 1-min period of signal averaging in the profile mode was employed for each mass spectrum. For tandem mass spectrometry, a collision gas pressure was set at 1.0 mTorr but the collision energy varied with the classes of lipids as described previously [3,18] or as indicated. For each MS/MS mass spectrum, a 2–5-min period of signal averaging in the profile mode was employed. All MS spectra and tandem MS spectra were automatically acquired by a customized sequence subroutine operated under Xcalibur software. A workflow of analysis of each class of choline-containing phospholipid was shown (Fig. 2). Data processing of MDMS analyses including ion peak selection, baseline correction, data transfer, peak intensity comparison, 13C de-isotoping, and quantitation were conducted using custom programmed Microsoft Excel macros as outlined previously [18] which will be published somewhere in details.
Fig. 2.
Schematic workflow for the analysis of choline-containing phospholipids.
2.4. Quantitation of choline-containing phospholipid molecular species using MDMS-SL
Identification of individual choline-containing phospholipid molecular species using MDMS-SL was presented in detail in Section 3. Quantification of the identified individual molecular species was then performed in a two-step procedure as outlined previously [17,26,27]. Specifically, we first determined whether the MDMS-SL identified ions of a class overlapped with ions from other lipid class(es). This was achieved through systematic comparison of the profiles in the full MS scans to those acquired from the analysis of one or more fragment(s) specific to the lipid class of interest by using PIS and/or NLS. To the non-overlapping and highly abundant peaks of the identified species, the one-step quantitation procedure was performed. However, to the overlapped peaks or to the peaks in low abundance, the second step quantitation procedure was performed.
The first quantitation step in the two-step procedure was performed to quantitate those identified, abundant (S/N > 10), and non-overlapping species from the full MS scan using the following formula for ratiometric comparisons:
| (1) |
where cu and ci were the contents of individual species and the selected internal standard, respectively, while Iu and Ii were the peak intensities of the species and the selected internal standard, respectively, after 13C de-isotoping.
The second step in the two-step quantitation procedure was performed to quantitate the overlapping and/or low abundance species by using the determined molecular species in the first step as standards in addition to the exogenously added internal standard. Quantitation in the second step was conducted by using one of the aforementioned NLS or PIS. For quantification of the identified PC molecular species containing polyunsaturated fatty acyl chains (i.e., each contains 4 or more double bonds), NLS183.1 was used for quantitation of those species through ratiometric comparison using the determined contents of two or more species which similarly contained polyunsaturated fatty acids from the first step. To the ether-containing PC species, NLS59.0 which enhanced the intensities of the species in these subclasses was employed for quantitation. Ether linked species were quantified through ratiometric comparison using the determined contents of two or more ether-containing species from the first step. Finally, NLS189.1 was exploited for quantitation of the other dPC molecular species which do not contain polyunsaturated FAs and which were quantitated through ratiometric comparison using the previously determined content of the same type of species plus the exogenously added internal standard. A similar quantitation procedure for lysoPC and SM was performed. For example, NLS59.0 was used for the second-step quantitation of lysoPC molecular species while PIS104.1 was employed for the correction of the enhanced lyso-pPC molecular species in NLS59.0. NLS213.1 was used for the second-step quantitation of SM species while PIS429.3, PIS431.3, etc., were employed for the determination of the relative contents of isomers containing sphingosine, sphinganine, and other sphingoid bases, respectively.
There are two extreme cases for quantitation of ether-containing or polyunsaturated FA-containing PC species in addition to the cases discussed above. In the first case, there is only one abundant, non-overlapped species present in the type of ether-containing subclasses or polyunsaturated FA-containing PC species from the first quantitation step. This single species is used to assess the levels of the other species of the type as described above through ratiometric comparison since the effects of the differential numbers of double bonds and carbons on quantitation of the other species in the same type are minimal. In the second case, there is no abundant, non-overlapped species present in the type of ether-containing subclasses or polyunsaturated FA-containing PC species. NLS59.0 and NLS183.1 can still be used for the assessment of the species containing either ether aliphatic chains or polyunsaturated FA through ratiometric comparison with the preselected internal standard. However, a pre-determined correction factor for each type of species is employed. We determined that the correction factors for quantitation of ether-containing species and polyunsaturated FA-containing dPC species by using exogenously added internal standard are 0.67 ± 0.03 and 0.61 ± 0.02, respectively. It should be emphasized that addition of an ether-containing PC species or PC species containing a polyunsaturated FA as internal standards is recommended if readily available.
Through this second step in the quantitation process, the linear dynamic range of quantitation is dramatically extended by eliminating background noise and by filtering the overlapping molecular species through a MDMS approach [3]. However, it is very important to use the most abundant molecular species determined from the first step standards for quantification of other molecular species of the class in the second step to allow accurate quantification and to minimize the potential for propagated analytic errors.
3. Results and discussion
3.1. Distinct fragmentation patterns of dPC, plasmenylcholine (pPC), and SM
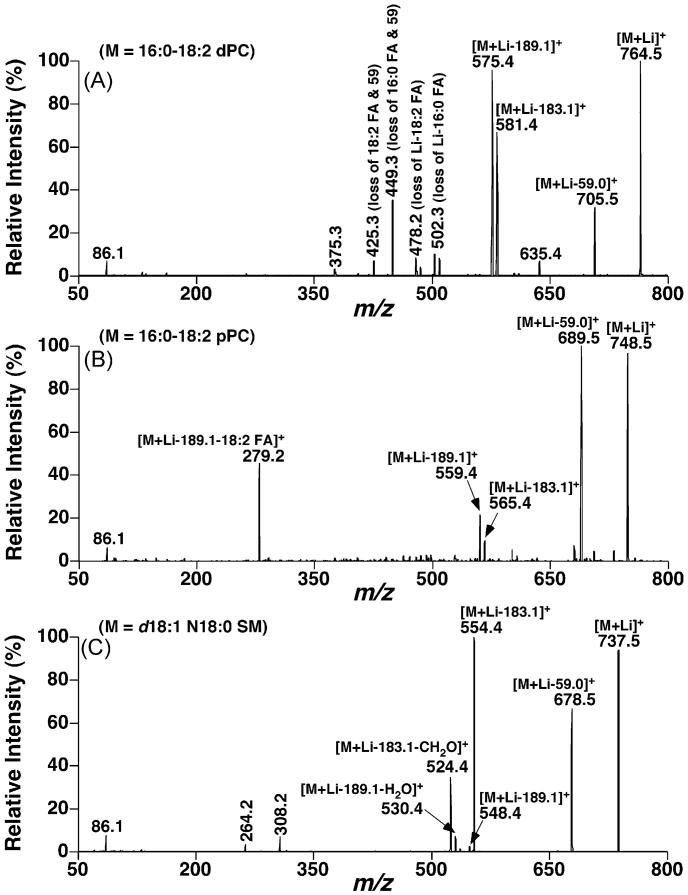
The fragmentation patterns of alkaline adducts of dPC, pPC, and SM have previously been extensively characterized [6,15,22,28]. Representative examples of product ion ESI-MS/MS spectra of these (sub)classes are displayed (Fig. 3). In general, the abundant fragment ions of the lithiated species of these (sub)classes after collision-induced dissociation (CID) are essentially identical. These include a fragment ion corresponding to the loss of trimethylamine (i.e., [M+Li – 59.0]+), an abundant ion corresponding to the loss of phosphocholine (i.e., [M+Li – 183.1]+), and a product ion corresponding to the loss of lithium cholinephosphate (i.e., [M+Li – 189.1]+). Therefore, NLS59.0, NLS183.1, and NLS189.1 have been exploited to profile PC molecular species [3], including ether-containing PC species [22].
Fig. 3.
Representative tandem ESI/MS analyses of lithiated phosphatidylcholine, plasmenylcholine, and sphingomyelin species after CID. Product ion ESI/MS analyses of lithiated 16:0–18:2 phosphatidylcholine (dPC) at m/z 764.5 (Panel A), 16:0–18:2 plasmenylcholine (pPC) at m/z 748.5 (Panel B), and d18:1 N18:0 sphingomyelin (SM) at m/z 737.5 (Panel C) in the presence of LiOH in the infusion solution were performed on a QqQ mass spectrometer as described under Section 2. Collision activation was carried out with a collision energy of 32 eV and gas pressure of 1 mTorr.
The presence of informative product ions that are unique to individual (sub)class facilitate the identification of lipid subclasses. For example, the peak intensity ratio of the ions [M+Li – 183.1]+ to [M+Li – 189.1]+ is dPC ≈ pPC < SM (Fig. 3). Previously, it has been demonstrated that the fragmentation pathways resulting in the fragment ions of [M+Li – 183.1]+ and [M+Li – 189.1]+ are very different [15,28]. The former results from a direct elimination of a five-membered cyclophosphane to form a double bond between C2 and C3 of glycerol in PC or C1–C2 of sphingoid bases in SM (Fig. 1) while the latter results from the carbonyl-assisted formation of a five- or six-membered ring between the fatty acyl carbonyl oxygen and the sn-3 glycerol carbon of PC (or C1 position in SM) (Fig. 1), respectively [15,28]. The differential propensity of both the carbonyl-assisted formation of a five- or six-membered ring is dPC > pPC > SM while the direct elimination of the five-membered cyclophosphane is similar to all the classes, which is reflected in the relative losses of the fragments with 189.1 and 183.1 U from each class.
Moreover, multiple fragment ions present in the CID mass spectra of dPC correspond to the loss of either FA or trimethylamine plus FAs from dPC species. NLS of all naturally occurring FAs has been previously exploited for identification of individual PC molecular species in MDMS-SL [18]. The facile neutral losses of FAs from TAG molecular species in comparison to those resulting from PC species might interfere with the identification of PC molecular species in some cases (see below). In the current study, NLS for loss of trimethylamine plus all naturally occurring FAs was explored to identify individual PC molecular species including regioisomers in a two-dimensional mass spectrometric format (see below).
Ion peaks corresponding to pPC molecular species can be identified based on the presence of a ratio of [M+Li – 59.0]+ vs. [M+Li – 183.1]+ ion intensities that is greater than 1 while it is <1 in other PC and SM molecular species (Fig. 3). Therefore, comparisons of the profiles present in NLS59.0 and NLS183.1 readily recognize ether-containing PC molecular species (see below). It should be pointed out that NLS of trimethylamine plus FA from ether-containing PC molecular species is not sensitive as that in diacyl PC molecular species (Fig. 3A and B). However, the identities of these ether PC molecular species can be substantiated by the presence of a unique fragment ion corresponding to a glycerol derivative linked with the ether aliphatic chain which results from the neutral loss of lithium cholinephosphate and the sn-2 fatty acid. For example, the ion at m/z 279.2 present in the product ion mass spectrum of lithiated 16:0–18:2 pPC after CID represents such a fragment ion (Fig. 3B). Therefore, PIS of these fragments allows direct identification of the ether lipid molecular species present in the pPC subclass species (see below). Finally, the presence of ions at m/z 264.2 and 308.2 defines the aliphatic chains of individual SM molecular species (Fig. 3C). The former is the fragment resulting from the backbone of the sphingoid base in SM and the latter is generated from the loss of phosphocholine and a part of the sphingoid base (i.e., neutral loss of 429.3 U). Therefore, both could be used to identify the sphingoid bases and therefore the aliphatic chains of SM species. However, the ion at m/z 308.2 is more intense than the ion at m/z 264.2 and thus in practice is more useful. Moreover, analysis of any lipid molecular species by using neutral loss scanning is always favored in comparison to using precursor ion scans as previously described [3].
3.2. Neutral loss scans of 183.1 U and 189.1 U facilitate the identification of PC molecular species containing polyunsaturated fatty acids
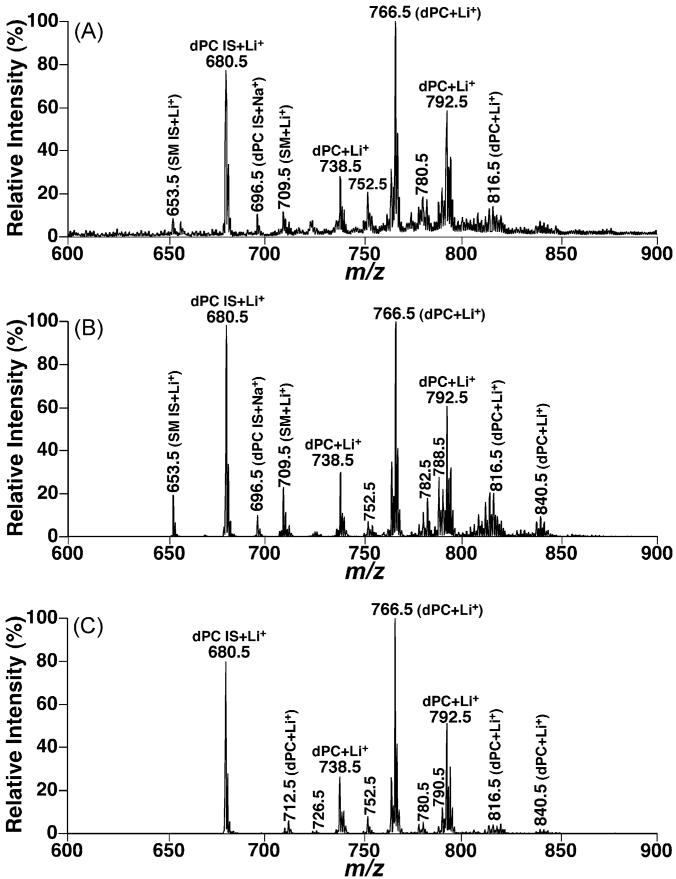
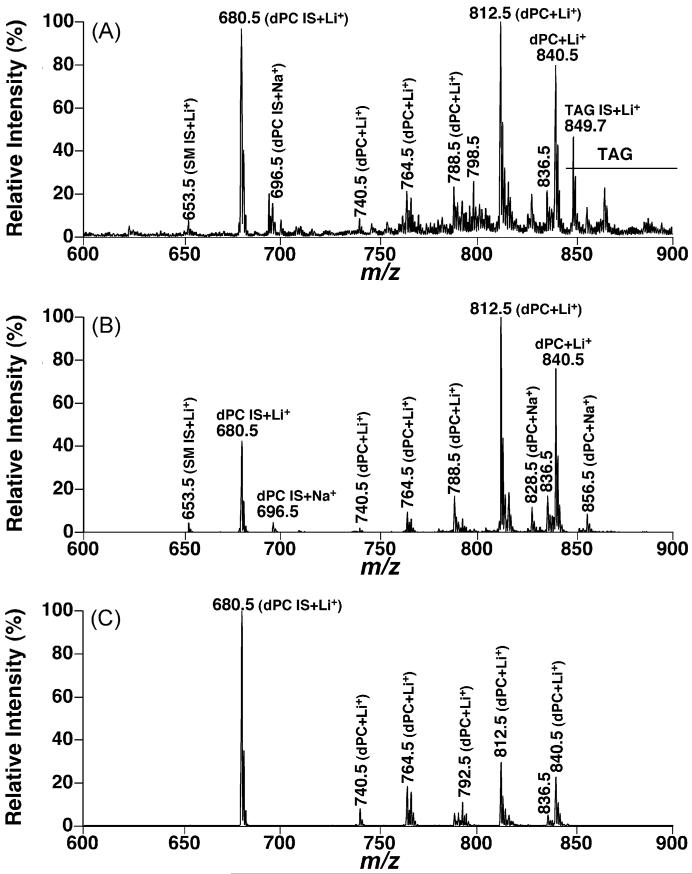
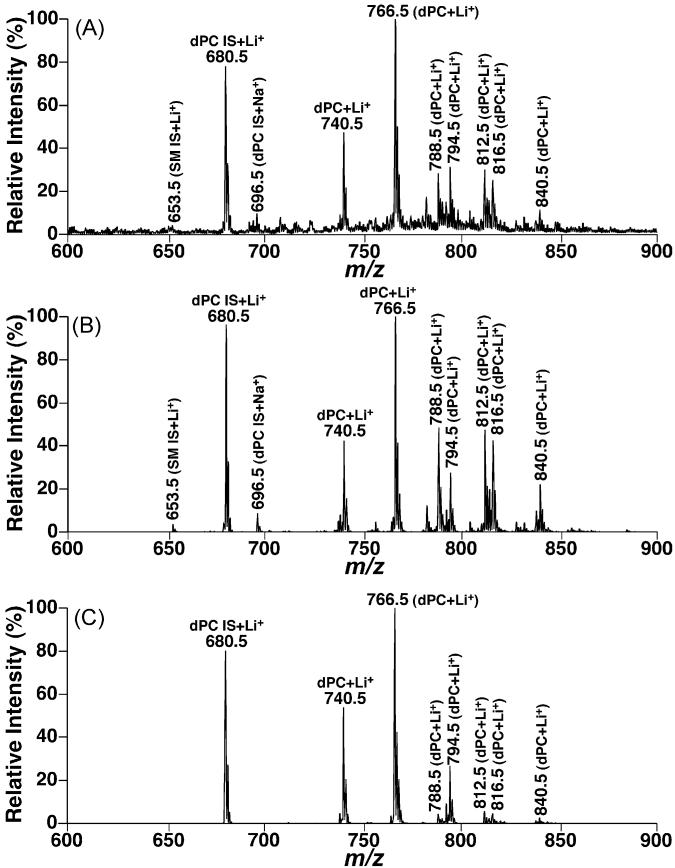
We have previously recognized that the intensity of any fragment ion after CID reflects a balance between the thermodynamic stability of the resultant fragment and the kinetics of the formation of the ion [29]. Therefore, the apparent intensities of the fragment ions in a fragmentation pattern of an individual lipid species depend on multiple factors including collision conditions (e.g., pressure and energy) and intrinsic molecular physical properties (e.g., the number of double bonds in a fatty acyl chain, the linkage of a fatty acyl chain and/or a head group to the backbone, etc.). In turn, any profile acquired by NLS or PIS would depend on these parameters, which was well exemplified from the PC molecular species containing polyunsaturated fatty acyl chains of lipid extracts from the CHO cell pellets, mouse cortex, and mouse myocardium acquired using NLS183.1 and NLS189.1 in the positive-ion mode in the presence of a small amount of LiOH (Figs. 4-6).
Fig. 4.
Comparisons between the molecular species profiles of choline glycerophospholipids in the lipid extracts of CHO cells acquired in the full MS scan mode and neutral loss mode. Lipid extracts of CHO cells were prepared by using a Bligh–Dyer extraction procedure as described under Section 2. Each individual lipid extract was diluted to a lipid concentration of <50 pmol total lipids/μl. A small amount of LiOH (25 pmol LiOH/μl) was added to the diluted solution. A positive-ion ESI mass spectrum in the full MS scan mode was acquired in the mass range from m/z 600 to 900 from the diluted lipid extract of CHO cells (Panel A). Neutral loss scans of 183.1 U (i.e., phosphocholine) (Panel B) and 189.1 U (i.e., lithium cholinephosphate) (Panel C) as indicated were also acquired from the diluted lipid extract in the mass range with a collision energy of 35 eV. IS denotes internal standards; SM stands for sphingomyelin; and dPC abbreviates diacyl phosphatidylcholine.
Fig. 6.
Comparisons between the molecular species profiles of choline glycerophospholipids in the lipid extracts of mouse myocardium acquired in the full MS scan mode and neutral loss mode. Lipid extracts of mouse myocardium were prepared by using a Bligh–Dyer extraction procedure as described under Section 2. See the legend of Fig. 4 for other details.
It had been demonstrated that quantitative analyses of individual molecular species of a polar lipid class of interest in comparison to a selected internal standard can be achieved in the full MS scan mode after direct infusion of a diluted lipid solution and correction for 13C isotopic distribution differences between the internal standard and the analytes [8,17]. Therefore, the differential lipid profiles acquired through the discrete fragmentation pathways could be directly compared to the full MS scan or compared between individual pathways. From the comparisons of the full MS scan, NLS183.1, and NLS189.1 from lipid extracts of a cell model, mouse cortex, and mouse myocardium (Figs. 4-6), the following three conclusions can be drawn:
First, NLS189.1 predominantly showed the lithium adducts of PC molecular species without any sodiated PC peaks and with minimal intensities of lithiated SM species as discussed above. Therefore, NLS189.1 is very useful for identification of individual PC molecular species. In contrast, NLS183.1 carried the sodiated PC peaks in addition to the lithium adducts of PC molecular species. For example, an ion at m/z 696.5, corresponding to sodiated 14:1–14:1 dPC from the selected internal standard, was present in all NLS183.1 (Figs. 4B, 5B, and 6B). In addition, lithiated SM molecular species were also proportionally present in NLS183.1 relative to the lithiated PC species. The presence of lithiated SM species in NLS183.1 and their absence in NLS189.1 were further explored below.
Fig. 5.
Comparisons between the molecular species profiles of choline glycerophospholipids in the lipid extracts of mouse cortices acquired in the full MS scan mode and neutral loss mode. Lipid extracts of mouse cortices were prepared by using a Bligh–Dyer extraction procedure as described under Section 2. See the legend of Fig. 4 for other details.
Second, the profile of lithiated PC molecular species containing no polyunsaturated acyl chains in NLS189.1 was essentially identical to that displayed in the full MS scan while the intensities of those containing polyunsaturated acyl chains were markedly reduced in NLS189.1 in comparison to that in the full MS scan. For example, the most abundant PC species containing polyunsaturated acyl chains correspond to the ion at m/z 788.5 (16:0–20:4 dPC) and those over m/z 800. The full MS scan of lipid extracts from CHO cells acquired in the presence of LiOH displayed minor ion peaks at m/z 788.5 and over m/z 800, indicating the PC molecular species in lipid extracts of CHO cells did not contain abundant species containing polyunsaturated fatty acyl chains. Therefore, NLS189.1 showed an essentially identical profile to that in the full MS scan regarding to lithiated PC species (Fig. 4C compared to Fig. 4A). The majority of the mouse cortex PC species did not contain polyunsaturated acyl chains. NLS189.1 of lithiated PC molecular species of mouse cortex (Fig. 5C) was very similar to that obtained from the full MS scan (Fig. 5A) except for the peaks at m/z 788.5 (i.e., 16:0–20:4 dPC) and those over m/z 800. In contrast to the PC species in mouse cortex, PC molecular species containing polyunsaturated acyl chains (i.e., lithiated peaks over m/z 800 in full MS scan (Fig. 6A)) were predominant in mouse myocardial lipid extracts. NLS189.1 of mouse myocardial lipid extracts showed markedly reduced ion peaks except for the peaks at m/z 740.5, 764.5 and 792.5 which were the PC molecular species containing no polyunsaturated fatty acyl chains (Fig. 6C). This likely results from the reduced nucleophilic propensity of carbonyl present in the polyunsaturated fatty acyl chains as a result of the reduced electron density due to the present multiple double bonds in the polyunsaturated acyl chains since a nucleophilic attack by the carbonyl oxygen to the C3 position of glycerol is apparently essential to form the fragment ion corresponding to the neutral loss of 189.1 U [15,28].
Finally, in contrast to the case in NLS189.1, the lithiated PC molecular species containing polyunsaturated fatty acyl chains showed enhanced peak intensities relative to that of the selected internal standard in NLS183.1 (Figs. 4B, 5B, and 6B). Two possibilities could explain this observation based on the facts that the majority of the polyunsaturated FA chains are acylated at the sn-2 position of glycerol in phospholipids and the neutral loss of 183.1 U results from the elimination of the proton at the sn-2 position of glycerol to form a double bond between C2 and C3 (Fig. 1). Accordingly, the configuration of a polyunsaturated FA chain might be able to stabilize the formed ester containing a vinyl ether linkage instead of the typical alcohol moiety. Alternatively, a polyunsaturated FA chain is likely more favored to an activated rearrangement during the proton elimination through stabilization of the generated intermediate with multiple double bonds of polyunsaturated FA chain than a saturated FA chain.
These results demonstrate that lithiated PC molecular species profiled by NLS183.1 or NLS189.1 significantly depend on the presence of polyunsaturated FA chains in PC molecular species. Therefore, properly selecting standards to represent the variation of the polyunsaturation in FA chains during quantitation of PC molecular species with these tandem mass spectrometric analyses is critical. Moreover, it is also suggested that any methodology based on tandem mass spectrometric analysis for direct quantification of individual lipid molecular species should be done cautiously with inclusion of multiple internal standards to cover the variation of the physical properties of individual species in the samples under study. In MDMS-SL, a two-step approach for quantification of individual molecular species to resolve this issue has been developed [19] and outlined in Section 2.
3.3. Identification of diacyl PC molecular species including regioisomers by using neutral loss scans of fatty acids plus trimethylamine
Complete identification of lipid molecular species of a class of interest should include the identification of the class, the subclass, the aliphatic chains, and the regiospecificity of the aliphatic chains. Analyses of ion peaks from NLS59.0, NLS183.1, and NLS189.1 allowed identification of the species belonging to the PC class and the species possessing different linkage of an aliphatic chain at the sn-1 position of glycerol (i.e., the subclass). The presence of SM species in these neutral loss scans may affect the identification of PC molecular species. A neutral loss scan of 213.1 U (corresponding to lithium cholinephosphate plus methyl aldehyde) which is specific to SM species can be used to recognize the SM species (see Section 3).
Next, we further explored the use of positive-ion ESI tandem mass spectrometry for the identification of the aliphatic chains and the regiospecificity of those profiled PC molecular species. For this purpose, neutral loss scans of fatty acids, lithium fatty acyl carboxylates, or trimethylamine (59.0 U) plus fatty acids from lithiated PC molecular species were examined since previous studies have demonstrated that the fragment ions corresponding to these losses are present in the product ion analysis after CID (Fig. 3) [28].
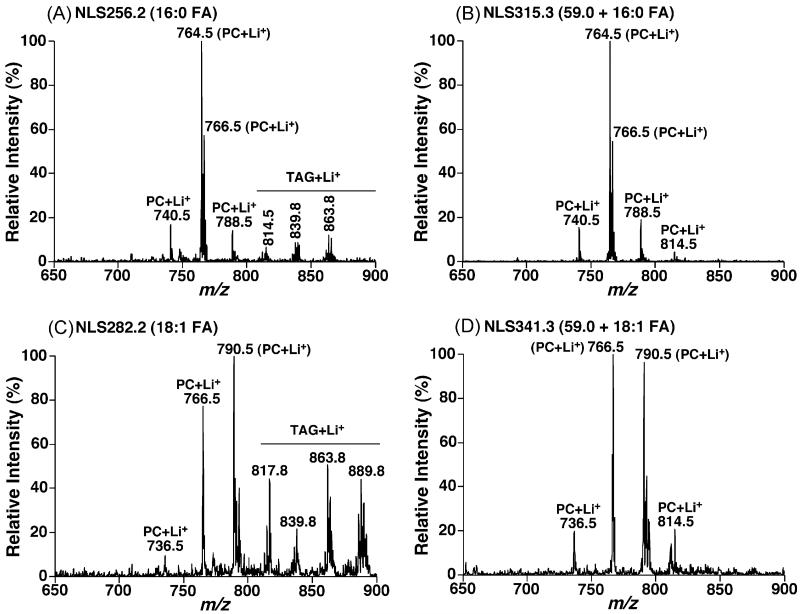
Similar to the previous studies of PC molecular species [18], NLS of naturally occurring fatty acids from lithiated PC molecular species to identify the fatty acyl constituents and their positions showed some apparent limitations. First, the sensitivity of NLS of fatty acids was not so high that the background noise might induce a certain degree of artifact (Fig. 7A and C). Second, the facile neutral loss of fatty acids from lithiated TAG molecular species in comparison to lithiated PC species [30] present in the NLS of naturally occurring fatty acids (Fig. 7A and C) became predominant when a certain amount of TAG species was present in a lipid extract, even an amount much lower than the PC content, and interfered with the identification of the PC molecular species [18]. Third, the difference between peak intensities of ions from neutral loss of fatty acids from the sn-1 and sn-2 positions of glycerol was smaller in comparison to the difference between those from NLS (59.0 + FA mass) (Fig. 3A). Similar conclusions were also drawn from neutral loss scans of lithium fatty acyl carboxylates.
Fig. 7.
Comparisons of mass spectra acquired from neutral loss scans of a fatty acid or a fatty acid plus trimethylamine from lipid extracts of rabbit myocardium. Lipid extracts of rabbit myocardium were prepared by using a Bligh–Dyer extraction procedure as described under Section 2. Each individual lipid extract was diluted to a lipid concentration of <50 pmol total lipids/μl. A small amount of LiOH (25 pmol LiOH/μl) was added to the diluted solution. Neutral loss scans of the mass of a fatty acid with an optimal collision energy of 28 eV or the mass of a fatty acid plus trimethylamine with an optimal collision energy of 40 eV as indicated were acquired from the diluted lipid extract in the mass range from m/z 650 to m/z 900. All scans were displayed after normalization to the most abundant peak in each individual scan. PC stands for choline glycerophospholipid.
Accordingly, we explored the utilization of NLS (59.0 + FA mass) in identification of fatty acyl constituents of PC species and the regioisomers of the acyl chains. We found that the ions resulting from NLS (59.0 + FA mass) were more intense than those determined using NLS (FA mass) or NLS (Li-FA mass) under the experimental conditions optimized for each scan (Fig. 7). Therefore, structural analysis using NLS (59.0 + FA mass) was more sensitive and accurate than using NLS (FA mass) (Fig. 7) or NLS (Li-FA mass). Moreover, the ion intensities determined using NLS (59.0 + FA mass) possessed information about the regiospecificity of the fatty acyl chains. It was found that the ion intensities using NLS (59.0 + sn-1 FA mass) were greater than those using NLS (59.0 + sn-2 FA mass). This result stands in consistent with that obtained from either NLS (FA mass) or NLS (Li-FA mass) analysis (Fig. 3A) and with that observed from the product ion analysis of lithiated PC species as previously demonstrated [28]. The difference of the peak intensity ratio determined using NLS (59.0 + FA mass) was larger than that obtained using NLS (FA mass) or NLS (Li-FA mass). This facilitates determination of the regiospecificity of fatty acyl chains with a higher accuracy. Finally, NLS (59.0 + FA mass) did not show any ions from lithiated TAG molecular species (Fig. 7). It should be pointed out that there existed some non-specific ion peaks in NLS of high mass, such as the mass corresponding to 22:6 FA, which do not interfere with the identification of PC molecular species by using MDMS-SL.
3.4. MDMS-SL identification of lithiated PC molecular species including regioisomers present in lipid extracts of rabbit myocardium
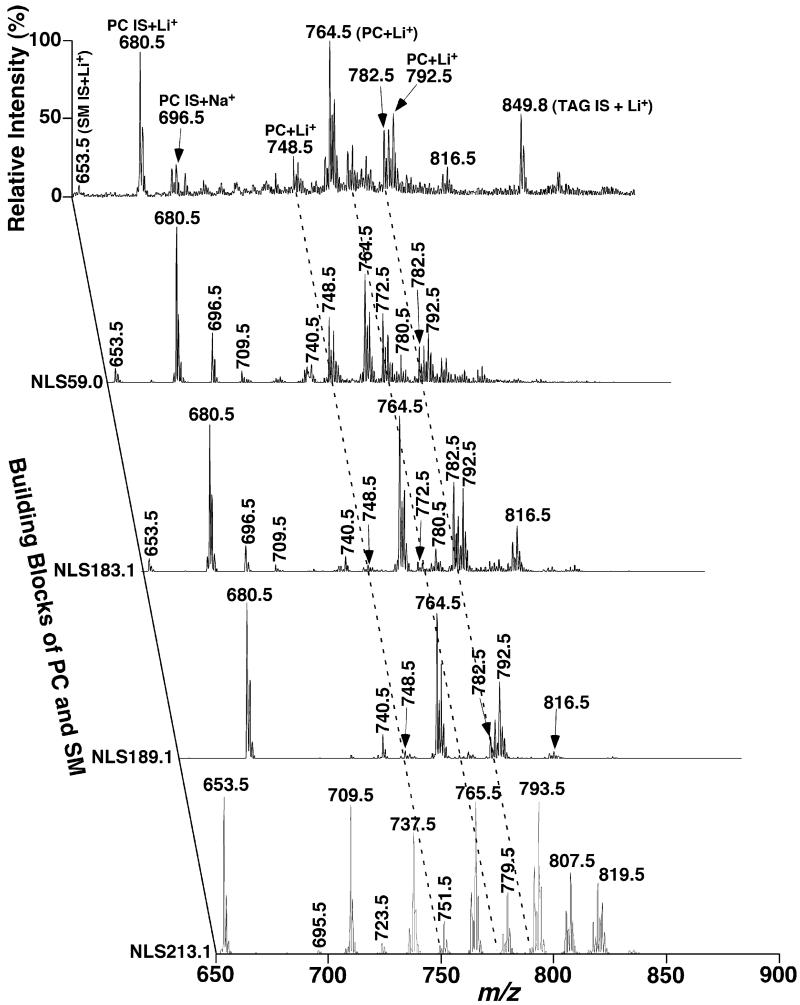
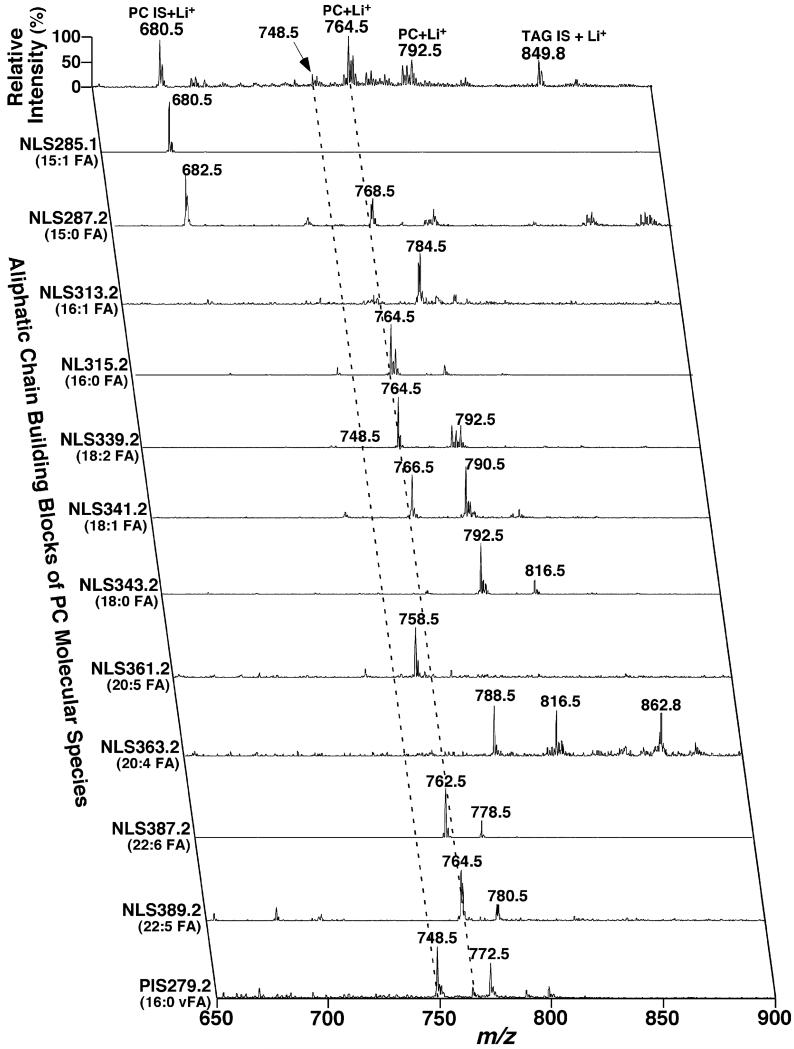
As an example, we present here the identification of PC molecular species in lipid extracts of rabbit myocardium in the presence of LiOH (Figs. 2, 8 and 9). The full MS scan (i.e., the top scan of the 2D mass spectra) for the analysis of PC species which are generally present in the mass region of m/z 650–900 was acquired in the positive-ion mode since individual PC species could be selectively ionized in this mode in the presence of LiOH (i.e., intrasource separation) as previously described [2,3]. This full MS scan was very useful in quantitative analysis of PC molecular species (see Section 2). For clear demonstration, the identification of PC species including class, subclass, and molecular species by head group and by aliphatic chains is separately displayed (Figs. 8 and 9).
Fig. 8.
Representative two-dimensional mass spectrometric analyses of head groups of choline-containing phospholipid molecular species in lipid extracts of rabbit myocardium in the positive-ion mode in the presence of LiOH. Rabbit myocardial lipid extracts were prepared by using a Bligh–Dyer extraction procedure as described under Section 2. Each individual lipid extract was diluted to a lipid concentration of <50 pmol total lipids/μl. A small amount of LiOH (25 pmol LiOH/μl) was added to the diluted solution. A positive-ion ESI mass spectrum in the full MS scan mode was acquired in the mass range from m/z 650 to 900 from the diluted lipid extract of rabbit myocardium. Neutral loss scans of 59.0 U (i.e., trimethylamine) with a collision energy (CE) of 24 eV, 183.1 U (i.e., phosphocholine, CE 35 eV), 189.1 U (i.e., lithium cholinephosphate, CE 35 eV), and 213.1 U (i.e., lithium cholinephosphate plus methyl aldehyde, CE 52 eV) as indicated were also acquired from the diluted lipid extract in the mass range. All scans were displayed after normalization to the most abundant peak in each individual scan. IS denotes internal standards; SM stands for sphingomyelin; and PC abbreviates choline glycerophospholipid.
Fig. 9.
Representative two-dimensional mass spectrometric analyses of fatty acyl chains of PC molecular species in lipid extracts of rabbit myocardium in the positive-ion mode in the presence of LiOH. Rabbit myocardial lipid extracts were prepared by using a Bligh–Dyer extraction procedure as described under Section 2. The lipid extract was diluted to a lipid concentration of <50 pmol total lipids/μl. A small amount of LiOH (25 pmol LiOH/μl) was added to the diluted solution. Positive-ion ESI mass spectrum in the full MS scan mode was acquired in the mass range from m/z 650 to 900 from the diluted lipid extract of rabbit myocardium. Neutral loss scans of (the mass of a fatty acid + 59.0) U as indicated with a collision energy of 40 eV were also acquired from the diluted lipid extract in the mass range. All scans were displayed after normalization to the most abundant peak in each individual scan. IS denotes internal standards; SM stands for sphingomyelin; PC abbreviates choline glycerophospholipid; and vFA represents the vinyl ether-containing constituent.
NLS of 59.0, 183.1, 189.1, and 213.1 U of the lipid extracts as indicated in Fig. 8 allowed identification of the ion peaks in the full MS scan belonging to the PC class, the SM class, and the choline subclasses, as well as the alkaline ions adducts as discussed previously [3,22] and above. NLS189.1 specifically identified all the PC molecular species present in the lipid extracts while SM species were specifically “isolated” by NLS213.1. NLS183.1 in comparison to NLS189.1 (see Section 3) demonstrated the polyunsaturated PC molecular species. The enhanced ion peaks relative to the internal standard present in NLS59.0 in comparison to either NLS183.1 or NLS189.1 or both represented the ether-linked PC molecular species (Fig. 8). For example, the ion clusters at m/z 748.5 and 772.5 as indicated with the broken lines at the left showed the increased ion intensities in NLS59.0 in comparisons to the other scans, representing the ether-linked nature of these molecular ions. To distinguish aPC and pPC molecular species, analyses of the fragments corresponding to the ether-linked aliphatic chains were performed, which were also used to identify the alkenyl chains of pPC species as described above. Alternatively, re-acquisition of NLS of 59.0, 183.1, and 189.1 U from a lipid solution after treatment of the diluted lipid extract with weak acid or acid vapor as previously described [31] was performed.
NLS of trimethylamine plus all naturally occurring FAs was performed for identification of the aliphatic constituents as well as the regiospecificity of the FA chains in dPC species (Fig. 9). For example it was demonstrated that the ion at m/z 764.5 appeared in NLS315.2 and NLS339.2 (Fig. 9), corresponding to the losses of 16:0 FA and 18:2 FA in addition to the loss of trimethylamine. Since counts corresponding to this ion in NLS315.2 were markedly higher than those present in NLS339.2, this ion was identified as 16:0–18:2 dPC although the presence of a small amount of 18:2–16:0 dPC was also very likely consistent with results demonstrated previously [31]. By using two-dimensional mass spectrometric analysis (Figs. 8 and 9), 46 PC molecular species were identified from lipid extracts of rabbit myocardium. Again, their regioisomers in low abundance are likely also present as discussed previously [31]. The levels of these identified PC molecular species were determined as described in Section2 and tabulated in Table 1.
Table 1.
The content of the individual choline glycerophospholipid molecular species in lipid extracts of rabbit myocardiuma
| Molecular species | [PC+Li]+ | Content |
|---|---|---|
| a16:0–16:0 | 726.6 | 0.16 ± 0.01 |
| d14:1–18:1 (57%)/d14:0–18:2 (41%)/d16:1–16:1 (2%) |
736.6 | 0.03 ± 0.01 |
| d16:0–16:1 (88%)/d14:0–18:1 (12%)/d14:1–18:0 (trace) |
738.6 | 0.12 ± 0.01 |
| d16:0–16:0 | 740.6 | 1.17 ± 0.05 |
| p16:0–18:2 | 748.6 | 2.25 ± 0.08 |
| p16:0–18:1 (30%)/a16:0–18:2 (70%) | 750.6 | 1.53 ± 0.06 |
| a16:0–18:1 | 752.6 | 0.40 ± 0.02 |
| d16:1–18:2 | 762.6 | 0.23 ± 0.01 |
| d16:0–18:2 (99%)/d16:1–18:1 (1%) | 764.6 | 7.40 ± 0.28 |
| d16:0–18:1 | 766.6 | 4.19 ± 0.18 |
| d16:0–18:0 | 768.6 | 0.18 ± 0.01 |
| p16:0–20:4 | 772.6 | 2.38 ± 0.10 |
| p16:0–20:3 (15%)/a16:0–20:4 (85%) | 774.6 | 1.41 ± 0.06 |
| p18:1–18:1 | 776.6 | 0.49 ± 0.03 |
| p18:0–18:1 | 778.6 | 0.31 ± 0.02 |
| p18:0–18:0 | 780.7 | 0.90 ± 0.06 |
| d16:0–20:5 | 786.6 | 0.07 ± 0.01 |
| d16:0–20:4 (67%)/d18:2–18:2 (32%)/d16:1–20:3 (1%)/d14:0–22:4 (trace) |
788.6 | 3.02 ± 0.18 |
| d18:1–18:2 (91%)/d16:0–20:3 (9%) | 790.6 | 1.88 ± 0.15 |
| d18:0–18:2 (89%)/d18:1–18:1 (11%) | 792.6 | 3.82 ± 0.21 |
| d18:0–18:1 | 794.6 | 0.62 ± 0.04 |
| p18:0–20:4 | 800.6 | 0.76 ± 0.05 |
| d18:2–20:4 (90%)/d16:0–22:6 (10%) | 812.6 | 0.28 ± 0.02 |
| d16:0–22:5 (49%)/d18:1–20:4 (48%)/d16:1–22:4 (3%)/d18:2–20:3 (trace) |
814.6 | 0.98 ± 0.06 |
| d18:0–20:4 (86%)/d16:0–22:4 (12%)/d18:1–20:3 (2%) |
816.6 | 1.48 ± 0.09 |
| d18:0–20:3 | 818.6 | 0.09 ± 0.01 |
| d18:0–22:5 (95%)/d18:1–22:4 (5%) | 842.6 | 0.20 ± 0.01 |
| Total | 36.36 ± 1.56 |
Total lipids of each biological sample were extracted by using a modified Bligh and Dyer method as described under Section 2. Individual PC molecular species were identified by MDMS-SL analysis. Quantification of the identified PC molecular species was performed by a two-step procedure as described under Section 2. The content in nmol/mg of protein represents the mean ± S.D. of 3 animals. The prefixes of “a”, “d”, and “p” denote plasmanylcholine, phosphatidylcholine, and plasmenylcholine species, respectively. The percentages in parentheses indicate the molar ratios of individual isomers.
3.5. MDMS-SL identification of lysoPC molecular species including regioisomers present in lipid extracts of rabbit myocardium
The fragmentation patterns of alkaline adducts of lysoPC molecular species have been well characterized [21,22,32]. The fragmentation patterns of sodiated lysoPC species after CID contain multiple abundant and informative fragments. These fragments include the ones corresponding to the losses of trimethylamine (i.e., [M+Na – 59.0]+) and sodium cholinephosphate (i.e., [M+Na – 205.1]+) as well as the ions corresponding to choline (i.e., m/z 104.1) and sodiated five-membered cyclophosphane (i.e., m/z 147.0) [21]. Accordingly, these ions were used for identification of individual lysoPC molecular species including the location of the aliphatic chain. Although the fragmentation patterns of lithiated lysoPC species after CID also displayed multiple abundant and informative fragment ions [21], identification of the regiospecificity of individual lysoPC species was not as straightforward as that from sodiated lysoPC species.
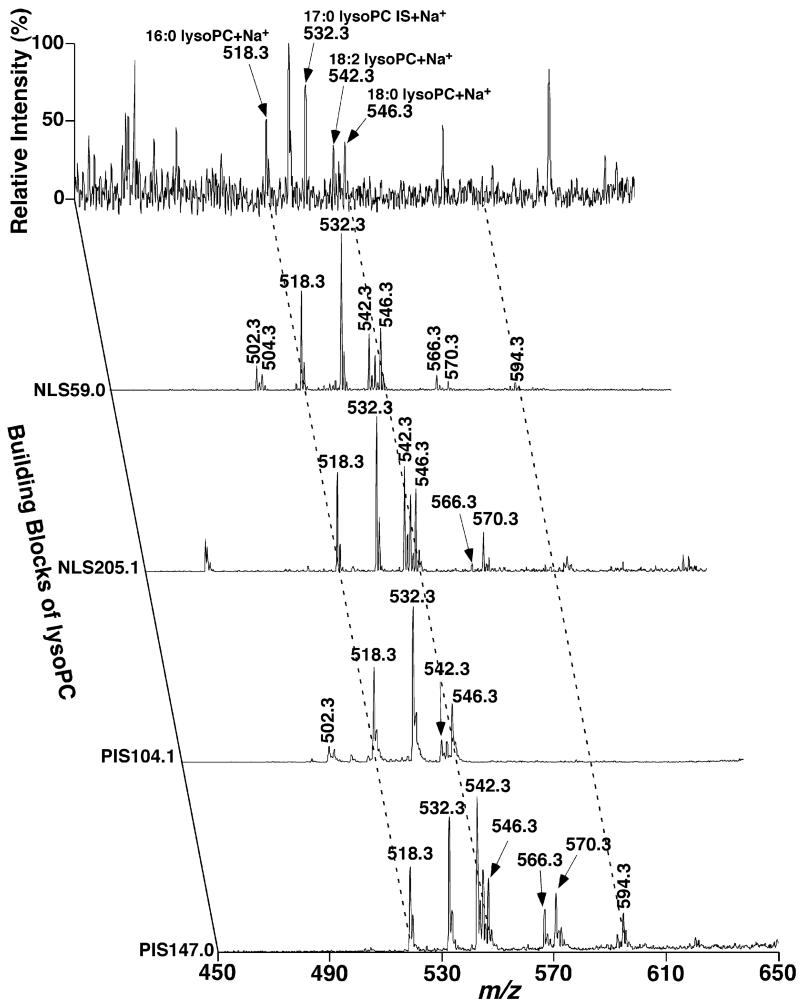
An example of identification of individual lysoPC molecular species present in lipid extracts of rabbit myocardium using MDMS-SL was given (Fig. 10). The two-dimensional mass spectrum for identification of lysoPC species was constructed with five scans in the positive-ion mode acquired in the mass region of m/z 450–600 after infusion of a diluted lipid extract of rabbit myocardium without addition of LiOH (Figs. 2 and 10). This number of scans represented the minimal number of scans necessary for identification and quantitation of the species in the class. These scans included a full MS scan, NLS59.0, NLS205.1, PIS104.1, and PIS147.0. NLS59.0 was used to “filter” the low abundant lysoPC molecular species in this region and identify the fatty aliphatic chains in these “isolated” species [3,22]. LysoPC molecular species were further confirmed by NLS205.1 which is specific to sodiated lysoPC species in this mass region. Significant changes of an intensity ratio of a lysoPC species to the selected internal standard in NLS59.0 in comparison to that of the counterpart in NLS205.1 identified the species as an ether-linked lysoPC species as discussed above in parallel analyses of PC molecular species. For example, the intensities of both ions at m/z 502.3 and 504.3 were markedly reduced in NLS205.1 relative to those in NLS59.0, indicating that these ions were ether-containing lysoPC species. The aliphatic chains of these identified lysoPC species were directly derived from their m/z. Finally, the intensity ratio of ions at m/z 104.1 and 147.0 (which could be determined from PIS104.1 and PIS147.0 of each species) has previously been recognized as a criterion for identification of the regiospecificity of lysoPC species [21]. We further confirmed this criterion with a ratio of 3.5 for the sn-1 acyl species and of 1/8.0 for sn-2 acyl species under the experimental conditions. From the 2D MS analysis (Fig. 10), we identified 19 lysoPC molecular species in lipid extracts of rabbit myocardium after discriminating the regioisomers (Table 2).
Fig. 10.
Representative two-dimensional mass spectrometric analyses of lysoPC molecular species in lipid extracts of rabbit myocardium in the positive-ion mode in the absence of LiOH. A full MS scan spectrum in the mass range from m/z 450 to 650 first was acquired from a diluted lipid extract of rabbit myocardium in the positive-ion mode. Neutral loss scan (NLS) of 59.0 U (i.e., trimethylamine) with a collision energy (CE) of 22 eV or 205.1 U (i.e., sodium cholinephosphate, CE 34 eV) and precursor-ion scan (PIS) of m/z 104.1 (i.e., choline, CE 34 eV) or m/z 147.0 (i.e., sodiated five-membered cyclophosphane, CE 34 eV) were also acquired from the diluted lipid extract of rabbit myocardium in the positive-ion mode as described under Section 2. All scans were displayed after normalization to the most abundant peak in each individual scan.
Table 2.
The content of the individual lyso choline glycerophospholipid molecular species in lipid extracts of rabbit myocardiuma
| Molecular species | [lysoPC+Na]+ | Content | sn-1 acyl lysoPC | sn-2 acyl lysoPC |
|---|---|---|---|---|
| p16:0 | 502.3 | 17.19 ± 1.03 | 17.19 | 0.00 |
| a16:0 | 504.3 | 16.46 ± 1.15 | 16.46 | 0.00 |
| 16:1 | 516.3 | 2.51 ± 0.23 | 2.51 | 0.00 |
| 16:0 | 518.3 | 125.53 ± 5.02 | 125.53 | 0.00 |
| 18:2 | 542.3 | 72.30 ± 3.98 | 7.32 | 64.98 |
| 18:1 | 544.3 | 42.16 ± 2.53 | 9.55 | 32.61 |
| 18:0 | 546.4 | 79.47 ± 4.77 | 59.17 | 20.31 |
| 20:4 | 566.3 | 20.02 ± 1.18 | 0.00 | 20.02 |
| 20:3 | 568.3 | 2.07 ± 0.18 | 0.14 | 1.93 |
| 20:2 | 570.4 | 12.22 ± 0.85 | 0.00 | 12.22 |
| 22:6 | 590.3 | 2.63 ± 0.24 | 0.92 | 1.71 |
| 22:5 | 592.3 | 6.06 ± 0.54 | 0.15 | 5.90 |
| 22:4 | 594.4 | 9.78 ± 0.78 | 0.00 | 9.78 |
| Total | 408.42 ± 23.69 | 238.96 | 169.46 |
Total lipids of each biological sample were extracted by using a modified Bligh and Dyer method as described under Section 2. MDMS-SL analysis was performed by combination of a full MS scan and four tandem MS scans (i.e., NLS59.0, NLS205.1, PIS104.1 and PIS147.0) which represented the building blocks of individual lysoPC molecular species. Data in pmol/mg of protein represent the means ± S.D. of 3 animals. The prefixes of “a” and “p” denote lysoplasmanylcholine and lysoplasmenylcholine species, respectively.
3.6. MDMS-SL identification of SM molecular species present in lipid extracts of rabbit myocardium
Extensive characterization of purified SM species has recently been described [33]. Essentially, individual SM molecular species can be defined by the analysis of building blocks corresponding to their head group and either the backbones of sphingoid bases or the acyl amide chains. The other constituents in the structure of individual SM species can be derived from the m/z. The ion corresponding to the loss of phosphocholine plus methyl aldehyde after CID (i.e., NLS213.1) is specific to SM molecular species (see Section 3 and Fig. 3C). This ion has been used in the spectrometric resolution of all SM molecular species present in lipid extracts with high sensitivity. The neutral loss of phosphocholine after CID (i.e., NLS183.1) further supports the presence of sphingomyelin species. The aliphatic moieties of individual SM molecular species were readily identified by using the neutral loss of phosphocholine and the sphingoid bases as described above.
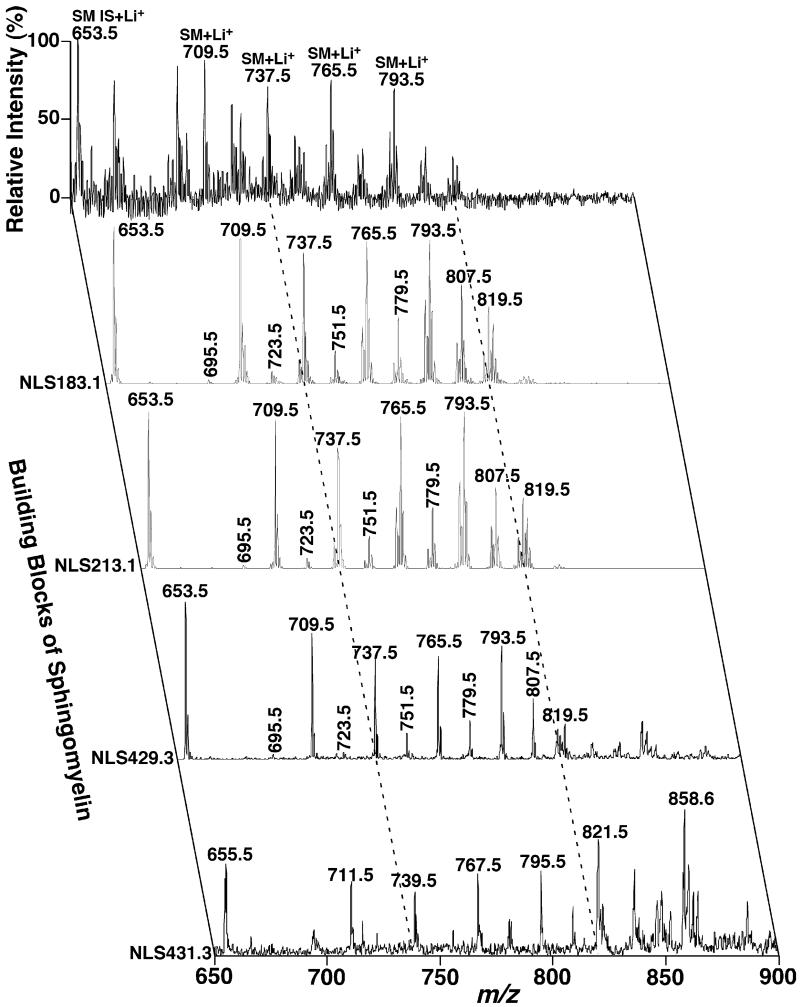
Recently, we have also developed an approach for analysis of sphingolipid molecular species after LiOMe-treated and solvent partition based on the shotgun lipidomics platform [20]. Therefore, the MDMS-SL analysis of SM molecular species present in a biological lipid extract can be achieved by two-dimensional mass spectrometric analysis of LiOMe-treated lipid solution. Specifically, the 2D MS analysis of SM species included a full MS scan in the positive-ion mode acquired in the mass range between m/z 650 and 900 after direct infusion of a diluted, alkaline-treated rabbit myocardial lipid extract in the presence of a small amount of LiOH (the top scan in Fig. 11) (Fig. 2). From the identical infusion solution and in the same mass range, NLS183.1 and NLS213.1 as indicated mass spectrometrically “resolved” all the SM molecular species present in the alkaline-treated lipid extracts (Fig. 11). NLS429.3 and NLS431.3 as well as other NLS corresponding to the potential sphingoid bases (not shown) identified the aliphatic constituents of individual SM molecular species. It should be emphasized that the ion peaks shown in NLS431.3 carried the M+2 13C isotopologues of the ions present in NLS429.3. Therefore, the relative abundance of the covalent entities in these discrete sphingoid bases characterized by NLS431.3 (i.e., sphinganine) should be deduced after correction for 13C isotope distribution from NLS429.3. From the 2D MS analysis (Fig. 11), we identified 37 SM molecular species in lipid extracts of rabbit myocardium. The levels of these SM molecular species were also determined and tabulated in Table 3.
Fig. 11.
Representative two-dimensional mass spectrometric analyses of sphingomyelin molecular species in the alkaline-treated lipid extracts of rabbit myocardium in the positive-ion mode in the presence of LiOH. Rabbit myocardial lipid extracts were prepared by using a Bligh–Dyer extraction procedure as described under Section 2. A part of each lipid extract was treated with LiOMe as described previously [20] and the residual lipid extract was reconstituted with 50 μl of 1:1 CHCl3/MeOH per mg of original tissue protein. Each of the reconstituted lipid extracts was diluted 10 times prior to addition of a small amount of LiOH (10 pmol LiOH/μl). Positive-ion ESI mass spectrum in the full MS scan mode was acquired in the mass range from m/z 650 to 900 from the diluted lipid extract of rabbit myocardium. Neutral loss scans (NLS; CE 50 eV) as indicated were also acquired from the diluted lipid extract in the mass range. All scans were displayed after normalization to the most abundant peak in each individual scan. IS denotes internal standards and SM stands for sphingomyelin.
Table 3.
The content of the individual sphingomyelin molecular species in lipid extracts of rabbit myocardiuma
| Molecular species | [SM+Li]+ | Content |
|---|---|---|
| d18:1 N14:0 | 681.6 | 0.80 ± 0.05 |
| d18:0 N15:1 | 695.6 | 22.37 ± 1.58 |
| d18:1 N16:1 | 707.6 | 32.59 ± 2.28 |
| d18:1 N16:0 (99%)/d18:0 N16:1 (1%) | 709.6 | 891.01 ± 18.22 |
| d18:1 N17:0 | 723.6 | 74.61 ± 4.52 |
| d18:0 N17:0 | 725.6 | 1.23 ± 0.08 |
| d18:1 N18:1 | 735.6 | 157.26 ± 9.41 |
| d18:1 N18:0 (99%)/d18:0 N18:1 (1%) | 737.6 | 637.92 ± 19.12 |
| d18:0 N18:0 | 739.6 | 11.87 ± 0.53 |
| d18:1 N19:1 (69%)/d18:0 N19:2 (31%) | 749.6 | 41.86 ± 2.51 |
| d18:1 N19:0 | 751.6 | 158.55 ± 4.60 |
| d18:1 N20:1 | 763.6 | 311.78 ± 8.94 |
| d18:1 N20:0 | 765.7 | 708.89 ± 20.13 |
| d18:0 N20:0 | 767.7 | 1.63 ± 0.13 |
| d18:1 N21:1 | 777.7 | 98.68 ± 5.23 |
| d18:1 N21:0 | 779.7 | 284.02 ± 13.12 |
| d18:0 N22:3 | 789.7 | 21.12 ± 1.29 |
| d18:1 N22:1 | 791.7 | 402.60 ± 18.07 |
| d18:1 N22:0 | 793.7 | 686.27 ± 15.78 |
| d18:0 N22:0 | 795.7 | 0.59 ± 0.04 |
| d18:0 N23:3 | 803.7 | 1.23 ± 0.11 |
| d18:1 N23:1 | 805.7 | 212.50 ± 7.21 |
| d18:1 N23:0 | 807.7 | 366.79 ± 10.12 |
| d18:0 N23:0 | 809.7 | 2.76 ± 0.16 |
| d18:1 N24:5 | 811.6 | 1.93 ± 0.18 |
| d18:1 N24:3 | 815.7 | 18.89 ± 1.23 |
| d18:1 N24:2 | 817.7 | 163.62 ± 7.18 |
| d18:1 N24:1 (84%)/d18:0 N24:2 (16%) | 819.7 | 297.88 ± 12.18 |
| d18:1 N24:0 (82%)/d18:0 N24:1 (18%) | 821.7 | 205.04 ± 13.11 |
| d18:1 N25:1 | 833.7 | 10.66 ± 0.72 |
| d18:1 N25:0 | 835.7 | 13.54 ± 0.65 |
| d18:0 N25:0 | 837.7 | 2.71 ± 0.19 |
| Total | 5843.20 ± 222.03 |
Total lipids of each biological sample were extracted by using a modified Bligh and Dyer method as described under Section 2. Individual SM molecular species were identified by MDMS-SL analysis. Quantification of the identified SM molecular species was performed by a two-step procedure as described under Section 2. The content in pmol/mg of protein represents the mean ± S.D. of 3 animals. The percentages in parentheses indicate the molar ratios of individual isomers. The prefixes of “d” and “N” denote dihydroxylation of sphingoid bases and amide-linked fatty acyl chains, respectively.
4. Conclusion
In this report, we have systematically studied the identification and quantitation of choline-containing phospholipid molecular species (including PC, lysoPC, and SM) using MDMS-SL. Although we have not improved the previously demonstrated [25] sensitivity and dynamic range of analysis of these lipid classes, substantial improvements in the accuracy and coverage in identification of individual molecular species of these phospholipid classes have been made. Through these new developments, MDMS-SL allowed us to identify subclasses and individual molecular species of PC, lysoPC, and SM. Specifically, we demonstrated the identification of FA chain constituents and regiospecificity of PC species, alkenyl chains in pPC species, sphingoid bases of SM species, and regioisomers of lysoPC species. The accuracy in quantitation of PC species is improved by eliminating the effects of polyunsaturation on the two-step ratiometric quantification. With this suite of enhanced strategies for MDMS-SL based lipid analysis, increased penetrance into the choline-containing lipidome has been achieved that should lead to multiple applications in biomedical research.
Acknowledgement
This work was supported by National Institutes of Health Grant P01 HL57278 and National Institutes of Health/National Institute on Aging Grant R01 AG31675.
References
- [1].Vance DE, Vance JE. Biochemistry of Lipids, Lipoproteins and Membranes. Elsevier; Amsterdam: 1996. [Google Scholar]
- [2].Han X, Gross RW. J. Lipid Res. 2003;44:1071. doi: 10.1194/jlr.R300004-JLR200. [DOI] [PubMed] [Google Scholar]
- [3].Han X, Gross RW. Mass Spectrom. Rev. 2005;24:367. doi: 10.1002/mas.20023. [DOI] [PubMed] [Google Scholar]
- [4].Milne S, Ivanova P, Forrester J, Brown HA. Methods. 2006;39:92. doi: 10.1016/j.ymeth.2006.05.014. [DOI] [PubMed] [Google Scholar]
- [5].Welti R, Shah J, Li W, Li M, Chen J, Burke JJ, Fauconnier ML, Chapman K, Chye ML, Wang X. Front. Biosci. 2007;12:2494. doi: 10.2741/2250. [DOI] [PubMed] [Google Scholar]
- [6].Pulfer M, Murphy RC. Mass Spectrom. Rev. 2003;22:332. doi: 10.1002/mas.10061. [DOI] [PubMed] [Google Scholar]
- [7].Byrdwell WC, Liq J. Chromatogr. Relat. Technol. 2003;26:3147. [Google Scholar]
- [8].Hermansson M, Uphoff A, Kakela R, Somerharju P. Anal. Chem. 2005;77:2166. doi: 10.1021/ac048489s. [DOI] [PubMed] [Google Scholar]
- [9].Sommer U, Herscovitz H, Welty FK, Costello CE. J. Lipid Res. 2006;47:804. doi: 10.1194/jlr.M500506-JLR200. [DOI] [PubMed] [Google Scholar]
- [10].Laaksonen R, Katajamaa M, Paiva H, Sysi-Aho M, Saarinen L, Junni P, Lutjo-hann D, Smet J, Van Coster R, Seppanen-Laakso T, Lehtimaki T, Soini J, Oresic M. PLoS One. 2006;1:e97. doi: 10.1371/journal.pone.0000097. [DOI] [PMC free article] [PubMed] [Google Scholar]
- [11].Merrill AH, Jr., Sullards MC, Allegood JC, Kelly S, Wang E. Methods. 2005;36:207. doi: 10.1016/j.ymeth.2005.01.009. [DOI] [PubMed] [Google Scholar]
- [12].Brugger B, Erben G, Sandhoff R, Wieland FT, Lehmann WD. Proc. Natl. Acad. Sci. U.S.A. 1997;94:2339. doi: 10.1073/pnas.94.6.2339. [DOI] [PMC free article] [PubMed] [Google Scholar]
- [13].Welti R, Wang X, Williams TD. Anal. Biochem. 2003;314:149. doi: 10.1016/s0003-2697(02)00623-1. [DOI] [PubMed] [Google Scholar]
- [14].Ejsing CS, Duchoslav E, Sampaio J, Simons K, Bonner R, Thiele C, Ekroos K, Shevchenko A. Anal. Chem. 2006;78:6202. doi: 10.1021/ac060545x. [DOI] [PubMed] [Google Scholar]
- [15].Han X, Gross RW. J. Am. Soc. Mass Spectrom. 1995;6:1202. doi: 10.1016/1044-0305(95)00568-4. [DOI] [PubMed] [Google Scholar]
- [16].Kerwin JL, Tuininga AR, Ericsson LH. J. Lipid Res. 1994;35:1102. [PubMed] [Google Scholar]
- [17].Han X, Gross RW. Expert Rev. Proteomics. 2005;2:253. doi: 10.1586/14789450.2.2.253. [DOI] [PubMed] [Google Scholar]
- [18].Han X, Yang J, Cheng H, Ye H, Gross RW. Anal. Biochem. 2004;330:317. doi: 10.1016/j.ab.2004.04.004. [DOI] [PubMed] [Google Scholar]
- [19].Cheng H, Jiang X, Han X. J. Neurochem. 2007;101:57. doi: 10.1111/j.1471-4159.2006.04342.x. [DOI] [PMC free article] [PubMed] [Google Scholar]
- [20].Jiang X, Cheng H, Yang K, Gross RW, Han X. Anal. Biochem. 2007;371:135. doi: 10.1016/j.ab.2007.08.019. [DOI] [PMC free article] [PubMed] [Google Scholar]
- [21].Han X, Gross RW. J. Am. Chem. Soc. 1996;118:451. [Google Scholar]
- [22].Hsu F-F, Turk J, Thukkani AK, Messner MC, Wildsmith KR, Ford DA. J. Mass Spectrom. 2003;38:752. doi: 10.1002/jms.491. [DOI] [PubMed] [Google Scholar]
- [23].Han X, Yang J, Yang K, Zhao Z, Abendschein DR, Gross RW. Biochemistry. 2007;46:6417. doi: 10.1021/bi7004015. [DOI] [PMC free article] [PubMed] [Google Scholar]
- [24].Listenberger LL, Han X, Lewis SE, Cases S, Farese RV, Jr., Ory DS, Schaffer JE. Proc. Natl. Acad. Sci. U.S.A. 2003;100:3077. doi: 10.1073/pnas.0630588100. [DOI] [PMC free article] [PubMed] [Google Scholar]
- [25].Han X, Yang K, Gross RW. Rapid Commun. Mass Spectrom. 2008;22:2115. doi: 10.1002/rcm.3595. [DOI] [PMC free article] [PubMed] [Google Scholar]
- [26].Han X, Cheng H, Mancuso DJ, Gross RW. Biochemistry. 2004;43:15584. doi: 10.1021/bi048307o. [DOI] [PubMed] [Google Scholar]
- [27].Schwudke D, Oegema J, Burton L, Entchev E, Hannich JT, Ejsing CS, Kurzchalia T, Shevchenko A. Anal. Chem. 2006;78:585. doi: 10.1021/ac051605m. [DOI] [PubMed] [Google Scholar]
- [28].Hsu F-F, Bohrer A, Turk J. J. Am. Soc. Mass Spectrom. 1998;9:516. doi: 10.1016/S1044-0305(98)00012-9. [DOI] [PubMed] [Google Scholar]
- [29].Han X. Anal. Biochem. 2002;302:199. doi: 10.1006/abio.2001.5536. [DOI] [PubMed] [Google Scholar]
- [30].Han X, Gross RW. Anal. Biochem. 2001;295:88. doi: 10.1006/abio.2001.5178. [DOI] [PubMed] [Google Scholar]
- [31].Yang K, Zhao Z, Gross RW, Han X. PLoS One. 2007;2:e1368. doi: 10.1371/journal.pone.0001368. [DOI] [PMC free article] [PubMed] [Google Scholar]
- [32].Khaselev N, Murphy RC. J. Am. Soc. Mass Spectrom. 2000;11:283. doi: 10.1016/s1044-0305(99)00158-0. [DOI] [PubMed] [Google Scholar]
- [33].Hsu FF, Turk J. J. Am. Soc. Mass Spectrom. 2000;11:437. doi: 10.1016/S1044-0305(99)00150-6. [DOI] [PubMed] [Google Scholar]


