

Abstract
Discovering gene sets underlying the expression of a given phenotype is of great importance, as many phenotypes are the result of complex gene-gene interactions. Gene coexpression networks, built using a set of microarray samples as input, can help elucidate tightly coexpressed gene sets (modules) that are mixed with genes of known and unknown function. Functional enrichment analysis of modules further subdivides the coexpressed gene set into cofunctional gene clusters that may coexist in the module with other functionally related gene clusters. In this study, 45 coexpressed gene modules and 76 cofunctional gene clusters were discovered for rice (Oryza sativa) using a global, knowledge-independent paradigm and the combination of two network construction methodologies. Some clusters were enriched for previously characterized mutant phenotypes, providing evidence for specific gene sets (and their annotated molecular functions) that underlie specific phenotypes.
A current challenge in understanding biological systems, especially those related to multicellular eukaryotic organisms, is the understanding of complex gene-product interactions and resulting phenotypes. Integrated studies at a systems biology level are critical for unraveling complex genotype-phenotype relationships. These studies are increasingly feasible with high-throughput microarray assays, next-generation sequencing technologies, proteomics, and the wealth of accumulated functional and structural genomics data across species. Rice (Oryza sativa) is one of the world’s most important food crops and serves as a model organism for the grass family. An improved understanding of complex interactions among rice genes is of great importance to improve nutritional value, grain yield, cultivation range, and disease and stress tolerance of rice and other cereals.
In silico-derived networks such as protein-protein interaction, metabolism, transcription, and gene coexpression model real biological interactions and exhibit naturally occurring properties such as small-world, scale-free, modularity, and hierarchical characteristics (Ravasz et al., 2002; Barabasi and Oltvai, 2004). Barabasi and Oltvai (2004) provide a review of biological networks, and a brief description of relevant network properties can be found in Supplemental Table S1. One type of biological network, the gene coexpression network, is constructed from microarray gene expression profiles (Stuart et al., 2003; Persson et al., 2005; Luo et al., 2007). Nodes in the network represent microarray probe sets (or genes), and edges between nodes exist when gene expression profiles are significantly correlated (coexpressed) across all samples. In many cases, the microarray samples encompass multiple tissue types, growth stages, and experimental variables. Networks constructed from mixed sample sets represent a “global” or meta-analysis view of gene coexpression.
Gene coexpression networks can be applied to a broad range of biological problems. Examples include those constructed to identify functional gene modules in humans (Lee et al., 2004), identification of genes involved with cellulose synthase in Arabidopsis (Arabidopsis thaliana; Persson et al., 2005), identification of biomarkers for glycerol kinase-deficient mice (MacLennan et al., 2009), identification of cis-regulatory elements in gene clusters for budding yeast (Mariño-Ramírez et al., 2009), construction of a regulatory network of iron response in Shewanella oneidensis (Yang et al., 2009), and identification of conserved gene clusters across several species (Stuart et al., 2003). For plants, global coexpression networks have been constructed for Arabidopsis (Persson et al., 2005; Wei et al., 2006; Mentzen et al., 2008; Atias et al., 2009; Mao et al., 2009; Wang et al., 2009), barley (Hordeum vulgare; Faccioli et al., 2005), rice (Jupiter et al., 2009; Lee et al., 2009), and tobacco (Nicotiana tabacum; Edwards et al., 2010).
Several online resources exist for plant coexpression networks. For Arabidopsis, online resources for coexpression networks include the Arabidopsis Coexpression Tool, which allows users to mine genes with similar coexpression patterns as well as functional terms (Manfield et al., 2006), and the Arabidopsis trans-factor and cis-elements prediction database, which provides a visualization and online data-mining tool for coexpression networks in Arabidopsis (Obayashi et al., 2009). The RiceArrayNet (Lee et al., 2009) and STARNET 2 (Jupiter et al., 2009) provide similar functionality for rice. An online resource exists for poplar (Populus species; Ogata et al., 2009), and a similar site named the Coexpressed Biological Processes database provides a searchable database of functional associations for coexpression network modules across multiple plant species including rice (Ogata et al., 2010).
Gene coexpression networks do suffer from limitations. First, they cannot provide a full understanding of complex gene-gene interactions because they infer only a single level of interaction: gene coexpression. Also, coexpression can only be measured when genes are consistently coexpressed or when genes are sometimes coexpressed but otherwise consistently silent (Aoki et al., 2007). Additionally, the expression of all genes in every environmental or temporal condition cannot be measured, and hence coexpression networks do not capture all possible relationships. Moreover, genes that are not coexpressed but that may be essential are not captured. Despite these limitations, coexpression networks provide valuable glimpses into complex gene-product interactions.
Once constructed, a gene coexpression network can be examined for subnetworks of coexpressed and possibly cofunctional genes. A reduced-bias subnetwork discovery method can be performed using knowledge-independent approaches that employ statistical methods to circumscribe nonrandom gene set interactions. In contrast, gene-guided methods use a priori selected “bait” genes to define gene sets consisting of closely connected neighbors (Persson et al., 2005; Aoki et al., 2007). A knowledge-independent approach provides inferences into the interaction set that might be obscured from gene-guided methods that filter genes based on prior assumptions of the biological system under scrutiny. Using a knowledge-independent method, coexpression networks can be subdivided into tightly connected gene modules. Modules are defined as sets of highly correlated (connected) genes that form subnetworks and are often connected to the global network through a few connections.
It has been shown that modules often consist of genes that participate in similar functions (Stuart et al., 2003; Lee et al., 2004). As a result, genes of unknown function or genes not previously known to participate in molecular pathways can be identified through a “guilt-by-association” inference with genes of known function (Wolfe et al., 2005). Alternatively, function-enriched gene clusters within modules can be identified by counting annotated terms, such as Gene Ontology (GO; Ashburner et al., 2000), in a set of genes. Functional enrichment of a given term occurs if the term is significantly more abundant in the module relative to its occurrence in the genome background and implies that the module is associated with the mixture of enriched function. Furthermore, gene subsets within modules can be identified that nonrandomly share functional terms (cofunctional clusters). Modules may consist of hundreds of nodes with numerous functional terms and multiple cofunctional clusters. Publicly available tools such as DAVID (Dennis et al., 2003; Huang et al., 2009), EASE (Hosack et al., 2003), FatiGO (Al-Shahrour et al., 2007), and Blast2GO (Gotz et al., 2008) represent some of the tools that exist for functional enrichment analysis.
Recent studies show that coexpression networks can be used to identify a set of candidate genes underlying specific phenotypes. Mutwil et al. (2010) demonstrate a novel clustering method for coexpression networks, coupled with associated phenotypic terms, to predict gene sets in Arabidopsis for lethality. Lee et al. (2010) show the predicative power of a network for Arabidopsis composed of a diverse set of data (including coexpression data) to predict gene sets associated with lethality and pigmentation. By prioritization of genes through guilt by association, Lee et al. (2010) also show a 10-fold improvement over screens of random insertion mutants. Both studies demonstrate the applicability of this systems genetics approach for predicting biologically meaningfully relationships.
Here, we describe the construction and functional partitioning of a rice gene coexpression network to associate multiple coexpressed gene sets with common molecular functions and experimentally verified phenotypes. The underlying implication is that gene sets enriched for known gene lesions may be causal to a specific phenotype, and the molecular functions that are coenriched for phenotype-associated genes may provide clues to the molecular mechanisms that lead to the phenotype. Each cluster or module is a candidate gene set for studying complex traits where multiple genes may have an effect on phenotypic expression.
RESULTS
The Rice Network
Construction of the rice coexpression network began with a total of 508 Affymetrix rice arrays downloaded from the National Center for Biotechnology Information’s (NCBI’s) Gene Expression Omnibus (GEO; Supplemental Table S2), which were filtered for outliers and Robust Multichip Average (RMA; Irizarry et al., 2003) normalized (see “Materials and Methods”). Pearson correlation between gene expression profiles was used as the underlying metric for coexpression. This study used the strengths of the Random Matrix Theory (RMT; Luo et al., 2007) and weighted correlation network analysis (WGCNA; Langfelder and Horvath, 2008) methods to construct the gene coexpression network. WGCNA was used for module detection and RMT for automatic threshold (signal-to-noise) identification. Figure 1 provides a schematic of steps involved in network construction, including RMA normalization, outlier detection and removal, calculation of Pearson correlation values, module detection using WGCNA, and determination of a threshold value using RMT.
Figure 1.

Network construction flow chart. The data pipeline for construction of the rice coexpression network involves RMA normalization (Bolstad, 2010), outlier detection and removal (Kauffmann et al., 2009), construction of adjacency matrix and modules using WGCNA (Langfelder and Horvath, 2008), hard-threshold determination using RMT (Luo et al., 2007), and final culling of nodes below the threshold. [See online article for color version of this figure.]
Coexpression network construction yielded 4,528 nodes (mapped to 4,502 rice loci) connected by 43,144 edges within 45 modules, some of which were later removed after thresholding. Supplemental Table S3 provides a list of all edges in the coexpression network. The network follows the properties of natural biological networks, namely that it is small world, scale free, modular, and hierarchical. The network demonstrates small-world characteristics with an average distance between any two nodes (path length) of 11. Scale-free behavior is indicated by a negative linear correlation between the number of edges, log(k), and the probability of finding a node with k edges, P(k) (Supplemental Fig. S1A). A negative correlation between the number of edges, k, and the clustering coefficient for nodes with k edges, C(k), indicates hierarchical and modular behavior (Supplemental Fig. S1B) The average clustering coefficient, <C>, was 0.318. A graphical representation of the network, generated using Cytoscape (Shannon et al., 2003), can be seen in Figure 2. Nodes in the network are color coded according to the modules.
Figure 2.

Rice coexpression network. The rice network consists of 4,528 nodes, 43,144 edges, and 45 modules. The nodes are color coded by modules.
In order to explore the relationship between modules, the WGCNA package was used to calculate eigenvectors, or first principle components, for each module. The eigenvector, or eigengene, acts as a representative expression profile for the module and allows for a meta-analytic view of the entire module set. All eigengenes were clustered using WGCNA. Figure 3 provides a view of the modules in the form of a dendrogram that indicates the “closeness” of expression similarity of the 45 modules. Each module is numbered from zero to 44 and prefixed with “ME,” meaning “module eigengene.” Adjacent modules are more highly similar in terms of expression. It should be noted that these eigenvectors were computed from WGCNA modules prior to edge removal that were below the RMT-derived hard threshold.
Figure 3.

Module eigenvector clustering. The rice network consists of 45 modules. The eigenvectors for each module were calculated and clustered using the WGCNA software. The eigenvectors for each module are prefixed with ME in the dendrogram and are calculated prior to thresholding of the network. Adjacent modules are more highly similar in terms of expression.
Mapping of Microarray Probe Sets to Rice Loci
Prior to functional enrichment, the mapping of network nodes (microarray probe sets) to annotated rice gene models was necessary to ensure that annotation terms were not overcounted. The Michigan State University (MSU) Rice Genome Annotation version 6.0 contains 56,797 protein-coding sequence loci. Of the 57,381 probe sets on the rice microarray, 50,468 mapped to 46,498 loci. Of those mappings, 34,028 probe sets mapped directly with all 11 probes from a single probe set to a gene locus. Of those mappings, 26,382 are unique one-to-one mappings between a probe set and locus. Redundant mappings are those where multiple probe sets map to a single locus. Ambiguous mappings are those where a probe set maps to multiple loci. The distribution of probes, probe sets, and loci within the mappings can be observed in the charts of Supplemental Figure S2. There are 17,762 redundant mappings and 4,769 ambiguous mappings. Ambiguity was removed from the mappings, and the remaining redundancy was addressed with a weighted counting method (see “Materials and Methods”).
Functional Enrichment and Clustering
A functional enrichment analysis was performed to examine the enrichment of annotated terms. After counting GO (Ashburner et al., 2000), KEGG (Kanehisa et al., 2008), InterPro (Apweiler et al., 2001), and Tos17 mutant phenotype (Hirochika et al., 1996; Miyao et al., 2003) terms for each module and for the genome background, Fisher’s test comparisons were performed for each module to identify functionally enriched terms. Cofunctional gene clusters with overlapping function were then identified. Clusters are subnetworks within modules. Nodes in modules are coexpressed, and nodes within clusters are both coexpressed and cofunctional. Some modules had multiple clusters, while others had none. Functional enrichment yielded 2,412 unique enriched terms in all network modules, with 939 of these aggregating into clusters. Of the total enriched terms, 21 were unique mutant phenotype terms that associated with 25 clusters. Four mutant phenotype terms were enriched only at the module level (Supplemental Tables S4–S7).
The average connectivity, <k>, was used for ranking clusters and is the average number of connections per node in the cluster subnetwork. Additionally, an enrichment score, en-score, was determined that is the inverse log of the geometric mean of the Fisher’s P values in each cluster. For easy reference, clusters hereafter are named as follows: MxCy, where x is the module number (e.g. 1 for module 1) and y is the cluster number (e.g. 2 for cluster 2). Modules are named as Mx. Module numbers originate from WGCNA, and cluster numbers are ordered sequentially in descending order of <k>.
Online Coexpression Network Browser
An online resource has been created to facilitate coexpression network browsing. The Web site is available at http://www.clemson.edu/genenetwork. This Web site allows users to browse the list of probe sets, loci, and enriched terms of modules and clusters. Additionally, visualizations are provided for each cluster including free-standing interactive network graphs and cluster networks superimposed onto the rice genome. Users can search for functional terms, loci, probe sets, or other keywords to find modules and clusters that may relate to genes, pathways, functions, or phenotypes of interest. The site shows genome alignments for each locus, including InterPro domains and alignments with Affymetrix probes. Annotation terms (e.g. GO, InterPro, KEGG) link out to external sites. Figure 4 shows various screen shots of cluster M6C2 from the Web site.
Figure 4.

Screen shots of the online rice coexpression network browser for cluster M6C2. A, The list of loci and probe sets and their mappings. B, The subnetwork graph with navigation toolbox. C, The subnetwork graph superimposed on the genome. D, Loci (feature) details including genome alignments from the MSU Rice Genome Browser. The site is located at http://www.clemson.edu/genenetwork.
Functional Significance of Select Modules and Clusters
The largest of the 45 modules is M6 (large module in the top left of Fig. 2), which consists of 26 clusters. A majority of M6 clusters contain enriched function associated with translation and photosynthesis, including carbon fixation and related processes. Many of these clusters are also enriched for terms referencing the plastid, suggesting that M6 consists of genes involved in processes that occur in the chloroplast. For example, cluster M6C1 is ranked highest in average connectivity for the whole network. M6C1 consists of 75 enriched terms, 43 loci, 52 nodes, <k> = 17.54, en-score = 2.61, and 456 edges. The highest ranked (lowest P value) term in this cluster is the GO term for translation (GO:0006412; P = 7.80e-27). Other terms in this cluster include ribosome, plastid, translation elongation, and rRNA binding. Several M6 clusters are enriched with the mutant phenotypic terms “low tillering,” “extremely dwarf,” “lethal,” “sterile,” and “yellow.” A complete accounting of M6 edges, loci, probe sets, clusters, and enriched terms can be found on the coexpression network browser and in Supplemental Tables S3, S4, S5, S6, and S7, respectively. A total of 127 loci are coexpressed in M6 but have no known ascribed function (Supplemental Table S8).
Another interesting cluster is M13C1. M13C1 has the second highest ranked en-score and the second highest <k>, indicating that it is highly coexpressed and cofunctional. M13C1 consists of 12 enriched terms, 16 loci, 21 nodes, <k> = 12.86, en-score = 10.64, and 135 edges. The highest ranked enriched term is the “cereal seed allergen/grain softness/trypsin and alpha-amylase inhibitor” protein domain (IPR006106; P = 6.28e-23; Table I). Other terms related to lipid transfer and seed storage are also enriched in M13C1. Appropriately, Genevestigator analysis (Hruz et al., 2008) shows high levels of expression in the milk and dough stages as well as in inflorescence, seed, and embryo developmental stages (Fig. 5). Additional heat maps for the top 10 connected clusters (excluding M13C1) are available in Supplemental Figure S3. It should be noted that at the time of this study, Genevestigator incorporated approximately 151 samples of the Affymetrix rice platform from GEO, while 508 samples from GEO were used for our network construction. Genevestigator has not incorporated newly available rice arrays. It should be noted that there is a difference in the number of samples for each tissue type between the Genevestigator arrays and the network arrays. However, there are several biological replicates across the various samples for each tissue type and developmental stage in the Genevestigator data set. The only exceptions are stamen, anther, and embryo, which have one sample each. Therefore, we expect that Genevestigator results can provide support to the correctness of the functional clusters in the majority of tissues and stages.
Table I. Enriched terms from cluster M13C1.
<k> = 12.86, en-score = 10.64, 135 edges, 21 nodes, and 16 loci. GO and IPR accession numbers are from Gene Ontology and InterPro, respectively.
| Term Accession No. | Description | P |
| IPR006106 | Cereal seed allergen/grain softness/trypsin and alpha-amylase inhibitor | 6.28E-23 |
| IPR006105 | Cereal seed allergen/trypsin and alpha-amylase inhibitor, conserved site | 1.05E-18 |
| GO:0004867 | Serine-type endopeptidase inhibitor activity | 1.55E-18 |
| GO:0016068 | Type I hypersensitivity | 2.22E-17 |
| IPR002411 | Cereal allergen/alpha-amylase inhibitor, rice type | 1.36E-16 |
| IPR016309 | Alpha-amylase inhibitor/seed allergen | 1.36E-09 |
| GO:0005615 | Extracellular space | 6.93E-09 |
| IPR001954 | Gliadin/low-molecular-weight glutenin | 5.22E-07 |
| IPR013771 | Bifunctional trypsin/alpha-amylase inhibitor | 1.04E-05 |
| IPR003612 | Plant lipid transfer protein/seed storage/trypsin and alpha-amylase inhibitor | 3.20E-04 |
| IPR016140 | Bifunctional inhibitor/plant lipid transfer protein/seed storage | 6.73E-04 |
| GO:0045735 | Nutrient reservoir activity | 6.71E-03 |
Figure 5.

Cluster M13C1 with Genevestigator analysis. A, The subnetwork for cluster M13C1 (<k> = 12.86, en-score = 10.64, 135 edges, 21 nodes, and 16 loci). B, Heat map showing expression levels by anatomical locations. C, The Genevestigator analysis heat map showing expression levels in microarray sets categorized by development stage. [See online article for color version of this figure.]
One cluster enriched for phenotypic terms is M2C2 (11 loci, <k> = 4.33, en-score = 4.93, 12 nodes, and 26 edges). This cluster is enriched with three mutant phenotype terms: “sterile,” “dwarf,” and “high tillering.” The cluster is also enriched with the “cyclin A/B/D/E” (IPR014400; P = 1.25e-10) and “G2/mitotic-specific cyclin A” (IPR015453; P = 9.96e-4) protein domains and other terms related to cyclin in the mitotic cell cycle. Four loci in this cluster have mutant phenotype associations, including two, LOC_Os01g59120 and LOC_Os05g41390, annotated as “cyclin, putative, expressed” and two expressed proteins with no known function: LOC_Os02g10490 and LOC_Os02g35230.
Another cluster, M8C1, is enriched for processes related to defense response. This cluster is enriched with multiple mutant terms: “extremely dwarf,” “late heading,” “lazy,” “short panicle,” and “wide leaf.” The gene products in this cluster include powdery mildew resistance proteins, nucleotide-binding site-Leu-rich repeat proteins, stripe rust resistance proteins, and one protein with unknown function. The protein of unknown function, LOC_Os02g06790, is also enriched for lazy and late heading. Many of the other M8C1 loci are associated with multiple mutant terms that are not enriched.
A list of all clusters enriched for mutant phenotype terms can be found in Table II. Phenotype terms enriched at the module level can be found in Table III. A detailed list of clusters, associated probe sets, gene accessions, clusters, and all enriched terms for each module can be found in the Supplemental Data or through the coexpression network browser.
Table II. Complete list of TOS phenotype terms enriched in clusters.
| Clustera | <k> | en-score | Summarized Functionb | Phenotype Terms |
| M2C1 | 8.22 | 4.14 | Cell cycle/kinesin/cyclin | Dwarf, high tillering, sterile |
| M2C2 | 4.33 | 4.93 | Cell cycle/cyclin | Dwarf, high tillering, sterile |
| M2C3 | 3.69 | 3.56 | DNA replication | Dwarf |
| M2C4 | 3.36 | 3.37 | Cell cycle/kinesin | Dwarf, sterile |
| M2C7 | 1.00 | 4.36 | DNA replication | Dwarf |
| M2C8 | 0.91 | 2.71 | Cell cycle | Dwarf, sterile |
| M2C11 | 0.75 | 1.49 | Cell cycle | Dwarf |
| M2C16 | 0.40 | 7.36 | DNA replication/polymerase | Dwarf |
| M6C2 | 12.30 | 3.12 | Photosynthesis/light harvesting | Dwarf, extremely dwarf, lethal, low tillering, sterile, yellow |
| M6C3 | 9.23 | 2.54 | Electron carrier activity | Dwarf, extremely dwarf, lethal, low tillering, sterile, yellow |
| M6C5 | 3.60 | 2.05 | Photosynthesis | Dwarf, extremely dwarf, lethal, low tillering, sterile, Yellow |
| M6C10 | 1.60 | 5.04 | Oxidoreductase activity | dwarf |
| M6C11 | 1.56 | 4.66 | Translation | Low tillering |
| M6C13 | 1.51 | 3.32 | Photosynthesis | Extremely dwarf, lethal |
| M6C14 | 1.25 | 2.22 | Glycoside hydrolase | Extremely dwarf |
| M6C15 | 1.20 | 2.47 | Carbon fixation | Dwarf |
| M6C16 | 1.14 | 3.94 | Translation or photosynthesis | Dwarf |
| M6C18 | 0.80 | 1.82 | Translation or photosynthesis | Yellow |
| M6C19 | 0.73 | 2.64 | Regulation of transcription | Lethal |
| M6C20 | 0.50 | 3.36 | Translation or photosynthesis | Dwarf, extremely dwarf, lethal, low tillering, sterile, yellow |
| M6C22 | 0.50 | 3.28 | Oxidoreductase activity | Dwarf, extremely dwarf |
| M7C1 | 1.23 | 2.45 | Transporter activity | Pale green leaf |
| M8C1 | 0.77 | 2.50 | Defense response | Extremely dwarf, late heading, lazy, short panicle, wide leaf |
| M8C2 | 0.25 | 1.79 | Kinase activity | Stripe |
| M18C1 | 1.60 | 1.63 | Lipid binding | Vivipary |
Modules are numbered sequentially starting from zero and are prefixed with the letter M. Clusters within a module are numbered sequentially and are prefixed with the letter C. Thus, cluster 1 from module 8 is named M8C1.
When function cannot be summarized for the cluster, the modular summarized function is listed.
Table III. List of enriched mutant phenotypes.
| Modulea | TOS Term | P |
| M1 | Large grain | 6.41E-02 |
| M1 | Weak | 8.68E-02 |
| M2 | Dwarf | 9.76E-03 |
| M2 | High tillering | 5.19E-02 |
| M2 | Sterile | 4.81E-04 |
| M6 | Dwarf | 5.67E-02 |
| M6 | Extremely dwarf | 1.07E-03 |
| M6 | Lethal | 5.84E-03 |
| M6 | Low tillering | 2.58E-04 |
| M6 | Sterile | 9.44E-03 |
| M6 | Yellow | 2.09E-02 |
| M7 | Pale green leaf | 1.79E-02 |
| M8 | Extremely dwarf | 3.26E-06 |
| M8 | Late heading | 1.14E-02 |
| M8 | Lazy | 3.26E-04 |
| M8 | Short panicle | 1.01E-03 |
| M8 | Stripe | 6.98E-02 |
| M8 | Wide leaf | 9.78E-02 |
| M12 | Withering | 4.86E-02 |
| M13 | Rolled leaf | 8.54E-02 |
| M14 | Zebra | 3.30E-02 |
| M18 | Vivipary | 1.78E-03 |
| M25 | Abnormal shoot | 3.78E-02 |
| M32 | Germination rate | 4.38E-02 |
| M35 | Late heading | 6.08E-02 |
| M43 | Vivipary | 3.40E-02 |
Modules are numbered sequentially from 0 to 57 and are prefixed with the letter M. Thus, module 8 is named M8.
DISCUSSION
The major objective for this study was to use a global, meta-analysis, knowledge-independent approach to construct a rice gene coexpression network that predicts clusters of candidate genes involved in complex genotype-phenotype interactions. We hypothesized that tightly coexpressed gene modules, enriched in shared functional annotation, would provide the most fruitful predictions of candidate gene sets that might underlie a given biological process. Using mutant phenotype terms in functional enrichment provides a hypothetical association between phenotype and the gene sets of modules and clusters. Coenrichment of phenotypes with molecular function terms in a tightly coexpressed gene module suggests a direct association between the functional units carried on genes (e.g. protein domains, GO terms, etc.) and phenotype. When mutant phenotype terms are enriched in a highly connected gene cluster, the phenotypic association can also be extended to the neighboring coexpressed genes within the confines of a given module. Thus, the circumscribed gene sets become candidate factors underlying the expression of complex traits, and their annotated functions provide insight into molecular pathways associated with the expression of empirically defined phenotypes. For instance, module M6 contains 127 loci that have no known function. It can be inferred that these loci may be involved in some aspect of photosynthesis or translation, given the M6 enrichment for photosynthesis/translation-related annotations. In the case of the 26 M6 clusters enriched with phenotype terms, it can be predicted through guilt by association that other genes in the cluster may also contribute to the enriched phenotypes.
Many clusters in our network can be examined for possible genotype-phenotype interactions. For example, the previously mentioned cluster M2C2 is enriched for cyclin and mitosis as well as the mutant phenotypes “dwarf,” “high tillering,” and “sterile.” Two of the genes in this module were shown to have no known function (see “Results”). Therefore, it can be inferred that these two genes are involved in processes related to cyclin and mitotic cell division. Additionally, these two genes also share the “dwarf” and “sterile” mutant terms, indicating their role as factors of those phenotypes. These genes are well connected with other nodes in the cluster; therefore, through guilt by association, we can infer that other genes in the M2C2 cluster are also factors for the enriched phenotypes. Also mentioned previously was cluster M8C1 enriched for defense response terms. This cluster is not as highly connected as M2C2; however, inferences can be made that the gene of unknown function in this module participates in defense response, perhaps in an indirect manner, and that all of the genes in the cluster are factors for the expression of several phenotypes. Despite lower average connectivity, the nodes all exhibit similar patterns of coexpression. It can be inferred that this unknown gene plays some role related to defense response.
Two different construction methods were integrated to build the coexpression network, namely the WGCNA and RMT methods. These two methods were selected primarily as a means of preserving a knowledge-independent paradigm. A strength of the WGCNA method lies in its ability to detect modules. Module detection in WGCNA follows a knowledge-independent process. However, selection of a threshold for culling the network to limit noise would otherwise rely on functional annotation and empirical judgment (Langfelder and Horvath, 2008). A strength of the RMT method lies in its ability to automatically localize the noise-to-signal threshold without using annotations or empirical judgment. Therefore, we were able to generate a single network by passing the same adjacency matrix (power-transformed pair-wise Pearson correlation values) generated by the WGCNA method into the RMT method for threshold detection (Fig. 1). This ensured knowledge independence for meaningful thresholding of the network modules.
Our rice network does not encompass all the gene-gene interactions one would expect from all genes in the genome. The number of nodes in the network is 4,528, whereas the entire genome consists of 56,797 coding sequence loci. Therefore, the network is not representative of all coexpression relationships for all genes in the network. Coexpression can only be measured when genes are consistently coexpressed or when genes are sometimes coexpressed but otherwise consistently silent (Aoki et al., 2007). A bias exists in global coexpression networks for relationships that persist across all conditions and tissue types used by the underlying microarray samples (e.g. housekeeping processes) or for relationships only expressed in a few tissue types, environmental conditions, and developmental stages. The rice network presented here is most noticeably enriched for genes controlling housekeeping processes. Additionally, coexpression relationships that exist primarily in a few tissue types, developmental stages, and conditions are not easily identified. The nodes in our network, however, do have coexpression relationships that are statistically significant across all samples, so each edge in our network is potentially biologically valid. While rice gene space sampling is not complete, the underlying goal was to find highly connected gene clusters enriched with phenotypic terms. We believe that our approach was successful and that inferences of polygenic phenotypic causality for gene sets can be made.
One observation was that some clusters showed significant enrichment in function yet demonstrated very low connectivity within the cluster (e.g. cluster M2C19, <k> = 0). The nodes of these clusters were mostly coexpressed through nonclustered intermediaries. Because highly connected genes are more likely to participate in similar function, we ranked clusters by average connectivity, <k>. We believe that this ranking improves the prediction inferred through guilt by association with enriched annotation terms. Therefore, clusters that ranked highest are more likely to yield guilt-by-association inferences for genes of unknown function and as factors for expression of mutant phenotypes. It should not be assumed that an absolute <k> cutoff exists as a significance threshold for clusters. Poorly connected clusters, in fact, may be quite significant and should not be dismissed.
CONCLUSION
This study describes a set of modules and clusters that can assist with understanding of gene-gene, gene-function, and genotype-phenotype interactions for rice. While the number of enriched phenotype terms is low, the application demonstrates a positive approach for identifying gene sets associated with specific phenotypes. The network provides a set of interesting modules and clusters worthy of further investigation. In the process of investigating the use of coexpression networks, we suggest that the RMT and WGCNA network construction methods can be combined to extend the knowledge-independent approach to the final stages of module discovery. We also propose a cluster ranking method using average connectivity that rewards highly connected clusters with the expectations that highly ranked clusters are most meaningful in the data set. These data can help in the discovery of candidate genes for studies of complex traits in rice as well as a reference for other grass species.
MATERIALS AND METHODS
Raw Expression Data
The data set used for the construction of the coexpression network was obtained from NCBI’s GEO, platform accession number GPL2025. The platform consists of experimental samples from assays using the Affymetrix GeneChip Rice Genome Array (http://www.affymetrix.com/support/technical/byproduct.affx?product=rice). The array consists of 57,381 probe sets derived mostly from The Institute for Genomic Research version 2.0 release of the rice (Oryza sativa) genome and consists of transcripts for both the japonica and indica cultivars. A total of 550 CEL files were obtained from GEO, and 13 CEL files were removed due to an incorrect Arabidopsis (Arabidopsis thaliana) array type. RMA normalization (Irizarry et al., 2003) of all microarray samples was performed using the RMAExpress software (Bolstad, 2010). Outliers were detected using the arrayQualityMetrics (Kauffmann et al., 2009) Bioconductor (Gentleman et al., 2004) package, which uses three different statistical tests to identify outliers. Twenty-nine samples failed at least one test and were considered outliers and removed from the data set. A total of 508 samples remained for network construction. Control probes from the platform were removed from the samples prior to network construction.
Expression Profile Correlation
The expression profile of a gene consists of the set of expression levels across all microarray samples in the study. Initially, construction of the coexpression network requires pair-wise correlation of all gene expression profiles to obtain an n × n similarity matrix, S:
where xi and xj are the pair of expression profiles for genes i and j and cor(x,y) represents the Pearson correlation function.
Scale-Free Behavior and Module Detection
The WGCNA package (Zhang and Horvath, 2005; Langfelder and Horvath, 2008) provides a robust set of R functions for constructing weighted coexpression networks. The similarity matrix is transformed into an adjacency matrix using a method that employs a power function. This is termed “soft thresholding.” The result is an adjacency matrix where correlation strength is enhanced for highly correlated genes and correlation information is preserved for module discovery. The values of the adjacency matrix are represented by the following formula:
The power (β) used to transform the similarity matrix is selected when the resulting network best approximates a scale-free topology. The WGCNA method provides functionality to assist with selection of the power function. For this study, a soft-threshold power of 4 was used.
Probe sets with ambiguous mappings to multiple rice loci were removed from the data set if there were less than six probes in the mapping, and remaining probe sets were kept if what remained was a unique or redundant mapping. Of the 4,769 probe sets with ambiguous mappings, 3,223 probe sets were removed. Affymetrix control probes were next removed from the data set.
The n × n similarity matrix for the remaining 52,501 probe sets was too large for R, which has a 32-bit integer limit on the index size of a matrix. Therefore, the algorithm was instructed to break the data set into three blocks with a minimum of 30 probe sets and a maximum of 30,000. The WGCNA package calculates modules of similarly coexpressed genes using a topological similarity matrix and a hierarchical clustering method. A value of 0.2 was specified for cutting the resulting dendrogram into distinct modules.
Threshold Selection and Network Analysis
A weighted soft-threshold network maintains edges from all nodes to all nodes, with the edge weight indicating the strength of the coexpression. This becomes valuable for module detection. However, selection of a hard threshold after module detection is required to remove noise. A RMT method (Luo et al., 2007) was used to recognize the boundary between noise and nonnoise and for selection of a hard threshold of the network. The hard threshold is determined by the transition of nearest neighbor spacing distribution of the similarity matrix from the Gaussian orthogonal ensemble statistics to the Poisson distribution. The χ2 test (confidence level of 0.001) was used to define the similarity threshold at which nearest neighbor spacing distribution completely follows the Poisson distribution. For the rice coexpression network, a hard-threshold r of the power-transformed Pearson correlation matrix at r = |0.7101| was observed. The soft-thresholded, power-transformed adjacency matrix is then “hard thresholded” by setting all values less than the threshold to zero. Nodes with an adjacency value of zero are removed from the modules. Modules with no remaining nodes are discarded. Characterization of the network in terms of scale-free, small-world, modularity, and hierarchical behavior was performed using the NetworkAnalyzer package for Cytoscape (Assenov et al., 2008)
Functional Enrichment
The annotation of rice probe sets provided by Affymetrix was derived from The Institute for Genomic Research version 2.0 gene models. However, more up-to-date annotations were desired. Therefore, annotations were updated using mapping information provided by release version 6.0 of the MSU Rice Genome Annotation Project, which maps probe sets to 6.0 gene models (Ouyang et al., 2007). The locus identifiers from release 6.0 were then used to provide four classes of function terms: GO (Ashburner et al., 2000), KEGG (Kanehisa et al., 2008), InterPro (Apweiler et al., 2001), and Tos17 mutant phenotypes (Hirochika et al., 1996; Miyao et al., 2003). In some cases, such as with GO and InterPro, these annotations were provided by the MSU project. For annotation of KEGG pathways, orthologs, and protein families to the locus identifiers, the release 6.0 coding sequences were uploaded to the online KEGG Automatic Annotation Server tool (Moriya et al., 2007). KEGG Automatic Annotation Server results were parsed, and terms were annotated to locus identifiers. TOS mutant phenotypic data were associated with locus identifiers through BLASTN alignments of Tos17 flanking sequence obtained from NCBI.
Each probe on the microarray was mapped to MSU rice locus identifiers by the MSU project, and the mappings are available for download in GFF format (http://www.sanger.ac.uk/Software/formats/GFF/). For functional enrichment, terms from all four classes were counted for the background (entire genome) and for each module in the weighted network. Counting of terms is complicated because multiple probe sets can map to multiple loci and vice versa. Additionally, all 11 probes in a probe set may not map to a single locus. The nature and quantity of these many-to-many mappings are shown in the Supplemental Figure S2.
To account for ambiguity and redundancy when counting, a weighted method was performed. Probe sets that mapped to a locus with fewer than three probes were not considered for counting. Probe sets that mapped with more than 11 probes were also not considered for counting. The remaining probe sets contributed a count for each term equal to the following equation:
0 if t does not map to i, 0 if p does not map to i.
In the equation above, c(t,i,p) is the count contributed by a probe set p for a given term t mapped to locus identifier i; nip is the number of probes that map to i from probe set p, mi is the total number of probe sets that map to i, and qp is the total number of loci that map to p. Perfect one-to-one mappings contribute a count of 1, while all others contribute a value between 0 and 1. The effect of redundancy is accounted for in that the count from multiple probe sets mapping to the same locus never exceeds 1. Ambiguity is reduced by this equation but provides no effect for our purposes, as we had removed ambiguity prior to counting.
Once counting was complete, pair-wise Fisher’s exact tests were performed using R between the count of terms from each module in the network and the background. Terms with P < 0.1, with a 95% confidence level, were considered enriched.
Functional Clustering
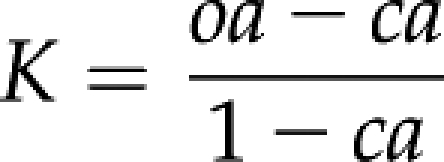
Functional clustering was performed using a set of in-house scripts that follow the protocol used by DAVID (Dennis et al., 2003; Huang et al., 2009). Kappa statistics are used to provide a measure of agreement between two (or more) classes of qualitative data. The Kappa κ score provides a measure of agreement in the range 0 to 1, where 0 indicates no agreement and 1 indicates almost perfect agreement. For this study, a pair-wise κ score was calculated for each gene using the contingency matrix in Table IV. Here, C11 is the number of terms shared by both loci A and B, C01 is the number of terms present in locus A but not locus B, C10 is the number of terms present in locus B but not locus A, and C00 is the number of terms that neither loci share. Tab, which is the sum of either the total row or column, equals the total number of terms in the module. The κ score is calculated using the following equations:
 |
where
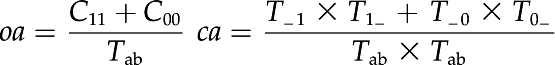 |
Table IV. Contingency matrix for Kappa statistics.
| Locus B | Locus A |
||
| Terms Present | Terms Not Present | Total | |
| Terms Present | C11 | C10 | Ta_ |
| Terms Not Present | C01 | C00 | Tb_ |
| Total | T_a | T_b | Tab |
In the equation above, oa is the observed agreement, ca is the chance agreement, and K is the κ score.
Clustering of terms consisted of two steps. First, seed groups for each module were formed. A seed group was formed for each gene by grouping it with all other genes with which it shares a κ score greater than 0.5. Seed groups with less than three genes were not considered. Since probe sets may map to more than one gene, the mapping counts described previously were summed and must equal 3. Also, seed groups were only considered if 50% or more of the κ scores between all group members were greater than 0.5. Second, seed groups of a module were merged through an iterative process that exhaustively compared each group with every other group and merged any two that have 50% similarity. This continued until merging was no longer possible.
Clusters were ranked using two values, the enrichment score (en-score) and average connectivity. The en-score is the negative inverse log of the geometric mean for the Fisher’s P values from all terms in the cluster:
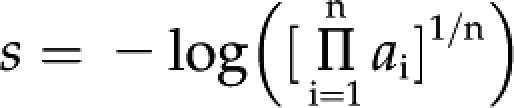 |
where s is the en-score, ai is the Fisher’s P value, and n is the number of terms in the cluster.
The average connectivity, <k>, of the cluster is 2l/n, where l is the number of edges and n is the number of nodes in the cluster. The <k> value was used as the primary characteristic for ranking clusters.
Supplemental Data
The following materials are available in the online version of this article.
Supplemental Figure S1. Network characteristics.
Supplemental Figure S2. Affymetrix rice probe set mapping to rice loci.
Supplemental Figure S3. Genevestigator heat maps for top 10 connected clusters.
Supplemental Table S1. Properties of natural complex networks.
Supplemental Table S2. Microarray samples used in network construction (includes abbreviated GEO annotation).
Supplemental Table S3. Network edges.
Supplemental Table S4. Rice locus identifiers in functionally enriched clusters.
Supplemental Table S5. Affymetrix probe set identifiers in functionally enriched clusters.
Supplemental Table S6. Enriched functional terms in rice clusters.
Supplemental Table S7. Enriched functional terms in modules.
Supplemental Table S8. Genes with no known or annotated function.
Supplementary Material
References
- Al-Shahrour F, Minguez P, Tarraga J, Medina I, Alloza E, Montaner D, Dopazo J. (2007) FatiGO +: a functional profiling tool for genomic data. Integration of functional annotation, regulatory motifs and interaction data with microarray experiments. Nucleic Acids Res 35: W91–W96 [DOI] [PMC free article] [PubMed] [Google Scholar]
- Aoki K, Ogata Y, Shibata D. (2007) Approaches for extracting practical information from gene co-expression networks in plant biology. Plant Cell Physiol 48: 381–390 [DOI] [PubMed] [Google Scholar]
- Apweiler R, Attwood TK, Bairoch A, Bateman A, Birney E, Biswas M, Bucher P, Cerutti L, Corpet F, Croning MD, et al. (2001) The InterPro database, an integrated documentation resource for protein families, domains and functional sites. Nucleic Acids Res 29: 37–40 [DOI] [PMC free article] [PubMed] [Google Scholar]
- Ashburner M, Ball CA, Blake JA, Botstein D, Butler H, Cherry JM, Davis AP, Dolinski K, Dwight SS, Eppig JT, et al. (2000) Gene Ontology: tool for the unification of biology. The Gene Ontology Consortium. Nat Genet 25: 25–29 [DOI] [PMC free article] [PubMed] [Google Scholar]
- Assenov Y, Ramirez F, Schelhorn SE, Lengauer T, Albrecht M. (2008) Computing topological parameters of biological networks. Bioinformatics 24: 282–284 [DOI] [PubMed] [Google Scholar]
- Atias O, Chor B, Chamovitz DA. (2009) Large-scale analysis of Arabidopsis transcription reveals a basal co-regulation network. BMC Syst Biol 3: 86. [DOI] [PMC free article] [PubMed] [Google Scholar]
- Barabasi AL, Oltvai ZN. (2004) Network biology: understanding the cell’s functional organization. Nat Rev Genet 5: 101–113 [DOI] [PubMed] [Google Scholar]
- Bolstad B. (2010) RMAExpress. http://rmaexpress.bmbolstad.com/ (July 1, 2010) [Google Scholar]
- Dennis G, Jr, Sherman BT, Hosack DA, Yang J, Gao W, Lane HC, Lempicki RA. (2003) DAVID: Database for Annotation, Visualization, and Integrated Discovery. Genome Biol 4: 3. [PubMed] [Google Scholar]
- Edwards KD, Bombarely A, Story GW, Allen F, Mueller LA, Coates SA, Jones L. (2010) TobEA: an atlas of tobacco gene expression from seed to senescence. BMC Genomics 11: 142. [DOI] [PMC free article] [PubMed] [Google Scholar]
- Faccioli P, Provero P, Herrmann C, Stanca AM, Morcia C, Terzi V. (2005) From single genes to co-expression networks: extracting knowledge from barley functional genomics. Plant Mol Biol 58: 739–750 [DOI] [PubMed] [Google Scholar]
- Gentleman RC, Carey VJ, Bates DM, Bolstad B, Dettling M, Dudoit S, Ellis B, Gautier L, Ge Y, Gentry J, et al. (2004) Bioconductor: open software development for computational biology and bioinformatics. Genome Biol 5: R80. [DOI] [PMC free article] [PubMed] [Google Scholar]
- Gotz S, Garcia-Gomez JM, Terol J, Williams TD, Nagaraj SH, Nueda MJ, Robles M, Talon M, Dopazo J, Conesa A. (2008) High-throughput functional annotation and data mining with the Blast2GO suite. Nucleic Acids Res 36: 3420–3435 [DOI] [PMC free article] [PubMed] [Google Scholar]
- Hirochika H, Sugimoto K, Otsuki Y, Tsugawa H, Kanda M. (1996) Retrotransposons of rice involved in mutations induced by tissue culture. Proc Natl Acad Sci USA 93: 7783–7788 [DOI] [PMC free article] [PubMed] [Google Scholar]
- Hosack DA, Dennis G, Jr, Sherman BT, Lane HC, Lempicki RA. (2003) Identifying biological themes within lists of genes with EASE. Genome Biol 4: R70. [DOI] [PMC free article] [PubMed] [Google Scholar]
- Hruz TLO, Szabo G, Wessendrop F, Bleuler S, Oertle L, Widmayer P, Gruissem W, Zimmermann P. (2008) Genevestigator V3: a reference expression database for the meta-analysis of transcriptomes. Advances in Bioinformatics 2008: 420747. [DOI] [PMC free article] [PubMed] [Google Scholar]
- Huang DW, Sherman BT, Lempicki RA. (2009) Systematic and integrative analysis of large gene lists using DAVID bioinformatics resources. Nat Protoc 4: 44–57 [DOI] [PubMed] [Google Scholar]
- Irizarry RA, Hobbs B, Collin F, Beazer-Barclay YD, Antonellis KJ, Scherf U, Speed TP. (2003) Exploration, normalization, and summaries of high density oligonucleotide array probe level data. Biostatistics 4: 249–264 [DOI] [PubMed] [Google Scholar]
- Jupiter D, Chen H, VanBuren V. (2009) STARNET 2: a Web-based tool for accelerating discovery of gene regulatory networks using microarray co-expression data. BMC Bioinformatics 10: 332. [DOI] [PMC free article] [PubMed] [Google Scholar]
- Kanehisa M, Araki M, Goto S, Hattori M, Hirakawa M, Itoh M, Katayama T, Kawashima S, Okuda S, Tokimatsu T, et al. (2008) KEGG for linking genomes to life and the environment. Nucleic Acids Res 36: D480–D484 [DOI] [PMC free article] [PubMed] [Google Scholar]
- Kauffmann A, Gentleman R, Huber W. (2009) arrayQualityMetrics: a Bioconductor package for quality assessment of microarray data. Bioinformatics 25: 415–416 [DOI] [PMC free article] [PubMed] [Google Scholar]
- Langfelder P, Horvath S. (2008) WGCNA: an R package for weighted correlation network analysis. BMC Bioinformatics 9: 559. [DOI] [PMC free article] [PubMed] [Google Scholar]
- Lee H, Hsu A, Sajdak J, Qin J, Pavlidis P. (2004) Coexpression analysis of human genes across many microarray data sets. Genome Res 14: 1085–1094 [DOI] [PMC free article] [PubMed] [Google Scholar]
- Lee I, Ambaru B, Thakkar P, Marcotte EM, Rhee SY. (2010) Rational association of genes with traits using a genome-scale gene network for Arabidopsis thaliana. Nat Biotechnol 28: 149–156 [DOI] [PMC free article] [PubMed] [Google Scholar]
- Lee TH, Kim YK, Pham TT, Song SI, Kim JK, Kang KY, An G, Jung KH, Galbraith DW, Kim M, et al. (2009) RiceArrayNet: a database for correlating gene expression from transcriptome profiling, and its application to the analysis of coexpressed genes in rice. Plant Physiol 151: 16–33 [DOI] [PMC free article] [PubMed] [Google Scholar]
- Luo F, Yang Y, Zhong J, Gao H, Khan L, Thompson DK, Zhou J. (2007) Constructing gene co-expression networks and predicting functions of unknown genes by random matrix theory. BMC Bioinformatics 8: 299. [DOI] [PMC free article] [PubMed] [Google Scholar]
- MacLennan NK, Dong J, Aten JE, Horvath S, Rahib L, Ornelas L, Dipple KM, McCabe ER. (2009) Weighted gene co-expression network analysis identifies biomarkers in glycerol kinase deficient mice. Mol Genet Metab 98: 203–214 [DOI] [PubMed] [Google Scholar]
- Manfield IW, Jen CH, Pinney JW, Michalopoulos I, Bradford JR, Gilmartin PM, Westhead DR. (2006) Arabidopsis Co-expression Tool (ACT): Web server tools for microarray-based gene expression analysis. Nucleic Acids Res 34: W504–W509 [DOI] [PMC free article] [PubMed] [Google Scholar]
- Mao L, Van Hemert JL, Dash S, Dickerson JA. (2009) Arabidopsis gene co-expression network and its functional modules. BMC Bioinformatics 10: 346. [DOI] [PMC free article] [PubMed] [Google Scholar]
- Mariño-Ramírez L, Tharakaraman K, Bodenreider O, Spouge J, Landsman D. (2009) Identification of cis-regulatory elements in gene co-expression networks using A-GLAM. Methods Mol Biol 541: 1–22 [DOI] [PMC free article] [PubMed] [Google Scholar]
- Mentzen WI, Peng J, Ransom N, Nikolau BJ, Wurtele ES. (2008) Articulation of three core metabolic processes in Arabidopsis: fatty acid biosynthesis, leucine catabolism and starch metabolism. BMC Plant Biol 8: 76. [DOI] [PMC free article] [PubMed] [Google Scholar]
- Miyao A, Tanaka K, Murata K, Sawaki H, Takeda S, Abe K, Shinozuka Y, Onosato K, Hirochika H. (2003) Target site specificity of the Tos17 retrotransposon shows a preference for insertion within genes and against insertion in retrotransposon-rich regions of the genome. Plant Cell 15: 1771–1780 [DOI] [PMC free article] [PubMed] [Google Scholar]
- Moriya Y, Itoh M, Okuda S, Yoshizawa AC, Kanehisa M. (2007) KAAS: an automatic genome annotation and pathway reconstruction server. Nucleic Acids Res 35: W182–W185 [DOI] [PMC free article] [PubMed] [Google Scholar]
- Mutwil M, Usadel B, Schutte M, Loraine A, Ebenhoh O, Persson S. (2010) Assembly of an interactive correlation network for the Arabidopsis genome using a novel heuristic clustering algorithm. Plant Physiol 152: 29–43 [DOI] [PMC free article] [PubMed] [Google Scholar]
- Obayashi T, Hayashi S, Saeki M, Ohta H, Kinoshita K. (2009) ATTED-II provides coexpressed gene networks for Arabidopsis. Nucleic Acids Res 37: D987–D991 [DOI] [PMC free article] [PubMed] [Google Scholar]
- Ogata Y, Suzuki H, Sakurai N, Shibata D. (2010) CoP: a database for characterizing co-expressed gene modules with biological information in plants. Bioinformatics 26: 1267–1268 [DOI] [PubMed] [Google Scholar]
- Ogata Y, Suzuki H, Shibata D. (2009) A database for poplar gene co-expression analysis for systematic understanding of biological processes, including stress responses. J Wood Sci 55: 395–400 [Google Scholar]
- Ouyang S, Zhu W, Hamilton J, Lin H, Campbell M, Childs K, Thibaud-Nissen F, Malek RL, Lee Y, Zheng L, et al. (2007) The TIGR Rice Genome Annotation Resource: improvements and new features. Nucleic Acids Res 35: D883–D887 [DOI] [PMC free article] [PubMed] [Google Scholar]
- Persson S, Wei H, Milne J, Page GP, Somerville CR. (2005) Identification of genes required for cellulose synthesis by regression analysis of public microarray data sets. Proc Natl Acad Sci USA 102: 8633–8638 [DOI] [PMC free article] [PubMed] [Google Scholar]
- Ravasz E, Somera AL, Mongru DA, Oltvai ZN, Barabasi AL. (2002) Hierarchical organization of modularity in metabolic networks. Science 297: 1551–1555 [DOI] [PubMed] [Google Scholar]
- Shannon P, Markiel A, Ozier O, Baliga NS, Wang JT, Ramage D, Amin N, Schwikowski B, Ideker T. (2003) Cytoscape: a software environment for integrated models of biomolecular interaction networks. Genome Res 13: 2498–2504 [DOI] [PMC free article] [PubMed] [Google Scholar]
- Stuart J, Segal E, Koller D, Kim S. (2003) A gene-coexpression network for global discovery of conserved genetic modules. Science 302: 249–255 [DOI] [PubMed] [Google Scholar]
- Wang Y, Hu Z, Yang Y, Chen X, Chen G. (2009) Function annotation of an SBP-box gene in Arabidopsis based on analysis of co-expression networks and promoters. Int J Mol Sci 10: 116–132 [DOI] [PMC free article] [PubMed] [Google Scholar]
- Wei H, Persson S, Mehta T, Srinivasasainagendra V, Chen L, Page GP, Somerville C, Loraine A. (2006) Transcriptional coordination of the metabolic network in Arabidopsis. Plant Physiol 142: 762–774 [DOI] [PMC free article] [PubMed] [Google Scholar]
- Wolfe CJ, Kohane IS, Butte AJ. (2005) Systematic survey reveals general applicability of “guilt-by-association” within gene coexpression networks. BMC Bioinformatics 6: 227. [DOI] [PMC free article] [PubMed] [Google Scholar]
- Yang Y, Harris DP, Luo F, Xiong W, Joachimiak M, Wu L, Dehal P, Jacobsen J, Yang Z, Palumbo AV, et al. (2009) Snapshot of iron response in Shewanella oneidensis by gene network reconstruction. BMC Genomics 10: 131. [DOI] [PMC free article] [PubMed] [Google Scholar]
- Zhang B, Horvath S. (2005) A general framework for weighted gene co-expression network analysis. Stat Appl Genet Mol Biol 4: 17. [DOI] [PubMed] [Google Scholar]
Associated Data
This section collects any data citations, data availability statements, or supplementary materials included in this article.