


Abstract
Objective:
To investigate the mechanisms of spinal cord repair and their relative contribution to clinical recovery in patients with multiple sclerosis (MS) after a cervical cord relapse, using spinal cord 1H-magnetic resonance spectroscopy (MRS) and volumetric imaging.
Methods:
Fourteen patients with MS and 13 controls underwent spinal cord imaging at baseline and at 1, 3, and 6 months. N-acetyl-aspartate (NAA) concentration, which reflects axonal count and metabolism in mitochondria, and the cord cross-sectional area, which indicates axonal count, were measured in the affected cervical region. Mixed effect linear regression models investigated the temporal evolution of these measures and their association with clinical changes. Ordinal logistic regressions identified predictors of recovery.
Results:
Patients who recovered showed a sustained increase in NAA after 1 month. In the whole patient group, a greater increase of NAA after 1 month was associated with greater recovery. Patients showed a significant decline in cord area during follow-up, which did not correlate with clinical changes. A worse recovery was predicted by a longer disease duration at study entry.
Conclusions:
The partial recovery of N-acetyl-aspartate levels after the acute event, which is concurrent with a decline in cord cross-sectional area, may be driven by increased axonal mitochondrial metabolism. This possible repair mechanism is associated with clinical recovery, and is less efficient in patients with longer disease duration. These insights into the mechanisms of spinal cord repair highlight the need to extend spinal cord magnetic resonance spectroscopy to other spinal cord disorders, and explore therapies that enhance recovery by modulating mitochondrial activity.
GLOSSARY
- CI
= confidence interval;
- EDSS
= Expanded Disability Status Scale;
- FOV
= field of view;
- MR
= magnetic resonance;
- MRS
= magnetic resonance spectroscopy;
- MS
= multiple sclerosis;
- NAA
= N-acetyl-aspartate;
- SC
= spinal cord;
- TE
= echo time;
- TI
= inversion time;
- TR
= repetition time.
Improving our understanding of the repair mechanisms after acute, demyelinating spinal cord (SC) lesions is an essential step toward the development of new treatment strategies for patients with SC injury. One possible approach to obtain new insights into SC repair is to apply to patients MRI techniques that provide information on the underlying pathologic processes. Although these techniques are able to quantify tissue damage and repair in the brain,1,2 their application to the SC has been limited because of technical issues.
In a previous cross-sectional study, we described the clinical relevance of the metabolites, such as N-acetyl-aspartate (NAA), measured with 1H-magnetic resonance spectroscopy (MRS) in patients with multiple sclerosis (MS) at the onset of an acute SC relapse.3 However, this study did not explore the mechanisms of repair underlying clinical recovery. After SC injury, neuronal degeneration and metabolic changes are expected to occur, and these can be measured using magnetic resonance (MR) techniques. In fact, irreversible neurodegeneration, including axonal loss and demyelination, is reflected by cervical cord cross-sectional area,4 whereas mitochondrial metabolism, together with axonal density, is reflected by the concentration of NAA.5
We have now performed a longitudinal study on the same patient cohort to address 2 hypotheses: 1) the rate of change in NAA over time is related to clinical recovery, and 2) the rate of change in SC cross-sectional area during the follow-up correlates with clinical changes. Finally, we also investigated whether baseline clinical characteristics, NAA, and SC cross-sectional area predicted recovery.
METHODS
Subjects.
Fourteen patients with a diagnosis of MS6 who fulfilled the following inclusion criteria were recruited from the National Hospital for Neurology and Neurosurgery: 1) acute development of motor signs that were judged to be due to a lesion between C1 and C3, 2) onset within 4 weeks of visit, and 3) presence of at least 1 SC lesion between C1 and C3 documented by MRI and considered to be responsible for clinical signs. Patients were clinically assessed on the Expanded Disability Status Scale (EDSS)7 and underwent the MRI protocol after 1, 3, and 6 months.
Thirteen age- and gender-matched healthy subjects were recruited at baseline and invited to attend follow-up scans after 1, 3, and 6 months.
Protocol approvals and patient consents.
All subjects gave informed, written consent before the study, which was approved by the Joint Ethics Committee of the Institute of Neurology and the National Hospital for Neurology and Neurosurgery.
MRI protocol and processing.
The MRI protocol was performed on a 1.5-T GE scanner (General Electric, Milwaukee, WI) and included the following:
SC T2 and proton density-weighted imaging (repetition time [TR] 3300 milliseconds/echo time [TE] 110 milliseconds and TR 3000 milliseconds/TE 8.9 milliseconds, echo train length 33 and 11, field of view [FOV] 240 × 240 mm2, matrix 256 × 224, interpolated to 512 × 512, 12 contiguous sagittal-oblique and coronal-oblique slices, 3-mm slice thickness). This sequence was used by an expert neuroradiologist (K.A. Miszkiel, FRCP) to identify lesions and cord swelling, which was defined as a bulge in the contour of the SC, when compared with the superior and inferior cord levels on the same sagittal cord image.3 This bulge always corresponded to the lesion which was considered to be responsible for clinical signs. A second observer (O.C.), blinded to image identity, independently reported the presence of the swelling, and the results were in complete agreement with the first observer.
-
1H-MRS obtained with the PROBE (PRESS) sequence (TE 30 milliseconds, 192 averages) with chemical shift selective water suppression, cardiac gating (TR = 3 R-R intervals [approximately 3 s]), and spatial saturation pulses. At each visit, a volume of interest with dimensions of approximately 6 × 8 × 50 mm (2.4 mL) was placed along the main axis of the cord between C1 and C3 on T2 images, as previously described.3 Care was taken in positioning of the voxel at baseline and during subsequent visits.
Analysis of the spectra was performed using LCModel.8 The concentration (millimolar) and the quantification error (as a percentage SD) of the total NAA (equal to NAA plus NAA-glutamate) were obtained, as previously described.3 LCModel estimates were retained if the percentage SD was lower than 20 for NAA, as suggested by the LCmodel manual (version 6.2-0). Two spectra acquired on a patient at 1 month and 3 months and 3 spectra acquired on a control at baseline, 1 month, and 3 months were discarded because they did not meet this criterion. No correction for T1 or T2 relaxation effects was made, but these effects are minimized at short TE and long TR.
A volume-acquired, inversion-prepared, fast spoiled-gradient recalled imaging sequence of the SC (TR 13.2 milliseconds, TE 4.2 milliseconds, inversion time [TI] 450 milliseconds, flip angle 20°, FOV 250 × 250 mm2, matrix 256 × 256, 60 contiguous sagittal slices, 1-mm slice thickness). This sequence was used to calculate the cross-sectional cord area at C2-C3, as previously described9 (figure e-1 on the Neurology® Web site at www.neurology.org).
Statistical analysis.
We used Stata 9.2 (StataCorp LP, College Station, TX; www.stata.com). Additional longitudinal and cross-sectional analyses are reported in appendix e-1.
Longitudinal analyses.
Changes in EDSS between baseline and 6-month follow-up were assessed using the paired sample t test.
To estimate rates of change in the NAA concentration and SC area and their associations with additional covariates of interest, the MR measures were used as response variables in linear mixed regression models, with time as predictor. All time points were included unless otherwise specified.
To explore the associations between rates of change in the MR variables and clinical outcome, patients were divided into 3 groups of roughly equal size: 1) patients who did not recover during the follow-up (EDSS change between 6 months and baseline = 0), 2) patients who improved mildly during the follow-up (range of EDSS change = −0.5 to −1.0), and 3) patients who recovered substantially (range of EDSS change = −1.5 to −2.5). To assess whether rates of changes in MR measures differed according to recovery, patients were divided into those who recovered and those who did not.
NAA concentration: Its temporal evolution and association with clinical changes.
To estimate rates of linear change of NAA in patients and controls, a subject type indicator and type × time interaction terms were used. Because the rate of change of NAA after acute brain injury is known to be nonlinear,10 we examined nonlinearity of change by using a nonlinear saturated mean model. This model does not make any assumption about the changes over time, but it simply fits the mean of the measure at each time point and allows changes between 2 time points to be estimated; it was repeated with baseline cord swelling indicator to correct for this factor.
In patients only, to investigate the association between clinical changes and the rate of change in NAA, an indicator of the EDSS categories and EDSS category × time interactions were used. This model was run with month ≥1 because of the initial decrease in NAA from baseline to 1 month.
SC cross-sectional area: Its temporal evolution and association with clinical changes.
A subject type indicator and type × time interaction terms were used to estimate the difference in the rate of linear changes in cord area between 1) patients and controls, 2) patients who recovered and controls, and 3) patients who did not recover and controls. The same models were also used to calculate the specific rates in each subject group. These models were repeated with an indicator of cord swelling at baseline to adjust for this factor, both over all time points and with month ≥1.
An additional analysis was performed to investigate the influence of cord swelling at baseline on the rate of change in cord area (appendix e-1).
In patients only, to investigate the association between clinical changes and the rate of change in cord area, an indicator of the EDSS categories and EDSS category × time interactions were used. This model was run with month ≥1, to avoid the influence of cord swelling at baseline.
Baseline predictors of clinical outcome.
A multiple ordinal logistic regression model was used with the indicator of the EDSS categories as the response variable, and the clinical and MR measures at baseline (EDSS, disease duration, age, gender, NAA, cross-sectional cord area, number of cervical T2 lesions), together with cord swelling, as covariates. The Spearman ρ correlation coefficient was used to explore the relationship between NAA changes after 1 month and disease duration.
RESULTS
Subjects.
Of the 14 patients recruited at baseline (mean age = 35.3 [SD 8.16] years; 9 women; 13 relapsing-remitting and 1 secondary-progressive MS; mean disease duration = 9.2 [SD 5.1] years; median EDSS at baseline = 4 [range 2.5–6.5]; median EDSS at 6 months = 3.5 [range 1–6.5]), 1 patient decided against having more scans but attended the hospital for the clinical assessment at 6 months. One patient did not attend his 1-month follow-up visit. Because of technical problems with the scanner, MR data were not acquired in 1 patient at 1-month follow-up. The mean intervals between baseline and 1 month, 1 month and 3 months, and 3 months and 6 months were 34.1 (SE 0.6), 64.3 (SE 1.3), and 102 (SE 2.8) days. A detailed description of patient symptoms and conventional MRI features at baseline and at 6 months are outlined in a previous publication.3 Of the 13 patients who were using interferon-beta at study entry, 1 switched to mitoxantrone before his last follow-up visit. One patient was using glatiramer acetate during the study. Cord swelling was seen in 5 patients at baseline, but resolved in 4 cases after 1 month. One patient, who had a second relapse during the study, had persistent swelling during the study.
All 13 age- and gender-matched controls scanned at baseline (mean age = 40.9 [SD 12.6] years; 8 women) attended their follow-up scans.
Longitudinal analyses.
The patient group showed a reduction in EDSS during the study (median EDSS change = −1.0 [range 0 to −2.5], p = 0.002). Five patients did not improve because their EDSS did not change over time, 4 patients improved mildly, and 5 patients recovered substantially. Therefore, 9 patients were considered to have improved, whereas 5 remained unchanged.
NAA concentration: Its temporal evolution and association with clinical changes.
Spectra obtained during the follow-up from a patient who recovered are shown in figure 1. The NAA levels in each group at each time point are given in the table.

Figure 1 Spinal cord N-acetyl-aspartate concentration at each time point
Spectroscopic volume of interest between C1 and C3 on coronal images at baseline (A), 1 month (B), 3 months (C), and 6 months (D) in a patient who recovered. Corresponding spectra obtained by LCModel analyses at baseline (E), 1 month (F), 3 months (G), and 6 months (H). The N-acetyl-aspartate (NAA) was 4.1 mM (%SD 12) at baseline (E), 3.6 mM (%SD 11) at 1 month (F), 3.7 mM (%SD 11) at 3 months (G), and 4.0 mM (%SD 11) at 6 months (H). The other peaks near NAA (such as the resonance at 2.1–2.5 ppm) seem to change concordantly, but changes in these peaks were not investigated because they are not reliably quantified in the spinal cord using our methodology.
Table Spinal cord cross-sectional area (square millimeters) and N-acetyl-aspartate (millimolar) at each time point in each group
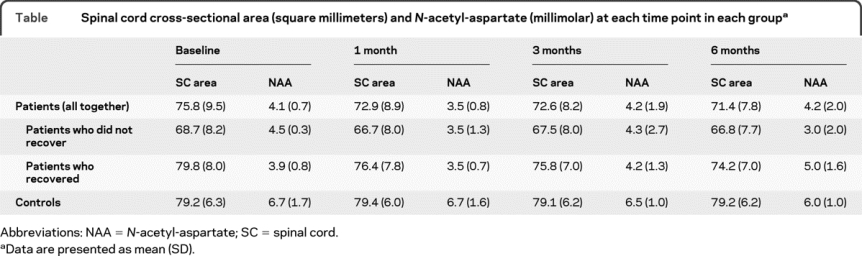
There were no significant NAA linear changes in patients and controls, and no difference in the rate of NAA linear change between groups. Conversely, we found evidence of nonlinearity in patients who recovered (p = 0.046), who showed a gradual increase of NAA after 1 month that was sustained up to 6 months (figure 2). Patients who did not improve showed an overall (albeit nonsignificant) NAA decrease over time.

Figure 2 Longitudinal changes in N-acetyl-aspartate levels
Mean N-acetyl-aspartate (NAA) (millimolar) by month with SE in controls, patients who recovered, and patients who did not recover. Changes in NAA seem to be nonlinear. In particular, in patients who recovered during the follow-up period, there was a significant and sustained increase of NAA from baseline to 6 months and from 1 month to 6 months.
The analysis of the mean changes of NAA between time points in patients who recovered showed that 1) there was a nonsignificant decrease of NAA from baseline to 1 month, and 2) there was an increase of NAA from 1 month to 6 months (by 1.67 mM per month, p = 0.001, 95% confidence interval [CI] 0.68–2.65; figure 2). These results did not change when correcting for cord swelling.
Patients who had a greater clinical recovery showed a greater increase of NAA after 1 month (figure 3): there was a mean increase of NAA of 0.29 mM per month (p = 0.002, 95% CI 0.107–0.481) per category of EDSS reduction (or greater extent of recovery).

Figure 3 Correlations between clinical recovery and either N-acetyl-aspartate changes or disease duration
(A) Plot of the raw Expanded Disability Status Scale (EDSS) changes between 6 months and baseline vs the N-acetyl-aspartate (NAA) changes (millimolar) between 6 months and 1 month (R2 = 0.57). This graph shows that the increase in NAA after 1 month is associated with greater extent of recovery (i.e., greater EDSS reduction). (B) Plot of the raw EDSS changes between 6 months and baseline vs the disease duration (years) (R2 = 0.39). This graph shows that a longer disease duration at baseline is associated with lower extent of recovery (i.e., smaller EDSS reduction). Fitted lines are shown.
SC cross-sectional area: Its temporal evolution and association with clinical changes.
The SC area in each group at each time point is given in the table. Patients showed a greater decline of SC area compared with controls (by −0.54 mm2 per month, p < 0.0001, 95% CI −0.328 to −0.745). In patients, the SC area declined during the entire follow-up (by −0.56 mm2 per month, p < 0.0001, 95% CI −0.7 to −0.41) and after 1 month (by −0.42 mm2 per month, p < 0.0001, 95% CI −0.604 to −0.229). Both patients who recovered and those who did not showed a greater decline of cord area during the follow-up compared with controls (figure 4; patients who recovered vs controls: by −0.66 mm2 per month, p < 0.0001, 95% CI −0.89 to −0.43; patients who did not recover vs controls: by −0.32 mm2 per month, p < 0.03, 95% CI −0.61 to −0.03). In both groups of patients, the cord area declined during the study (patients who recovered: by −0.68 mm2 per month, p < 0.0001, 95% CI −0.87 to −0.50; patients who did not recover: by −0.34 mm2 per month, p = 0.007, 95% CI −0.59 to −0.09). In controls, the cord area did not significantly change during the study (figure 4).

Figure 4 Longitudinal changes in spinal cord cross-sectional area
Mean spinal cord cross-sectional area (square millimeters) by month with SE in controls, patients who recovered, and patients who did not recover. Both patients who recovered and those who did not showed a significantly greater decline of spinal cord area over time compared with controls, which remained significant when models were repeated with data collected after 1 month and adjusted for baseline cord swelling.
When the same models were repeated correcting for baseline cord swelling, the gradient of cord decline in patients who recovered became less steep (−0.39 mm2 per month, p = 0.008, 95% CI −0.67 to −0.1).
There was no significant association between clinical changes and the rate of change in cord area.
Baseline predictors of clinical outcome.
Disease duration significantly predicted clinical outcome independently from all the other variables considered; the odds ratio of being in a category of less extent of recovery was 1.43 for each year of increment of disease duration (p = 0.026, 95% CI 1.04–1.96; figure 3).
A longer disease duration was associated with smaller increases in NAA after 1 month (ρ = −0.7, p = 0.027).
DISCUSSION
This study provides new insights into the mechanisms of SC repair and raises the possibility that increased mitochondrial metabolism is an important component of repair. We found that patients who recovered showed a sustained increase in NAA levels after 1 month, which is in agreement with the findings of studies that have followed up brain lesions in natural history studies,10–12 and brain volumes of interest in patients treated with interferon-beta and glatiramer acetate.13,14 Because NAA concentration reflects both axonal integrity15 and axonal mitochondrial metabolism,16 an increase in NAA levels, occurring in parallel with a decline in cord cross-sectional area that suggests underlying neurodegeneration,4 may be driven by increased axonal mitochondrial metabolism. In addition, there was no correlation between NAA concentration and the SC cross-sectional area at any time point during the study, which not only confirms previous SC17 and brain studies,18,19 but also suggests that these 2 measures reflect, at least in part, independent pathologic mechanisms.
The most striking finding of this study is that this increase in NAA levels from 1 month onward correlates with clinical recovery. In particular, given that NAA is produced by the mitochondria, together with adenosine triphosphate production and oxygen consumption,16 the initial decrease in NAA (during the first month of this study) is in keeping with the decreased mitochondrial activity that has been observed in the presence of inflammatory mediators,20 whereas its subsequent increase may reflect the enhanced mitochondrial activity that is necessary to maintain axonal conduction. The restoration of nerve conduction is considered to be one of the repair mechanisms that spontaneously occurs after an inflammatory demyelinating lesion. The demonstration of an increased number of mitochondria20 and increased mitochondrial mass and complex IV activity within demyelinated axons21 is consistent with the hypothesis that increased mitochondrial activity is an adaptive mechanism in response to demyelination.
There is evidence that points to NAA having a role in the production of the myelin.5 Further, a small concentration of NAA derives from proliferating oligodendrocyte progenitor cells, which, however, reduce significantly over time, and a very low level of NAA immunoreactivity has been detected in oligodendrocytes in adult rats.5 Therefore, it is possible that the observed increase in NAA may relate to ongoing remyelination. However, a significant development of cord atrophy during the follow-up was detected, and this would be inconsistent with remyelination as the main repair mechanism. In fact, it has been suggested that demyelination is the main determinant of cord atrophy.22
Another interesting finding is that the entire patient group, as well as patients who recovered and those who did not, developed a decline in cord area over time. This decline in cord area remained significant not only when we corrected for the presence of cord swelling at baseline (which was seen in 5 of 14 patients), but also when we repeated the analysis with data collected after 1 month. Our additional analysis has shown that, although the presence of swelling at baseline influenced the reduction of cord area occurring during the first month of follow-up, it is unlikely that this alone accounted for the development of cord atrophy between 1 month and 6 months. Therefore, our findings suggest that cord atrophy occurs after acute SC events, mirroring the results of brain and optic nerve longitudinal studies.4,23 Optical coherence tomography studies have proved that a reduction of retinal fiber layer occurs after optic neuritis.24,25
A lack of correlation between decline in cord area and clinical changes confirms results of optic nerve studies of patients with optic neuritis,23,26 suggesting that other mechanisms contribute to clinical outcome despite the loss of optic nerve fibers. However, the effect of cord atrophy on clinical outcome may become evident after a long period of time.
Disease duration was the only significant, independent predictor of recovery. In particular, patients with longer disease duration were less likely to improve clinically, and a longer disease duration was associated with smaller increases in NAA levels after 1 month. These findings suggest that the endogenous repair mechanisms, which are reflected in the increase in NAA levels, become less efficient over time.
A technical limitation of this study is that our spectroscopic voxel encompassed the gray and white matters, and the lesion and the normal-appearing tissues. The SD of the NAA concentration does not seem to be entirely consistent over time, because it slightly increases in patients and decreases in controls, despite the fact that subjects were scanned over the same period. This observation, together with the acquisition of a subject- and position-specific calibration factor at each time point3 and weekly phantom calibration data (results not shown), suggests that the intersubject variability, especially in the patient group, rather than a scanner-dependent factor, is the main reason behind the apparent (and small) changes in reliability of the measure over time.
From a clinical point of view, the number of patients included in this study is small. However, more than 90% of the scans acquired in 27 subjects over the follow-up were included in the analysis, and patients were selected to be representative of patients at the onset of a cervical cord relapse. Further, the longitudinal analyses used here have the advantage of maximizing statistical efficiency by using all available data points.
In the future, it would be interesting to extend SC spectroscopy to patients with a clinically isolated syndrome localized to the cervical cord, to investigate the NAA behavior over time. SC MRS can be further optimized on higher field scanners and may be implemented in treatment trials that aim to enhance SC repair. A better understanding of the mitochondrial mechanisms that contribute to damage and repair may lead to the development of therapies that target mitochondria.27
AUTHOR CONTRIBUTIONS
Dr. Ciccarelli and Dr. Altmann completed the statistical analysis.
ACKNOWLEDGMENT
The authors thank the radiographers for technical assistance with the MRI scans, the clinical fellows for their assessment of patients with MS, the MS Relapse Team at the National Hospital for Neurology and Neurosurgery for recruiting patients, K.A. Miszkiel, FRCP, for reviewing the conventional scans, and the subjects for taking part in this study.
DISCLOSURE
Dr. Ciccarelli serves as Clinical Editor of Current Medical Literature-Multiple Sclerosis; and receives research support from the Wellcome Trust, the UCLH/UCL Comprehensive Biomedical Research Centre, and the Multiple Sclerosis Society. Mr. Altmann and Dr. McLean report no disclosures. Ms. Wheeler-Kingshott receives research support from the Wellcome Trust. Ms. Wimpey reports no disclosures. Prof. Miller serves on scientific advisory boards for Biogen Idec, Novartis, GlaxoSmithKline, Bayer Schering Pharma, and the NIH; has received funding for travel from Biogen Idec, GlaxoSmithKline, Novartis, and Bayer Schering Pharma; serves as Co-Chief Editor of the Journal of Neurology; receives publishing royalties from McAlpine's Multiple Sclerosis, 4th ed. (Elsevier, 2006); has received speaker honoraria from Bayer Schering Pharma and Teva Pharmaceutical Industries Ltd.; serves as a consultant to GlaxoSmithKline; and receives research support from Biogen Idec, Novartis, GlaxoSmithKline, the NIHR UCLH Comprehensive Biomedical Research Centre, and the MS Society of Great Britain and Northern Ireland. Prof. Thompson serves on scientific advisory boards for and has received funding for travel from the NIHR, MSIF (Chairman), National MS Society (US), MS Society of the UK, Eisai Inc., Novartis, Teva Pharmaceutical Industries Ltd., and Weleda; serves as Editor-in-Chief of Multiple Sclerosis, and on editorial advisory boards for Lancet Neurology and Current Medical Literature-Multiple Sclerosis; receives publishing royalties from NeuroRehab Parkinson's Disease (Taylor & Francis, 2003), NeuroRehab Stroke (Taylor & Francis, 2004), NeuroRehab Multiple Sclerosis (Taylor & Francis, 2006), Frontiers in Multiple Sclerosis (Dunitz, 1999), and Multiple Sclerosis, Contributor (Elsevier, 2008); has received speaker honoraria from sanofi-aventis, Merck Serono, and Bayer Schering Pharma; and receives research support from the NIHR Comprehensive Biomedical Research Centre, Medical Research Council, Wellcome Trust, and the National MS Society (US).
Supplementary Material
Address correspondence and reprint requests to Dr. Olga Ciccarelli, Department of Brain Repair and Rehabilitation, Institute of Neurology, University College London, Queen Square, London WC1N 3BG, UK o.ciccarelli@ion.ucl.ac.uk
Editorial, page 710
Supplemental data at www.neurology.org
e-Pub ahead of print on January 27, 2010, at www.neurology.org.
Study funding: Supported by the Wellcome Trust, grant 074618/Z/04/Z. The MS NMR Research Unit is supported by the MS Society of Great Britain and Northern Ireland. This work was undertaken at UCLH/UCL, which received a proportion of funding from the Department of Health's NIHR Biomedical Research Centres funding scheme.
Disclosure: Author disclosures are provided at the end of the article.
Received July 10, 2009. Accepted in final form November 30, 2009.
REFERENCES
- 1.Bakshi R, Thompson AJ, Rocca MA, et al. MRI in multiple sclerosis: current status and future prospects. Lancet Neurol 2008;7:615–625. [DOI] [PMC free article] [PubMed] [Google Scholar]
- 2.Barkhof F, Calabresi PA, Miller DH, Reingold SC. Imaging outcomes for neuroprotection and repair in multiple sclerosis trials. Nat Rev Neurol 2009;5:256–266. [DOI] [PubMed] [Google Scholar]
- 3.Ciccarelli O, Wheeler-Kingshott CA, McLean MA, et al. Spinal cord spectroscopy and diffusion-based tractography to assess acute disability in multiple sclerosis. Brain 2007;130(pt 8):2220–2231. [DOI] [PubMed] [Google Scholar]
- 4.Miller DH, Barkhof F, Frank JA, Parker GJ, Thompson AJ. Measurement of atrophy in multiple sclerosis: pathological basis, methodological aspects and clinical relevance. Brain 2002;125(pt 8):1676–1695. [DOI] [PubMed] [Google Scholar]
- 5.Moffett JR, Ross B, Arun P, Madhavarao CN, Namboodiri AM. N-acetylaspartate in the CNS: from neurodiagnostics to neurobiology. Prog Neurobiol 2007;81:89–131. [DOI] [PMC free article] [PubMed] [Google Scholar]
- 6.McDonald WI, Compston A, Edan G, et al. Recommended diagnostic criteria for multiple sclerosis: guidelines from the International Panel on the diagnosis of multiple sclerosis. Ann Neurol 2001;50:121–127. [DOI] [PubMed] [Google Scholar]
- 7.Kurtzke JF. Rating neurologic impairment in multiple sclerosis: an expanded disability status scale (EDSS). Neurology 1983;33:1444–1452. [DOI] [PubMed] [Google Scholar]
- 8.Provencher SW. Estimation of metabolite concentrations from localized in vivo proton NMR spectra. Magn Reson Med 1993;30:672–679. [DOI] [PubMed] [Google Scholar]
- 9.Losseff NA, Webb SL, O'Riordan JI, et al. Spinal cord atrophy and disability in multiple sclerosis: a new reproducible and sensitive MRI method with potential to monitor disease progression. Brain 1996;119(pt 3):701–708. [DOI] [PubMed] [Google Scholar]
- 10.De Stefano N, Matthews PM, Arnold DL. Reversible decreases in N-acetylaspartate after acute brain injury. Magn Reson Med 1995;34:721–727. [DOI] [PubMed] [Google Scholar]
- 11.Davie CA, Hawkins CP, Barker GJ, et al. Serial proton magnetic resonance spectroscopy in acute multiple sclerosis lesions. Brain 1994;117(pt 1):49–58. [DOI] [PubMed] [Google Scholar]
- 12.Mader I, Roser W, Kappos L, et al. Serial proton MR spectroscopy of contrast-enhancing multiple sclerosis plaques: absolute metabolic values over 2 years during a clinical pharmacological study. AJNR Am J Neuroradiol 2000;21:1220–1227. [PMC free article] [PubMed] [Google Scholar]
- 13.Narayanan S, De Stefano N, Francis GS, et al. Axonal metabolic recovery in multiple sclerosis patients treated with interferon beta-1b. J Neurol 2001;248:979–986. [DOI] [PubMed] [Google Scholar]
- 14.Khan O, Shen Y, Caon C, et al. Axonal metabolic recovery and potential neuroprotective effect of glatiramer acetate in relapsing-remitting multiple sclerosis. Mult Scler 2005;11:646–651. [DOI] [PubMed] [Google Scholar]
- 15.Bjartmar C, Kidd G, Mork S, Rudick R, Trapp BD. Neurological disability correlates with spinal cord axonal loss and reduced N-acetyl aspartate in chronic multiple sclerosis patients. Ann Neurol 2000;48:893–901. [PubMed] [Google Scholar]
- 16.Bates TE, Strangward M, Keelan J, Davey GP, Munro PM, Clark JB. Inhibition of N-acetylaspartate production: implications for 1H MRS studies in vivo. Neuroreport 1996;7:1397–1400. [PubMed] [Google Scholar]
- 17.Blamire AM, Cader S, Lee M, Palace J, Matthews PM. Axonal damage in the spinal cord of multiple sclerosis patients detected by magnetic resonance spectroscopy. Magn Reson Med 2007;58:880–885. [DOI] [PubMed] [Google Scholar]
- 18.Cader S, Johansen-Berg H, Wylezinska M, et al. Discordant white matter N-acetylasparate and diffusion MRI measures suggest that chronic metabolic dysfunction contributes to axonal pathology in multiple sclerosis. Neuroimage 2007;36:19–27. [DOI] [PubMed] [Google Scholar]
- 19.Rovaris M, Gallo A, Falini A, et al. Axonal injury and overall tissue loss are not related in primary progressive multiple sclerosis. Arch Neurol 2005;62:898–902. [DOI] [PubMed] [Google Scholar]
- 20.Andrews H, White K, Thomson C, et al. Increased axonal mitochondrial activity as an adaptation to myelin deficiency in the Shiverer mouse. J Neurosci Res 2006;83:1533–1539. [DOI] [PubMed] [Google Scholar]
- 21.Mahad DJ, Ziabreva I, Campbell G, et al. Mitochondrial changes within axons in multiple sclerosis. Brain 2009;132(pt 5):1161–1174. [DOI] [PMC free article] [PubMed] [Google Scholar]
- 22.Bot JC, Blezer EL, Kamphorst W, et al. The spinal cord in multiple sclerosis: relationship of high-spatial-resolution quantitative MR imaging findings to histopathologic results. Radiology 2004;233:531–540. [DOI] [PubMed] [Google Scholar]
- 23.Hickman SJ, Toosy AT, Jones SJ, et al. A serial MRI study following optic nerve mean area in acute optic neuritis. Brain 2004;127(pt 11):2498–2505. [DOI] [PubMed] [Google Scholar]
- 24.Trip SA, Schlottmann PG, Jones SJ, et al. Retinal nerve fiber layer axonal loss and visual dysfunction in optic neuritis. Ann Neurol 2005;58:383–391. [DOI] [PubMed] [Google Scholar]
- 25.Pulicken M, Gordon-Lipkin E, Balcer LJ, Frohman E, Cutter G, Calabresi PA. Optical coherence tomography and disease subtype in multiple sclerosis. Neurology 2007;69:2085–2092. [DOI] [PubMed] [Google Scholar]
- 26.Inglese M, Ghezzi A, Bianchi S, et al. Irreversible disability and tissue loss in multiple sclerosis: a conventional and magnetization transfer magnetic resonance imaging study of the optic nerves. Arch Neurol 2002;59:250–255. [DOI] [PubMed] [Google Scholar]
- 27.Mahad D, Lassmann H, Turnbull D. Review: mitochondria and disease progression in multiple sclerosis. Neuropathol Appl Neurobiol 2008;34:577–589. [DOI] [PMC free article] [PubMed] [Google Scholar]
Associated Data
This section collects any data citations, data availability statements, or supplementary materials included in this article.