

Abstract
Objective
Osteocalcin has been reported to influence insulin secretion in experimental animals. We investigated whether serum osteocalcin was associated with measures of insulin resistance, circulating adipokine levels, and the presence of metabolic syndrome (MetSyn).
Methods and Results
Serum osteocalcin was measured by solid-phase sandwich immunoassay in 1284 blacks (64±9 years; 71% women) and 1209 non-Hispanic whites (59±10 years; 57% women) belonging to hypertensive sibships. MetSyn was defined per Adult Treatment Panel III criteria. The prevalence of MetSyn was 50% in blacks and 49% in non-Hispanic whites. In each ethnic group, after adjustment for age and gender, osteocalcin levels were inversely correlated with body mass index, fasting glucose and insulin, homeostasis model assessment of insulin resistance, triglycerides, and leptin, and positively correlated with adiponectin (P<0.001 for each variable). In multivariable regression analyses that adjusted for age, gender, smoking, serum creatinine, and statin and estrogen use, osteocalcin levels in the highest quartile (compared with the lowest quartile) were associated with a lower odds ratio (OR) of having MetSyn: OR (95% CI) in blacks, 0.33 (0.23 to 0.46); OR in non-Hispanic whites, 0.43 (0.31 to 0.63).
Conclusion
Serum osteocalcin is associated with measures of insulin resistance, adipokine levels, and the presence of MetSyn, suggesting a novel cross-talk between bone and adipose tissue.
Keywords: adiponectin, insulin resistance, leptin, metabolic syndrome, osteocalcin
Emerging data suggest that bone mass regulates energy and glucose homeostasis via humoral mechanisms.1,2 Conversely, fat mass is (inversely) associated with bone mineral density, after adjustment for the mechanical loading effect of total weight on bone mass.3 Recent studies have unraveled some of the complex mechanisms by which bone, adipose tissue, and the brain act in concert to regulate energy expenditure and glucose homeostasis.1,2,4 Osteoblasts appear to regulate energy expenditure by acting on adipocytes and pancreatic islet cells via osteocalcin, a 49-residue polypeptide.5 In turn, adipose tissue may also influence bone remodeling by regulating the activity of osteoblasts through adipokines, including leptin6,7 and adiponectin.8
In animal studies, osteocalcin has been associated with pancreatic islet β-cell proliferation and insulin expression, adiponectin gene expression in white adipose tissue, and hypoglycemia.1,4,7 In humans, circulating osteocalcin levels have been reported to be inversely associated with measures of insulin resistance (fasting insulin and glucose levels and homeostasis model assessment of insulin resistance [HOMA-IR]) and adiposity (body mass index [BMI] and fat percentage).9–11
Whether serum osteocalcin is associated with circulating adipokine (adiponectin and leptin) levels and the presence of metabolic syndrome (MetSyn) is not known. MetSyn is a major public health burden, with nearly a quarter of the world’s adult population being affected.12 The syndrome is associated with a 5-fold higher risk of developing type 2 diabetes (T2D)13 and 2- to 3-fold higher risk of developing cardiovascular disease.14 The present study was undertaken to investigate whether circulating osteocalcin is associated with measures of insulin resistance (fasting insulin and glucose levels and HOMA-IR), plasma adipokine (adiponectin and leptin) levels, and MetSyn. The study was conducted in a biethnic cohort of adults belonging to sibships ascertained on the basis of hypertension and well characterized for the presence of MetSyn and its traits.
Methods
The present investigation was part of the Proteomic Markers of Arteriosclerosis Study,15 which aims to identify novel protein markers associated with metabolic and vascular disease phenotypes in well-characterized black and non-Hispanic white individuals belonging to hypertensive sibships. Participants, including 1284 blacks from Jackson, Miss, and 1209 non-Hispanic whites from Olmsted County, Minn, belonged to the Genetic Epidemiology Network of Arteriopathy Study16—a multicenter initiative to identify genes influencing blood pressure (BP) levels and target organ damage in hypertension. The study was approved by the institutional review boards of the University of Mississippi Medical Center (Jackson, Miss) and the Mayo Clinic (Rochester, Minn). Written informed consent was obtained from each participant.
Height was measured by stadiometer, weight was measured by electronic balance, and BMI was calculated as weight in kilograms divided by the square of height in meters. “Ever” smoking was defined as having smoked more than 100 cigarettes. Resting systolic BP and diastolic BP were measured by random zero sphygmomanometer (Hawksley and Sons, London, United Kingdom) after participants had rested for at least 10 minutes in the supine position. The diagnosis of hypertension was established based on BP levels measured at the study visit (≥ 140/90 mm Hg) or a prior diagnosis of hypertension and current treatment with antihypertensive medications. T2D was considered present if the subject had history of T2D, or was being treated with insulin or oral agents, or had a fasting glucose level ≥ 126 mg/dL. We constructed a physical activity score by considering the responses to questions about how many hours per day of heavy activity, moderate activity, and light activity the participant engaged in. Specifically, the physical activity score was derived as follows: 3×heavy+2×moderate+light (hours). Information about the use of BP medications and statins was obtained from the participants at the time of the study visit.
Blood was collected by venipuncture after an overnight fast, and the plasma/serum samples were stored at −80°C until they were analyzed. Serum total cholesterol and high-density lipoprotein (HDL) cholesterol were measured by standard enzymatic methods. Insulin level was determined by a radioimmunoassay kit (Linco Research, St. Charles, Mo). The sensitivity of the assay was 0.03 μU/mL, and the interassay coefficient of variation (CV) was <10%. HOMA-IR was calculated as insulin (μIU/mL)×(glucose [mg/dL]×0.055/22.5).17 MetSyn was defined based on the Adult Treatment Panel III definition.18,19
Measurement of Plasma Adipokine and Serum Osteocalcin Levels
Adiponectin was measured using a double antibody radioimmunoassay kit (Linco Research). Intraassay CVs were 17%, 4.7%, and 7.3% at 5.1, 29.9, and 119 μg/mL, respectively, and interassay CVs were 18.4% and 13% at 1.6 and 11.6 μg/mL. Leptin was measured by double antibody radioimmunoassay (Linco Research). Intraassay CVs were 6.1%, 7.7%, and 6.3% at 2.48, 1.35, and 0.24 nmol/L, and interassay CVs were 11% and 13% at 1.28 and 0.19 nmol/L. Osteocalcin was measured in the serum as part of a triple analyte multiplex solid-phase sandwich immunoassay, using an antihuman osteocalcin antibody, on a Sector Imager 2400 (Meso-Scale Discoveries, Gaithersburg, Md). Intraassay CVs were 5.7% and 5.8% at 2.2 and 5.55 nmol/L, and interassay CVs were 21.1% and 19.3% at 2.29 and 6.14 nmol/L. We excluded 40 blacks and 28 non-Hispanic white participants who were on coumadin at the time of blood draw. Osteocalcin undergoes vitamin K–mediated posttranslational γ-carboxylation, which is inhibited by coumadin.5,20 The humoral actions of osteocalcin are, however, mediated by its noncarboxylated form.2
Statistical Methods
Statistical analyses were carried out using the SAS software package, version 9.1 (SAS Institute, Cary NC). Because of the presence of sibships in the sample, regression analyses were performed using generalized estimating equations to correct for intrafamilial correlations.21 Continuous data were summarized as either mean±SD or median and quartiles, and categorical data were expressed as percentages. All analyses were stratified by ethnicity. Serum creatinine and alcohol intake were log transformed to reduce skewness. We calculated Spearman correlation coefficients (adjusted for age and gender) between serum osteocalcin and the following variables: (1) conventional risk factors for cardiovascular disease: total and HDL cholesterol, triglycerides, systolic BP, smoking, and T2D; (2) measures of adiposity and insulin resistance: BMI, waist circumference, fasting blood sugar, insulin level, and HOMA-IR; (3) metabolic score, based on the number of MetSyn traits (Adult Treatment Panel III criteria) present in each study participant, ranging from 0 to 5; (4) lifestyle variables: physical activity score, alcohol intake, and years of education; (5) adipokines: adiponectin and leptin levels; and (6) medication use: statin and estrogen use.
We constructed multivariable logistic regression models (using generalized estimating equations) in each ethnic group to assess whether serum osteocalcin levels were independently associated with the presence of MetSyn. We calculated the odds ratio (OR) for the presence of MetSyn in quartiles of osteocalcin, with participants in the lowest quartile of osteocalcin considered the referent group. Adjustments were performed for (1) age and gender, and (2) age, gender, serum creatinine, smoking, statin use, history of myocardial infarction/stroke, lifestyle variables (physical activity score and years of education), and estrogen use. The above analyses were repeated in nondiabetic individuals in each ethnic group. A 2-sided probability value of <0.05 was used for statistical significance. We also evaluated the association of serum osteocalcin levels with the metabolic score, using the χ2 statistic to obtain the probability value for the trend (Figure 1).
Figure 1.
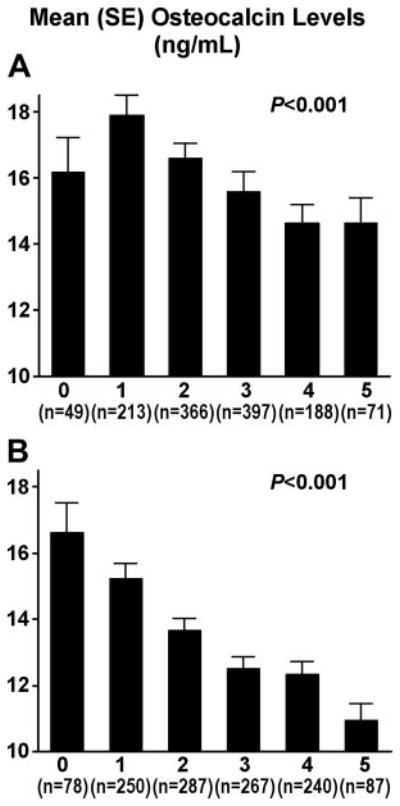
Association of serum osteocalcin levels with the number of MetSyn traits in blacks (A) and non-Hispanic whites (B).
Results
There was a greater proportion of women than men in both black and non-Hispanic white cohorts, and the blacks were older (Table 1). After adjustment for age and gender, blacks had a higher prevalence of T2D than their non-Hispanic white counterparts and lower use of statins. However, the prevalence of MetSyn was similar in the 2 ethnic groups. Serum osteocalcin and plasma leptin levels were higher in blacks, whereas plasma adiponectin levels were higher in non-Hispanic whites (Table 1; P<0.001 for each comparison).
Table 1.
Participant Characteristics (n=2493)
| Blacks (n=1284) | Non-Hispanic Whites (n=1209) | |
|---|---|---|
| Age, years | 63.5±9.3 | 58.7±10.1 |
| Men, n (%) | 374 (29.1) | 518 (42.8) |
| BMI, kg/m2 | 31.5±6.6 | 30.8±6.3 |
| Waist circumference, cm | 103.4±14.5 | 100.6±15.9 |
| Plasma glucose, mmol/L | 5.5 (5.0, 6.5) | 5.4 (5.1, 6.0) |
| Plasma insulin, pmol/L | 45.84 (27.1, 80.6) | 43.3 (27.8, 70.8) |
| HOMA-IR | 1.76 (0.97, 3.37) | 1.58 (0.94, 2.7) |
| T2D, n (%) | 379 (29.5) | 176 (14.6) |
| Total cholesterol, mmol/L | 5.2±1.1 | 5.1±0.9 |
| HDL cholesterol, mmol/L | 1.5±0.47 | 1.34±0.39 |
| Triglycerides, mmol/L | 1.34±0.78 | 1.77±1.1 |
| Hypertension, n (%) | 1022 (79.6) | 877 (72.5) |
| Systolic BP, mm Hg | 138.5±20.9 | 131.1±17.1 |
| Diastolic BP, mm Hg | 79.1±10.8 | 73.8±9.2 |
| Serum creatinine, μmol/L | 78.7±30.1 | 78.7±23 |
| Physical activity score | 9.8±3.4 | 13.3±5.2 |
| Smoking, n (%) | 522 (40.7) | 589 (48.7) |
| Education, years | 12.1±3.6 | 13.4±2.3 |
| Alcohol intake, oz/month | 1.5±5.5 | 5.7±10.7 |
| History of MI/stroke, n (%) | 112 (8.7) | 80 (6.6) |
| Statin use, n (%) | 229 (17.8) | 350 (28.9) |
| Estrogen use, n (%) | 218 (16.9) | 272 (22.5) |
| Coumadin use, n (%) | 40 (3.0) | 28 (2.3) |
| Adiponectin, μg/mL | 9.7 (6.9, 13.4) | 12.3 (8.9, 16.1) |
| Leptin, nmol/L | 24.04 (12.1–37.2) | 14.8 (8.2–26.9) |
| Osteocalcin, nmol/L | 14.7 (10.3–20.0) | 12.4 (9.1–16.9) |
Continuous variables are presented as mean±standard deviation or median and interquartile range, whereas categorical variables are presented as counts and percentages. MI indicates myocardial infarction. Conversion factors (SI units to metric units): glucose, mmol/L÷0.0555=mg/dL; insulin, μIU/ml÷6.945=pmol/L; total and HDL cholesterol, mmol/L÷0.0259=mg/dL; triglyceride, mmol/L÷0.0113=mg/dL; creatinine, mmol/L÷88.4=mg/dL; leptin, nmol/L÷0.0625=ng/mL; osteocalcin, nmol/L÷0.171=ng/mL (SI conversion not available for adiponectin).
In blacks, after adjustment for age and gender, serum osteocalcin levels were inversely correlated with BMI, waist circumference, fasting plasma glucose and insulin levels, HOMA-IR, serum triglycerides, presence of T2D, metabolic score, and plasma leptin, and they were positively correlated with plasma adiponectin levels (P<0.05 for each variable; Table 2). After additional adjustment for BMI, serum osteocalcin levels remained inversely correlated with fasting plasma glucose, HOMA-IR, presence of T2D, and serum triglycerides and positively correlated with plasma adiponectin levels (P<0.05 for each variable; data not shown).
Table 2.
Age- and Gender-Adjusted (Spearman) Correlations Between Osteocalcin and Select Variables
| Variable | Blacks (n=1284) |
Non-Hispanic Whites (n=1209) |
||
|---|---|---|---|---|
| r | P | r | P | |
| Physical activity score | 0.003 | 0.92 | 0.07 | 0.011 |
| Waist circumference | −0.14 | <0.001 | −0.19 | <0.001 |
| BMI | −0.16 | <0.001 | −0.17 | <0.001 |
| Fasting serum glucose | −0.15 | <0.001 | −0.14 | <0.001 |
| Fasting plasma insulin | −0.10 | <0.001 | −0.15 | <0.001 |
| HOMA-IR | −0.12 | <0.001 | −0.17 | <0.001 |
| T2D | −0.17 | <0.001 | −0.14 | <0.001 |
| HDL cholesterol | 0.05 | 0.92 | 0.03 | 0.37 |
| Triglycerides | −0.07 | 0.01 | −0.19 | <0.001 |
| Systolic BP | 0.04 | 0.156 | −0.03 | 0.42 |
| Diastolic BP | 0.10 | <0.001 | 0.05 | 0.040 |
| Metabolic score | −0.17 | <0.001 | −0.20 | <0.001 |
| Education, years | −0.02 | 0.55 | 0.06 | 0.045 |
| Smoking status | −0.03 | 0.23 | −0.04 | 0.080 |
| Alcohol intake | −0.04 | 0.11 | −0.02 | 0.45 |
| Statin use | −0.03 | 0.23 | −0.08 | 0.004 |
| RAAS blocker | −0.08 | 0.003 | −0.08 | 0.001 |
| Diuretic | −0.14 | <0.001 | −0.13 | <0.001 |
| Beta blocker | −0.06 | 0.03 | −0.08 | 0.009 |
| Aspirin | −0.002 | 0.93 | −0.08 | 0.004 |
| Log adiponectin | 0.15 | <0.001 | 0.16 | <0.001 |
| Log leptin | −0.08 | 0.003 | −0.22 | <0.001 |
n=1095 for blacks and n=1181 for non-Hispanic whites. RAAS indicates renin angiotensin aldosterone system.
Serum osteocalcin levels were lower with increasing number of MetSyn traits (χ2 statistic=33.01, P<0.001 for the trend; Figure 1). In multivariable logistic regression analyses that adjusted for age and gender, serum osteocalcin levels in the 3rd and 4th quartiles (compared with the bottom quartile) were significantly associated with a lower OR of having MetSyn (Table 3). This association remained significant after additional adjustment for serum creatinine, statin use, history of myocardial infarction/stroke, lifestyle variables (history of smoking, physical activity score, and years of education), and estrogen use (Table 3). In the subset of blacks without T2D (n=905), after adjustment for age, gender, and the additional covariates listed above, serum osteocalcin levels in the 3rd and 4th quartiles (compared with the bottom quartile) were associated with a lower OR for having MetSyn: 0.62 (0.42 to 0.91) and 0.49 (0.32 to 0.74), respectively.
Table 3.
Association of Serum Osteocalcin With the Presence of Metabolic Syndrome: Logistic Regression Analyses
| Odds Ratio (95% Confidence Interval), P Value |
||||
|---|---|---|---|---|
| 1st Quartile | 2nd Quartile | 3rd Quartile | 4th Quartile | |
| Blacks | ||||
| Osteocalcin (nmol/L) | <10.0 | 10–14.6 | 14.6–19.9 | >19.9 |
| Unadjusted | 1 | 0.85 (0.63–1.16), 0.32 | 0.68 (0.50–0.92), 0.013 | 0.42 (0.31–0.58), <0.001 |
| Age and gender adjusted | 1 | 0.84 (0.62–1.15), 0.28 | 0.66 (0.48–0.90), 0.008 | 0.40 (0.29–0.55), <0.001 |
| Fully adjusted | 1 | 0.79 (0.57–1.08), 0.14 | 0.63 (0.46–0.88), 0.006 | 0.33 (0.23–0.46), <0.001 |
| Non-Hispanic whites | ||||
| Osteocalcin (nmol/L) | <9.0 | 9.0–12.2 | 12.2–16.9 | >16.9 |
| Unadjusted | 1 | 0.76 (0.56–1.03), 0.08 | 0.63 (0.45–0.88), 0.006 | 0.40 (0.29–0.55), <0.001 |
| Age and gender adjusted | 1 | 0.77 (0.56–1.05), 0.10 | 0.63 (0.45–0.88), 0.007 | 0.42 (0.30–0.58), <0.001 |
| Fully adjusted | 1 | 0.80 (0.58–1.12), 0.20 | 0.63 (0.44–0.91), 0.01 | 0.43 (0.31–0.63), <0.001 |
The fully adjusted model includes age, gender, serum creatinine, history of smoking, statin use, history of myocardial infarction/stroke, physical activity score, years of education, and estrogen use.
Similarly, among non-Hispanic whites, after adjustment for age and gender, serum osteocalcin levels were inversely correlated with BMI, waist circumference, fasting serum glucose and insulin levels, HOMA-IR, presence of T2D, serum triglycerides, metabolic score, and plasma leptin, and they were positively correlated with plasma adiponectin levels and physical activity score (P<0.05 for each variable; Table 2). After additional adjustment for BMI, serum osteocalcin levels remained inversely correlated with waist circumference, fasting plasma glucose levels, HOMA-IR, presence of T2D, and plasma leptin and positively correlated with plasma adiponectin levels (P<0.05 for each variable; data not shown).
Serum osteocalcin levels were lower with increasing number of MetSyn traits (χ2 statistic=55.8, P<0.001 for the trend; Figure 1). In multivariable logistic regression analyses that adjusted for age and gender, serum osteocalcin levels in the 3rd and 4th quartiles (compared with the bottom quartile) were significantly associated with lower odds of having MetSyn (Table 3). This association remained significant after additional adjustment for serum creatinine, statin use, history of myocardial infarction/stroke, lifestyle variables (history of smoking, physical activity score, and years of education), and estrogen use (Table 3). In the subset of non-Hispanic whites without T2D (n=1033), after adjustment for age, gender, and the additional covariates listed above, serum osteocalcin levels in the 3rd and 4th quartiles (compared with the bottom quartile) were associated with a lower OR for having MetSyn: OR 0.68 (0.47 to 0.98) and 0.47 (0.32 to 0.69), respectively.
Discussion
To the best of our knowledge, the present study is the first to show an association between serum osteocalcin and MetSyn in a large biethnic cohort. Serum osteocalcin levels were significantly higher in black and non-Hispanic white participants who had fewer MetSyn traits (Figure 1). Participants in the 3rd or 4th quartile for serum osteocalcin had lower odds for the presence of MetSyn compared with those in the bottom quartile. Our results also confirm prior reports of an inverse association between serum osteocalcin and measures of insulin resistance (fasting plasma glucose and insulin and HOMA-IR) and measures of adiposity (BMI and waist circumference),9,10 and they extend these results to blacks.
There is considerable evidence from experimental animals that osteocalcin regulates glucose metabolism. Wild-type mice on a high-fat diet develop glucose intolerance and insulin resistance, which is ameliorated if osteocalcin is given concomitantly.22 Osteocalcin knockout mice (Ocn−/−) show an increase in fat mass, adipocyte number, serum triglyceride, and glucose levels. These mice display inadequate β-cell differentiation, decreased expression of peroxisome proliferator activated receptor-γ (Ppar-γ) and uncoupling protein 2 (Ucp2) receptors, and lower gene expression and plasma levels of adiponectin compared with control mice.1,2 In contrast, an osteocalcin gain-of-function mouse model exhibits greater insulin sensitivity, hypoglycemia, and increased secretion of adiponectin.2,22 These observations suggest that osteocalcin produced by osteoblasts increases insulin and adiponectin expression, decreases fat mass, and improves insulin sensitivity and may thereby confer protection against the development of T2D. Consistent with the animal studies, the present study and previous reports9–11 found serum osteocalcin levels to be inversely related to fat mass, fasting blood glucose and insulin, and HOMA-IR, suggesting that the endocrine effects of the osteoblast-derived osteocalcin on fat mass and glucose homeostasis in mice are also present in humans.
Serum osteocalcin levels were associated with plasma adiponectin levels independent of potential confounders, including age, gender, and BMI (β coefficient for 1 log increase in osteocalcin levels: in blacks, β=0.20, P<0.001; in non-Hispanic whites: β=0.10, P=0.006). Osteocalcin administration in mice leads to a 3-fold higher expression of adiponectin mRNA in the white adipose tissue compared with placebo.1,2,22 Adiponectin improves insulin sensitivity by increasing fatty acid combustion in muscles, inhibiting hepatic gluconeogenesis, reducing muscle and liver triglyceride content, and decreasing plasma free fatty acid levels.23,24 The insulin-sensitizing effects of osteocalcin may be mediated, at least in part, by its actions on adipocytes, leading to increased adiponectin production (Figure 2).
Figure 2.
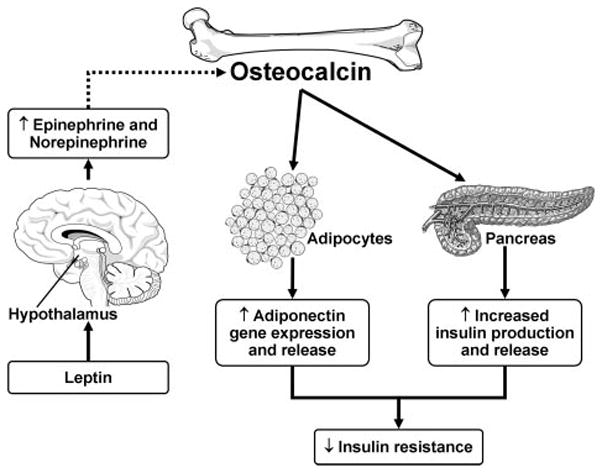
Osteocalcin, leptin, and adiponectin interact to influence insulin resistance.
We found a significant inverse association of serum osteocalcin with leptin levels independent of age, gender, and BMI in non-Hispanic whites and a similar trend among the blacks. Osteocalcin does not affect leptin gene expression or plasma levels in mice.1,2 The inverse association may be due to leptin’s role in increasing central sympathetic tone, which in turn leads to suppression of osteocalcin expression from osteoblasts (Figure 2).6,7 Whether such a mechanism prevails in humans is yet to be confirmed.
In subset analyses, we confirmed the inverse association of serum osteocalcin with the presence of MetSyn among participants without T2D in both ethnic groups. Osteocalcin levels (mean±SD, nmol/L) were lower among participants with T2D than in participants without T2D (blacks, 13.9±7.9 versus 16.9± 8.2, P<0.001; non-Hispanic whites, 11.0±4.8 versus 13.9±6.5; P<0.001). These results are consistent with previous reports of lower osteocalcin levels in T2D than in healthy controls and that osteocalcin levels increase following improvement of glycemic control.25 The mechanisms leading to lower osteocalcin levels in subjects with T2D have not been delineated, and whether circulating osteocalcin might serve as a marker for progression to T2D needs further investigation.
Our study is cross-sectional, precluding direct inferences concerning causality or a temporal relationship of serum osteocalcin levels, adipokine levels, measures of insulin resistance, and MetSyn. The correlations between serum osteocalcin and measures of insulin resistance and adiposity, although novel, are of modest strength. We calculated HOMA-IR as a measure of insulin resistance, and although it is not the “gold standard,” it has been validated as a reliable and clinically useful index of insulin sensitivity in T2D patients.26 The study was conducted in an older, predominantly hypertensive cohort, and the generalizability of our findings to younger and normotensive adults needs to be established.
In conclusion, we demonstrate that serum osteocalcin levels are independently associated with measures of insulin resistance (fasting plasma glucose and insulin and HOMA-IR), circulating adipokines (adiponectin and leptin), and the presence of MetSyn. The observed inverse association between osteocalcin and MetSyn may—at least in part—be related to its upregulation of plasma adiponectin and its inverse association with plasma leptin levels. These findings motivate investigation of the role of osteocalcin in the regulation of glucose metabolism and insulin sensitivity. The potential of osteocalcin as a drug for ameliorating insulin resistance and dysmetabolic profile in at-risk individuals is speculative at present but merits additional investigation.
Acknowledgments
Sources of Funding
This work was supported by grant HL-81331 as part of the National Heart, Lung, and Blood Institute’s Clinical Proteomics Program. Dr Saleem was supported by a National Institutes of Health Training Grant in Clinical Pharmacology (T32 GM08685). Dr Mosley and Dr Kullo were supported by research grants from the National Institutes of Health.
Footnotes
Disclosures
None.
References
- 1.Lee NK, Karsenty G. Reciprocal regulation of bone and energy metabolism. Trends Endocrinol Metab. 2008;19:161–166. doi: 10.1016/j.tem.2008.02.006. [DOI] [PubMed] [Google Scholar]
- 2.Lee NK, Sowa H, Hinoi E, Ferron M, Ahn JD, Confavreux C, Dacquin R, Mee PJ, McKee MD, Jung DY, Zhang Z, Kim JK, Mauvais-Jarvis F, Ducy P, Karsenty G. Endocrine regulation of energy metabolism by the skeleton. Cell. 2007;130:456–469. doi: 10.1016/j.cell.2007.05.047. [DOI] [PMC free article] [PubMed] [Google Scholar]
- 3.Zhao LJ, Liu YJ, Liu PY, Hamilton J, Recker RR, Deng HW. Relationship of obesity with osteoporosis. J Clin Endocrinol Metab. 2007;92:1640–1646. doi: 10.1210/jc.2006-0572. [DOI] [PMC free article] [PubMed] [Google Scholar]
- 4.Kawai M, Devlin MJ, Rosen CJ. Fat targets for skeletal health. Nat Rev. 2009;5:365–372. doi: 10.1038/nrrheum.2009.102. [DOI] [PMC free article] [PubMed] [Google Scholar]
- 5.Lee AJ, Hodges S, Eastell R. Measurement of osteocalcin. Ann Clin Biochem. 2000;37:432–446. doi: 10.1177/000456320003700402. [DOI] [PubMed] [Google Scholar]
- 6.Takeda S, Karsenty G. Molecular bases of the sympathetic regulation of bone mass. Bone. 2008;42:837–840. doi: 10.1016/j.bone.2008.01.005. [DOI] [PubMed] [Google Scholar]
- 7.Ducy P, Schinke T, Karsenty G. The osteoblast: a sophisticated fibroblast under central surveillance. Science. 2000;289:1501–1504. doi: 10.1126/science.289.5484.1501. [DOI] [PubMed] [Google Scholar]
- 8.Richards JB, Valdes AM, Burling K, Perks UC, Spector TD. Serum adiponectin and bone mineral density in women. J Clin Endocrinol Metab. 2007;92:1517–1523. doi: 10.1210/jc.2006-2097. [DOI] [PubMed] [Google Scholar]
- 9.Pittas AG, Harris SS, Eliades M, Stark P, Dawson-Hughes B. Association between serum osteocalcin and markers of metabolic phenotype. J Clin Endocrinol Metab. 2009;94:827–832. doi: 10.1210/jc.2008-1422. [DOI] [PMC free article] [PubMed] [Google Scholar]
- 10.Kindblom JM, Ohlsson C, Ljunggren O, Karlsson MK, Tivesten A, Smith U, Mellstrom D. Plasma osteocalcin is inversely related to fat mass and plasma glucose in elderly Swedish men. J Bone Miner Res. 2009;24:785–791. doi: 10.1359/jbmr.081234. [DOI] [PubMed] [Google Scholar]
- 11.Kanazawa I, Yamaguchi T, Yamamoto M, Yamauchi M, Kurioka S, Yano S, Sugimoto T. Serum osteocalcin level is associated with glucose metabolism and atherosclerosis parameters in type 2 diabetes mellitus. J Clin Endocrinol Metab. 2009;94:45–49. doi: 10.1210/jc.2008-1455. [DOI] [PubMed] [Google Scholar]
- 12.Grundy SM. Metabolic syndrome pandemic. Arterioscler Thromb Vasc Biol. 2008;28:629–636. doi: 10.1161/ATVBAHA.107.151092. [DOI] [PubMed] [Google Scholar]
- 13.Hanson RL, Imperatore G, Bennett PH, Knowler WC. Components of the “metabolic syndrome” and incidence of type 2 diabetes. Diabetes. 2002;51:3120–3127. doi: 10.2337/diabetes.51.10.3120. [DOI] [PubMed] [Google Scholar]
- 14.Lakka HM, Laaksonen DE, Lakka TA, Niskanen LK, Kumpusalo E, Tuomilehto J, Salonen JT. The metabolic syndrome and total and cardiovascular disease mortality in middle-aged men. J Am Med Assoc. 2002;288:2709–2716. doi: 10.1001/jama.288.21.2709. [DOI] [PubMed] [Google Scholar]
- 15.Kim CX, Bailey KR, Klee GG, Ellington AA, Liu G, Mosley TH, Rehman H, Kullo IJ. Sex and ethnic differences in 47 candidate proteomic markers of cardiovascular disease: the Mayo Clinic Proteomic Markers of Arteriosclerosis study. PLoS ONE. 2010;5:e9065. doi: 10.1371/journal.pone.0009065. [DOI] [PMC free article] [PubMed] [Google Scholar]
- 16.Boerwinkle E. Multi-center genetic study of hypertension: the Family Blood Pressure Program (FBPP) Hypertension. 2002;39:3–9. doi: 10.1161/hy1201.100415. [DOI] [PubMed] [Google Scholar]
- 17.Matthews DR, Hosker JP, Rudenski AS, Naylor BA, Treacher DF, Turner RC. Homeostasis model assessment: insulin resistance and beta-cell function from fasting plasma glucose and insulin concentrations in man. Diabetologia. 1985;28:412–419. doi: 10.1007/BF00280883. [DOI] [PubMed] [Google Scholar]
- 18.Executive summary of the Third Report of The National Cholesterol Education Program (NCEP) expert panel on detection, evaluation, and treatment of high blood cholesterol in adults (Adult Treatment Panel III) J Am Med Assoc. 2001;285:2486–2497. doi: 10.1001/jama.285.19.2486. [DOI] [PubMed] [Google Scholar]
- 19.Grundy SM, Brewer HB, Jr, Cleeman JI, Smith SC, Jr, Lenfant C. Definition of metabolic syndrome: Report of the National Heart, Lung, and Blood Institute/American Heart Association conference on scientific issues related to definition. Circulation. 2004;109:433–438. doi: 10.1161/01.CIR.0000111245.75752.C6. [DOI] [PubMed] [Google Scholar]
- 20.Menon RK, Gill DS, Thomas M, Kernoff PB, Dandona P. Impaired carboxylation of osteocalcin in warfarin-treated patients. J Clin Endocrinol Metab. 1987;64:59–61. doi: 10.1210/jcem-64-1-59. [DOI] [PubMed] [Google Scholar]
- 21.Zeger SL, Liang KY. Longitudinal data analysis for discrete and continuous outcomes. Biometrics. 1986;42:121–130. [PubMed] [Google Scholar]
- 22.Ferron M, Hinoi E, Karsenty G, Ducy P. Osteocalcin differentially regulates beta cell and adipocyte gene expression and affects the development of metabolic diseases in wild-type mice. Proc Natl Acad Sci U S A. 2008;105:5266–5270. doi: 10.1073/pnas.0711119105. [DOI] [PMC free article] [PubMed] [Google Scholar]
- 23.Yamauchi T, Kamon J, Waki H, Terauchi Y, Kubota N, Hara K, Mori Y, Ide T, Murakami K, Tsuboyama-Kasaoka N, Ezaki O, Akanuma Y, Gavrilova O, Vinson C, Reitman ML, Kagechika H, Shudo K, Yoda M, Nakano Y, Tobe K, Nagai R, Kimura S, Tomita M, Froguel P, Kadowaki T. The fat-derived hormone adiponectin reverses insulin resistance associated with both lipoatrophy and obesity. Nat Med. 2001;7:941–946. doi: 10.1038/90984. [DOI] [PubMed] [Google Scholar]
- 24.Yamauchi T, Kamon J, Ito Y, Tsuchida A, Yokomizo T, Kita S, Sugiyama T, Miyagishi M, Hara K, Tsunoda M, Murakami K, Ohteki T, Uchida S, Takekawa S, Waki H, Tsuno NH, Shibata Y, Terauchi Y, Froguel P, Tobe K, Koyasu S, Taira K, Kitamura T, Shimizu T, Nagai R, Kadowaki T. Cloning of adiponectin receptors that mediate antidiabetic metabolic effects. Nature. 2003;423:762–769. doi: 10.1038/nature01705. [DOI] [PubMed] [Google Scholar]
- 25.Rosato MT, Schneider SH, Shapses SA. Bone turnover and insulin-like growth factor I levels increase after improved glycemic control in noninsulin-dependent diabetes mellitus. Calcif Tissue Int. 1998;63:107–111. doi: 10.1007/s002239900498. [DOI] [PubMed] [Google Scholar]
- 26.Yokoyama H, Emoto M, Fujiwara S, Motoyama K, Morioka T, Komatsu M, Tahara H, Koyama H, Shoji T, Inaba M, Nishizawa Y. Quantitative insulin sensitivity check index and the reciprocal index of homeostasis model assessment are useful indexes of insulin resistance in type 2 diabetic patients with wide range of fasting plasma glucose. J Clin Endocrinol Metab. 2004;89:1481–1484. doi: 10.1210/jc.2003-031374. [DOI] [PubMed] [Google Scholar]