

Abstract
Peptide-induced vesicle leakage is a common experimental test for the membrane-perturbing activity of antimicrobial peptides. The leakage kinetics is usually very slow, requiring minutes to hours for complete release of vesicle contents, and exhibits a biphasic behavior. We report here that, in the case of the peptaibol trichogin GA IV, all processes involved in peptide-membrane interaction, such as peptide-membrane association, peptide aggregation, and peptide translocation, take place on a timescale much shorter than the leakage kinetics. On the basis of these findings, we propose a stochastic model in which the leakage kinetics is determined by the discrete nature of a vesicle suspension: peptides are continuously exchanging among vesicles, producing significant fluctuations over time in the number of peptide molecules bound to each vesicle, and in the formation of pores. According to this model, the fast initial leakage is caused by vesicles that contain at least one pore after the peptides are randomly distributed among the liposomes, whereas the slower release is associated with the time needed to occasionally reach in an intact vesicle the critical number of bound peptides necessary for pore formation. Fluctuations due to peptide exchange among vesicles therefore represent the rate-limiting step of such a slow mechanism.
Introduction
Antimicrobial peptides (AMPs) are a major component of the innate defense system that is shared by organisms throughout the phylogenetic tree, including humans (1), and represent the most ancient and efficient weapon against microbial pathogens. Although some AMPs have multiple functions (2), their mechanism of antibacterial activity is based mainly on association with the plasma membrane of the pathogens and perturbation of its permeability (3–5), and this process usually does not involve any specific receptor (6–8). For these reasons, antibiotic peptides are the subject of intense research aimed at the creation of a new class of antiinfective therapeutics to address the growing problem of pathogenic organisms that have multiple resistance to traditional antimicrobial agents (1,9).
Because the cell membrane is the main target of AMPs, several studies have focused on their interaction with model phospholipid bilayers (10), and one of the most common assays for their membrane activity is based on the detection of peptide-induced release of liposome contents (11). Typically, these experiments involve the entrapment of a fluorescent dye in the aqueous lumen of unilamellar vesicles at a self-quenching concentration (12). The addition of an AMP induces leakage of the fluorophore from the liposomes. Concomitantly, its dilution in the outer volume abolishes the self-quenching phenomenon, and the leakage process can be followed by the increase in the fluorescence signal.
Obviously, a quantitative analysis of the peptide-induced leakage kinetics can potentially provide several insights into the mechanism of pore formation. For this reason, several studies have attempted to achieve a mechanistic understanding of the leakage kinetics. The release curves determined in these experiments for many different AMPs, toxins, and even amyloid peptides (13) in most cases share two peculiar characteristics: 1), they are surprisingly slow, requiring minutes to hours for complete leakage, whereas simple physical considerations show that the time needed to empty a 100 nm liposome through a single pore is much shorter (14); and 2), they exhibit a strongly nonexponential behavior, with a fast initial leakage that progressively slows down.
These two properties have been observed in peptides such as melittin (15–19), mastoparan (20,21), cecropin (22), α-toxin (23), δ-lysin (24,25), transportan 10 (26), alamethicin (16,27), gramicidin (16), magainin (28–30), pardaxin (31,32), and model amphipathic peptides (33–35). It is important to note that DeGrado and co-workers (15) showed that the leakage kinetics induced in cells (e.g., hemolysis) is remarkably similar to liposome release, strengthening the relevance of these observations.
The fact that these studies span almost 30 years, often focusing on the same peptides, shows that a satisfactory explanation of the experimentally observed behavior is still elusive. Several hypotheses have been put forward regarding the rate-limiting step of the slow leakage process, including peptide-membrane binding (31), a conformational transition of the peptide (19), peptide aggregation (15,17,24,25,29,34,36), pore formation (27,22,30), pore opening (37), and peptide translocation across the bilayer (21,37). Similarly, several hypotheses have been proposed to explain the progressive slowing down of the kinetics, such as peptide inactivation due to a conformational transition (28), aggregation (15), or translocation across the membrane (21,26,35).
In this work we systematically evaluate all of the possibilities for the rate-limiting step by taking as an example a very well characterized peptide, the peptaibol trichogin GA IV (see Scheme 1). Detailed spectroscopic studies on the fluorescent analog F10 of this peptide have demonstrated that it forms aggregates both in water and in the membrane, and that aggregation in the bilayer is accompanied by insertion into the hydrophobic core of the membrane and by pore formation (38–41). These studies also showed that the four populated species (monomer and aggregate, in both water and the membrane) are characterized by significantly different fluorescence lifetimes and quantum yields of the fluorene label (38,40). This property led to a quantitative determination of their relative populations (38,40), and allowed us to follow their kinetic behavior in this study.
Scheme 1.

Primary structures of trichogin GA IV and its fluorescent analog F10. Oct, n-octanoyl; Aib, α-aminoisobutyric acid; Lol, leucinol; Dab, α,γ-diaminobutyric acid; Fmc, fluorenyl-9-methylcarbonyl.
The results reported here indicate that the origin of the slow leakage observed in a population of vesicles very likely resides in a largely overlooked but very basic property of the experimental system, i.e., its discrete nature. Many studies, mainly by the groups of Schwarz (17,19,20,27), Nir (32,34), and Almeida (22,25,26,30), proposed quantitative models to describe the leakage kinetics. However, in most of these cases the role of fluctuations was neglected. By contrast, a vesicle (or cell) suspension is obviously a discrete system, and the release of the contents of each vesicle is not influenced by the other liposomes in the sample. A liposome is a nanoscopic system and the number of peptides or the number of pores in each vesicle can be rather small, well below the thermodynamic limit. Recently, a large body of studies demonstrated that the kinetics of systems formed by discrete, small entities can be dramatically different from that predicted for continuous systems, owing to the significant fluctuations caused by the low number of molecules involved (42–47).
Some previous studies considered that significant variations can occur in the number of peptides bound to each vesicle (18,19,27,34), but the consequences of this observation on the leakage kinetics were not taken into account in their full scope. For instance, none of these studies considered that the number of peptides associated with a specific vesicle can fluctuate over time due to peptide exchange among vesicles. Here we propose a model based on these fluctuations that provides an explanation for the peculiar features of the peptide-induced vesicle leakage kinetics.
Materials and Methods
Materials
All lipids were purchased from Avanti Polar Lipids (Alabaster, AL), and carboxyfluorescein (CF) and Sephadex G-50 were obtained from Sigma (St. Louis, MO). Texas-Red dextran (average molecular weight (MW): 10,000; neutral form) was obtained from Invitrogen (Eugene, OR). Spectroscopic-grade chloroform and methanol (Carlo Erba, Milano, Italy) were used. Polyvinyl alcohol (average MW: 22,000; 88% hydrolyzed) and Triton X-100 were purchased from Acros (Geel, Belgium).
Peptide synthesis and liposome preparation
Synthesis of peptide F10 and preparation of large unilamellar vesicles (LUVs) were performed as previously described (38). All liposomes were formed by egg phosphatidylcholine and cholesterol (1:1 molar ratio). The total lipid concentration (phospholipids + cholesterol) is reported. Liposomes containing the fluorescent lipid 1-palmitoyl-2-[6-((7-nitrobenz-2-oxa-1,3-diazol-4-yl)amino)caproyl]-L-α-phosphatidylcholine (C6-NBD-PC) in the external layer were prepared by adding an aliquot of a concentrated ethanolic solution of C6-NBD-PC to preformed, unlabeled vesicles to obtain a 0.5% label molar fraction (48). The final ethanol concentration was always <1%.
Giant unilamellar vesicles (GUVs) were prepared by the electroformation method (49), and 3 μM CF or 18 μM Texas-Red-labeled dextran were entrapped inside the GUVs. To independently observe the GUV content and the lipid membrane, GUVs entrapping CF molecules were marked with 1% molar ratio of the rhodamine-labeled lipid, 1,2-dioleoyl-sn-glycero-3-phosphoethanolamine-N-(lissamine rhodamine B sulfonyl) (N-Rho-PE), and GUVs containing Texas-Red-labeled dextran were marked with 5% of the fluorescent lipid 1,2-dioleoyl-sn-glycero-3-phosphoethanolamine-N-(7-nitrobenz-2-oxa 1,3-diazol-4-yl) (NBD-PE).
Peptide-induced leakage
Peptide-induced membrane permeability was determined by measuring the fractional release of CF entrapped inside liposomes, as previously reported (38). Steady-state fluorescence spectra were carried out on a SPEX Fluoromax 2 fluorimeter (Edison, NJ). Temperature was controlled to 25°C by a thermostated cuvette holder. To minimize peptide adsorption on cell walls, UV-grade polymethylmethacrylate cuvettes were treated overnight with a 5% (w/w) water solution of polyvinyl alcohol (38).
Stopped-flow experiments
Stopped-flow experiments were performed on a SX.18 MV apparatus (Applied Photophysics, Leatherhead, UK) with a fluorescence detector and a nominal mixing time of 1 ms. Temperature was controlled to 25°C. Mixing of asymmetric volumes (1:10 alcoholic peptide solution/aqueous liposome solution) was employed. Samples were excited at 265 nm, and emission was collected using a cutoff filter at 305 nm or 385 nm.
Light scattering
Experiments were carried out with a commercial ALV light-scattering spectrometer (ALV, Langen, Germany) with a Coherent Innova 70 argon ion laser (Coherent Italia, Milano, Italy) operating at a wavelength of 488 nm at 100 mW. The scattering cell was immersed in a refractive index matching fluid (toluene) maintained at 21 ± 0.1°C. For each sample, dynamic light scattering data were collected and acquired typically for a duration of 5 min for 1–3 angular runs. All samples were investigated at seven different angles from 30° to 150°. The number-weighted particle size distribution was recovered by direct inversion of the intensity autocorrelation function (50).
Results
Release kinetics
Fig. 1 shows the vesicle release kinetics obtained at different peptide concentrations. Several observations can be made from these data: 1), the release curves do not follow a simple exponential behavior; 2), the release curves are extremely slow, extending for many tens of minutes; and 3), the release kinetics is strongly dependent on the peptide/lipid ratio. These curves are characterized by a fast phase in which a significant fraction of the vesicle content is released, and by a much slower leakage phase. Of interest, all curves lead to complete leakage after a sufficient period of time. For instance, a 2.3 μM peptide concentration causes the release of only 17% of the vesicle contents in 20 min but leads to an almost complete leakage after 48 h, whereas control experiments show that spontaneous release in the absence of F10 is negligible in this time frame.
Figure 1.
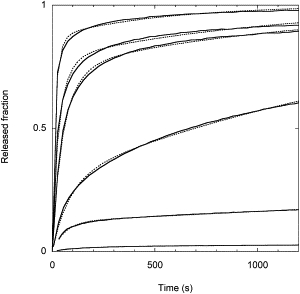
Kinetics of CF release after addition of peptide F10 to an LUV suspension. [Lipid] = 0.2 mM and [F10] = 1.2 μM, 2.3 μM, 3.7 μM, 4.7 μM, 6.9 μM, 10.8 μM (from bottom to top). The dotted lines are the best fit to the data with the model described here.
Binding, aggregation, and translocation kinetics
We followed peptide binding to the membrane and the formation of aggregates by taking advantage of the intrinsic fluorescence of the synthetic trichogin GA IV analog F10. Because the four species populated by F10 (monomeric and aggregated peptide, in both water and the membrane phase) are characterized by a different quantum yield and fluorescent lifetime (38), both the water to membrane partition and peptide aggregation are accompanied by a variation in the fluorescence intensity signal.
Fig. 2 shows the results of stopped-flow experiments performed by mixing a methanolic concentrated solution of the peptide with a solution of lipid vesicles. The fluorescence signal exhibited an initial decrease due to peptide aggregation, followed by a strong increase resulting from the water to membrane partition. Of interest, all signal variations were completed within ∼30 s, i.e., on a timescale much shorter than that of the vesicle leakage experiments.
Figure 2.
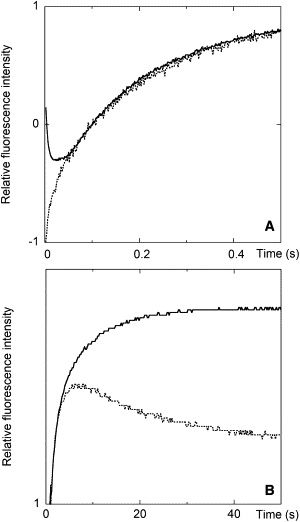
Stopped-flow experiments on F10-membrane interaction. Two different timescales are reported in panels A and B. For the experiments, 30 μL of a concentrated F10 methanol solution were mixed with 300 μL of an aqueous suspension of LUVs. Final concentrations: [F10] = 0.5 μM, [lipid] = 0.2 mM. Continuous lines: F10 was added to unlabeled vesicles and fluorene emission was collected. Dotted lines: F10 was added to vesicles labeled on the external leaflet of the bilayer with 0.5% C6-NBD-PC, and NBD emission was collected.
Previous studies showed that F10 is able to rapidly translocate across the bilayer, but they did not determine the timescale of this process (39). To further characterize this process, we also performed stopped-flow experiments with vesicles labeled with the fluorescent lipid analog C6-NBD-PC.
The NBD fluorophore can act as a Förster resonance energy transfer acceptor for fluorene, with a Förster radius (51) of 24 Å (39). The vesicles were labeled with C6-NBD-PC on the external leaflet of the lipid bilayer only. Under the conditions used, no lipid flip-flop takes place (39), ensuring that the lipid labeling asymmetry is maintained. In our stopped-flow experiments, we followed the changes in NBD emission related to peptide association to the membrane. The water to membrane partition of the peptide induced a significant increase in NBD emission, which followed the same kinetics observed for the fluorene fluorescence. The subsequent decrease in NBD emission was caused by the translocation of a fraction of the peptide from the outer leaflet to the unlabeled layer. However, even the translocation process was completed in ∼50 s, i.e., on a timescale much faster than that of the vesicle leakage process.
These findings prove that the water to membrane partition, peptide aggregation, and peptide translocation are not the rate-limiting steps of the slow vesicle leakage process, since they are several orders of magnitude faster.
Leakage of a single vesicle
Another possible explanation for the long timescale observed in the leakage experiments is that the rate-limiting step is connected to the time needed by a single vesicle to completely release its contents after the formation of at least one peptide-induced pore.
An estimate of this timescale can be obtained by applying the first Fick's law, which describes the diffusion-mediated flow of fluorescent molecules through open pores as:
| (1) |
| (2) |
where Cin and Cout stand for the fluorophore concentrations at the internal and external pore bounds, respectively; D0 is the diffusion coefficient of the fluorophore in the pore; d is the thickness of the membrane; Ap is the total pore cross-sectional area; and R is the vesicle radius (14). In the leakage experiments described in Fig. 1, R ∼50 nm (i.e., the radius of the pores of polycarbonate extrusion filters), d = 4 nm (52), and D0 = 2.17 × 10 8 nm2/s (53). By assuming a minimal pore diameter of 1 nm (corresponding to the approximate size of the CF molecules), one can estimate Ap for a single pore to be higher than 0.8 nm2. Substitution of these parameters into the above equations, gives ϕ ∼10 ms, indicating that the time needed to empty a single vesicle can be excluded as a possible rate-limiting step.
It is worth mentioning that this value represents just a very rough estimate of the timescale of the vesicle-emptying process because it is based on several approximations. The most severe is that the molecules diffuse freely inside the pore, without any impedance, and this very likely leads to a significant underestimation of ϕ. However, a direct assessment of the timescale of this parameter can be experimentally obtained by employing GUVs (i.e., liposomes with a diameter of several micrometers) that can be observed directly in the optical microscope. Such an experiment (reported in Fig. S1 of the Supporting Material) showed that F10 induced the complete release of the vesicle contents without destroying the membrane, thus providing direct evidence for the formation of pores. Of interest, no leakage was observed when a larger molecule (Texas-Red-labeled dextran; average MW: 10,000) was entrapped inside the GUVs, indicating that the pore diameter is approximately 1–4 nm, which corresponds to the approximate size of the CF and dextran molecules, respectively. This result confirms previous studies performed with LUVs (38).
In the case of CF, the leakage of GUV contents was completed in <10 min. This also includes the time needed for peptide diffusion from the site of addition to the vesicle under observation (since no stirring was possible in the observation chamber) and for pore formation. The diameter of the LUVs employed in the leakage experiments of Fig. 1 was ∼500 times smaller than that of the GUV, and Eq. 2 indicates that the time needed to unload a single vesicle after pore formation increases with the vesicle radius. Therefore, the results of the GUV experiment indicate that the time needed to unload a single LUV after pore formation is much shorter than the timescale of the leakage curves reported in Fig. 1.
Size dependence of the vesicle leakage
Further information on the leakage process from a population of vesicles was obtained by studying the dependence of the LUV release kinetics on the liposome size. The vesicle size distribution for three different preparations, obtained by extrusion through membranes with pore radii of 50, 100, and 200 nm, was determined by light scattering experiments. The actual average radius was 56, 83, and 140 nm, respectively, with a standard deviation of the size distribution of ∼5 nm. The leakage curves were determined for these three vesicle preparations at the same peptide and lipid concentrations to obtain the same membrane-bound peptide surface density in all cases.
These curves, reported in Fig. 3, show that the release velocity and the fraction of vesicle contents released in a given time from a population of vesicles increase with vesicle size. This counterintuitive result is in contrast to the size dependence for the release from a single vesicle after one pore is formed (Eq. 2).
Figure 3.
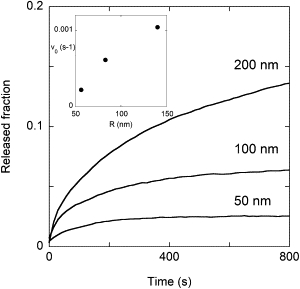
Leakage kinetics as a function of vesicle size. The inset shows the initial release velocity (calculated for the first 20 s of the leakage process) as a function of the actual average radius of the vesicles.
This finding confirms the view that the release of vesicle contents after pore formation in each liposome is not the rate-limiting step in the ensemble leakage experiments, and suggests that a phenomenon related to the vesicle surface area must be involved.
Peptide exchange between vesicles
To further characterize all processes involved in the vesicle leakage kinetics, we studied the exchange of peptides between vesicles to verify whether F10 is able to rapidly distribute in the whole vesicle population.
Fig. 4 A shows the leakage curve obtained by adding F10 to 0.2 mM CF-filled vesicles. At the time indicated by the arrow, a large excess (10:1) of CF-free vesicles was added, resulting in a cessation of the release process (19,28). Peptide exchange between liposomes caused a high dilution of F10 concentration in the membrane, and peptide concentration dropped below the threshold needed for pore formation.
Figure 4.
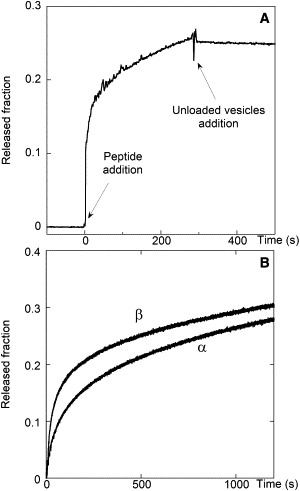
(A) F10-induced CF release ([lipid ] = 0.2 mM) stopped by the addition of 2 mM unloaded LUVs. (B) F10-induced CF release. Curve α: F10 was incubated with LUVs not containing CF, and at time zero CF-loaded LUVs were added. Curve β: F10 was added directly to a mixture of loaded and unloaded LUVs.
Further confirmation of the rapid peptide exchange between vesicles was obtained by the following experiment: F10 was mixed with unlabeled lipid vesicles at a lipid concentration sufficient to induce an almost complete membrane association of the peptide. After complete equilibration was achieved, CF-containing vesicles were added to this sample and their leakage kinetics was recorded (22,24,30). It started immediately and followed a behavior very similar to that observed when the peptide was added directly to a mixture of CF-loaded and unloaded vesicles, confirming that the peptide bound to the unlabeled vesicles in the first curve was able to distribute in the whole vesicle population (Fig. 4 B). Furthermore, this experiment indicates that the pores do not suffer any significant inactivation after the initial peptide binding to the membrane, a hypothesis that is often invoked to explain the biphasic behavior of the leakage kinetics (15,19,35) or incomplete leakage (24,25).
Theoretical model
The vesicle as a system far from the thermodynamic limit
The experiments described above ruled out several processes as possible candidates for the rate-limiting step in vesicle leakage: peptide-membrane association, homogeneous peptide distribution in the whole vesicle population, peptide translocation across the bilayer, peptide aggregation to form pores, and leakage of the vesicle contents once the pore is formed.
However, the observation that peptides exchange rapidly among vesicles led us to consider that whereas the leakage experiments were performed on a macroscopic sample, this system is formed by much smaller discrete entities, i.e., the lipid vesicles. Peptide exchange between vesicles causes continuous fluctuations in the number of peptide molecules bound to each vesicle. The relatively small size of a liposome ensures that the number of bound peptides is far from the thermodynamic limit. Therefore, fluctuations in this number cannot be neglected. Considering that the pore-formation process is a cooperative phenomenon driven by peptide concentration in the membrane, the fluctuations in the number of pores formed in any given vesicle will be even larger than those in the number of vesicle-bound peptide molecules. At any given time, some vesicles contain pores while others do not. This situation explains the fast phase of the leakage curves, during which time the vesicles that already contain at least one pore rapidly release their contents.
If no peptide exchange between vesicles were present, no further leakage would be observed after this fast phase. However, our data show that even when the peptide concentration is so low that the fast phase is very small, the vesicles contents are completely released, but on a much longer timescale. This observation reflects the fact that, thanks to fluctuations, the threshold concentration for peptide aggregation and pore formation can be reached. In our opinion, these fluctuations represent the rate-determining step for the depletion of each liposome, and the slow overall kinetics is due to the long period of time that inactive vesicles have to wait before fluctuations lead to an amount of bound peptide sufficient to induce pore formation and leakage. Peptide exchange among vesicles is fast, and therefore so are the fluctuations in the number of peptides bound to each liposome. However, peptide aggregation, which is also a relatively fast process, requires that a critical number of peptides be present on a given vesicle. Therefore, the appearance of a pore in a specific liposome is definitely a much rarer event.
The complete characterization of the membrane interaction of the fluorescent trichogin analog F10 achieved in our previous works (38,39) now allows us to test this hypothesis. Using time-resolved measurements, we previously determined the fraction of peptide molecules that are membrane-bound and participate in the peptide aggregates that constitute the pores (38). These data can be used to calculate the average number of peptide molecules participating in aggregates for each liposome. In the concentration range used in the leakage experiments reported in Fig. 1, this number varies from ∼50 to 600 peptide monomers, and depending on the size of the aggregates, the number of pores can be much lower (40). Furthermore, it is important to stress that not necessarily all aggregates constitute an open pore, and that therefore the fluctuations in the number of pores in a given vesicle are definitely significant.
In the following section we develop a kinetic model based on these ideas.
Stochastic kinetic model
As shown in our previous studies (38–40), the concentration of membrane-bound trichogin aggregates (which constitute the pores) is regulated by aggregation equilibria (both in water and in the membrane phase) and by the water to membrane partition of the peptide. Here, we show that the water to membrane partition, peptide aggregation, pore formation, and release of the contents of those vesicles in which at least one pore is formed take place on a timescale much faster than the leakage process. Therefore, it is reasonable to assume, for the sake of simplicity, that they can be considered instantaneous, as compared to the release kinetics. According to this hypothesis, after a very fast initial transient phase the peptide-membrane and peptide-peptide interaction processes are at equilibrium. As a result, the total number of pores Np in the whole macroscopic vesicle suspension is constant: fluctuations in this number are negligible due to the high numbers of peptides and vesicles in the macroscopic sample. For the same reason, fluctuations in all properties of the overall vesicle suspension are negligible, so that in the following derivation only average values will be considered. The only significant fluctuations are those taking place in the number of pores present in the small system constituted by a specific vesicle: peptides are continuously exchanging among vesicles, leading to the formation (and disassembly) of pores in each specific liposome. Because the total number of pores is constant, we will regard this latter process as simply an exchange of pores among vesicles.
We define kex as the rate of exchange of pores among vesicles, i.e., on average, each pore goes from one liposome to another kex times per second. Obviously, kex will be a function of the rate constants of the individual underlying molecular processes (such as water-membrane peptide partition and aggregation), but for the present treatment it is sufficient to introduce this overall, operationally defined constant. Let us consider an infinitesimal time interval dt, so short that the probability that a pore will change more than one vesicle in dt is negligible. On average, the total number of pores exchanging vesicles in dt is therefore Np kexdt.
We now define Nv as the total number of vesicles, and Nf as the number of full vesicles at any given time. Therefore, the fraction of full vesicles F is Nf/Nv, which is also the probability that a pore-exchanging vesicle will end up in a liposome that is still full. As a consequence, the total number of pores that move from one vesicle to another, ending up in a full liposome, will be given on average by:
| (3) |
where is the average number of pores per vesicle. If dt is small enough, the probability that two pores that change vesicles will end up in the same liposome is negligible. Therefore, is also the average number of full vesicles receiving a pore in dt and emptying in that time interval, since complete depletion of a pore-containing liposome is assumed to be instantaneous (i.e., an all-or-none mechanism). Thus, we can write:
| (4) |
and
| (5) |
where To estimate Nf(0), we consider that at time zero the peptides (and therefore the pores) distribute randomly among the vesicles. The probability of finding a given number of pores (n) in a given vesicle will be described by a Poisson distribution P(n). is the probability that a vesicle has no pores, and therefore at time zero a fraction (1 − P(0)) of vesicles already have at least one pore and become instantaneously empty. In conclusion, , and the fraction of full vesicles (or the fraction of liposome contents still inside vesicles) is given by:
| (6) |
The fraction of liposome contents released (R) is given by 1 − F.
We verified this equation by Monte Carlo simulations in which we explicitly considered both vesicles and pores (see Supporting Material). At any time step dt the pores could randomly migrate from one vesicle to another, with probability kexdt = dt/τ. Once a vesicle contained at least one pore, it would instantaneously become empty. The simulated leakage kinetics was described exactly by Eq. 6 (see Fig. S2), a finding that confirms the correctness of its derivation.
Equation 6 captures the essential features of the experimental leakage curves: a fast phase (which in Eq. 6 is instantaneous) followed by a slower leakage; the extent of the fast phase, which increases with peptide concentration; and a faster leakage with increasing (and therefore with increasing vesicle radius, if the surface density of peptide is constant). However, this equation is not adequate to quantitatively describe the leakage curves, because the initial phase is not instantaneous.
If the initial approximation that all processes (except fluctuations) are instantaneous is removed, a less sharp initial phase is predicted. For instance, let us assume that peptide aggregation, water to membrane partition, and pore formation are still instantaneous, but the time needed by a pore-containing vesicle to release its contents cannot be neglected. Let us first calculate the behavior of F(t) if no fluctuations in the number of pores in each vesicle take place. In this case the fraction of fluorophores entrapped inside vesicles decays as:
| (7) |
where ϕ is the characteristic time associated with the release from a single pore (Eq. 2), and P(m) is the probability of having m pores in a vesicle (14). By assuming a Poisson distribution for P(m), one can calculate the decay in F(t):
| (8) |
In Eq. 8, the average number of pores per vesicle can be considered constant because all processes contributing to pore formation were assumed to equilibrate instantaneously, i.e., before the leakage began. According to Eq. 8, F does not jump instantaneously to at time zero (as predicted by Eq. 6), but decays to this value with a relaxation time ϕ.
It is now possible to consider the case in which the leakage from pore-containing vesicles is not instantaneous, and also peptide exchange among vesicles is at play. Because the timescales of the two processes are very different, we can still assume that ϕ << τ. In this case, fluctuations in the number of pores in each vesicle are negligible during the fast leakage process, and Eqs. 8 and 6 can be easily combined to describe the overall decay of the encapsulated fluorophore fraction:
| (9) |
In this case, the fraction of liposome contents released is
| (10) |
To confirm that Eq. 10 correctly describes a system corresponding to the assumptions described above, we performed further stochastic Monte Carlo simulations (see Supporting Material). In this case, a pore-containing vesicle was allowed to empty gradually, with a rate proportional to the number of pores, and to 1/ϕ. The leakage kinetics simulated by this stochastic approach was described exactly by Eq. 10 when τ/ϕ > 100. When this ratio was lower, the simulated curves could still be fitted well by Eq. 10, but this led to a slight underestimation in the parameters. However, for τ/ϕ = 30, the difference between simulated and recovered parameter was <10% (see Fig. S3 and Table S1).
A fit to the release data with Eq. 10 (presented in Fig. 1, dotted lines) provides a satisfactory description of the decay curves. The parameters obtained from the fit are reported in Table 1.
Table 1.
Parameters corresponding to the best fit of the leakage data with Eq. 10
| [F10] (μM) | φ (s) | τ (s) | ||
|---|---|---|---|---|
| 1.2 | 0.03 ± 0.01 | 90 ± 50 | 3440 ± 40 | |
| 2.3 | 0.14 ± 0.01 | 50 ± 10 | 3000 ± 300 | |
| 3.7 | 0.40 ± 0.05 | 90 ± 10 | 1000 ± 300 | |
| 4.7 | 1.1 ± 0.2 | 70 ± 20 | 1600 ± 200 | |
| 6.9 | 1.3 ± 0.3 | 50 ± 10 | 1500 ± 100 | |
| 10.8 | 1.9 ± 0.3 | 28 ± 2 | 1150 ± 50 |
Average values and errors were obtained from fits to duplicate experiments.
The most interesting result obtained from these fits is an estimate for , which within the range investigated increases from 0.03 to ∼2. These data can be compared with previous results from time-resolved fluorescence experiments performed at equilibrium, which determined the number of membrane-bound peptide molecules participating in aggregates, i.e., the peptide species that constitutes the pores (38). As shown in Fig. 5, the two data sets are clearly correlated. Because these two results were obtained by completely independent measurements (kinetic versus equilibrium), their correlation provides strong support for the model used to describe the leakage kinetics. It is interesting to note that the ratio between the two data sets is ∼300, whereas the average number of trichogin molecules that form an aggregate is presumably on the order of 10 (38,40). This finding suggests that not all aggregates constitute a pore. A critical aggregation number is probably needed to obtain an open pore or, alternatively, peptide aggregates could be present in both an open and a closed state.
Figure 5.
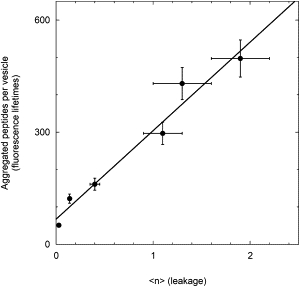
Correlation between the average number of pores in a single vesicle, obtained from the fit to the leakage kinetics and the number of membrane-bound peptide molecules participating in aggregates, determined from time-resolved fluorescence experiments at equilibrium (37). Egg phosphatidylcholine/cholesterol LUVs, [lipid] = 0.2 mM, vesicle radius = 50 nm.
Both τ and ϕ exhibit some variability but no definite trend with peptide concentration, whereas according to the model they were expected to be constant. This finding could be due to 1), the limited reproducibility of the leakage curves, as indicated by errors on the recovered parameters obtained by comparing duplicate experiments; or 2), the simplifying approximations used in the model, such as the assumption of a monodisperse vesicle population, or the fact that only the release process was considered in deriving Eqs. 7–10, whereas our data show that other phenomena can influence the kinetics in the first seconds after peptide addition. This latter point could be also responsible for the fact that the recovered ϕ-values are higher than our rough theoretical estimate (in addition to the free diffusion hypothesis employed to derive it). In any case, all values of this parameter are much lower than those of τ, in agreement with our assumptions, indicating that the fluctuations in the number of pores in each liposome, caused by peptide exchange among vesicles, indeed represent the rate-limiting step for the slow leakage process. Furthermore, a global fit of the data, with linked values of ϕ and τ for all experimental curves, is reported in the Supporting Material (Fig. S4 and Table S2). Although the results are obviously worse than the individual fits to each of the leakage curves, they are still reasonable, and the recovered values of the parameters are close to those of the individual fits.
Finally, it is interesting to note that Eq. 10 also provides an explanation for the observed ensemble leakage behavior as a function of vesicle radius (Fig. 3). It predicts that the kinetics will become faster with increasing , and therefore, all other parameters being equal, with increasing vesicle radius.
Discussion
The proposed model captures the general features of the release kinetics observed for trichogin GA IV. Because similar behaviors have been observed for many other peptides, the model might have a general relevance. Numerous studies have made the general observation of a peptide-membrane association much faster than the leakage timescale (22,24,30,32,34,54,55), and both theoretical considerations and experimental data indicate that once a pore is formed, a single vesicle releases its contents very quickly. Regarding peptide aggregation, direct studies of the kinetics of this process are scarce, but it should be considered that membrane fluidity and the bidimensional character of a lipid bilayer make the diffusion-limited encounter of two membrane-bound peptide molecules extremely fast (19). Also the increase in ensemble vesicle leakage with vesicle size was previously observed (34), and peptide exchange among vesicles was demonstrated in several cases (19,22,28,30). Therefore, fluctuations induced by peptide exchange among vesicles might indeed be the rate-limiting step for the slow vesicle leakage in many cases.
Of more importance, in all cases in which peptides do exchange among vesicles, the effects of fluctuations and the discrete nature of the experimental system must be taken into account, even though the actual situation might be more complex than suggested by the model presented here. It might be argued that fluctuations become insignificant when the number of peptides bound per vesicle is rather high, as suggested by the carpet model (6). However, in all cases in which cooperative phenomena take place, such as aggregation (56,57) or membrane-mediated interactions, even small fluctuations in the vesicle-bound peptide concentration can be highly amplified.
Recently, Gregory and co-workers (22) presented a detailed study of the kinetics of membrane interaction and vesicle leakage for cecropin A. Consistent with our findings, they showed that all processes involved in peptide-membrane interaction are much faster than the leakage timescale. Therefore, to account for the slow release kinetics, they had to include an additional step in their model. They defined this rate-limiting process as the transition of each vesicle to a pore state in which liposome contents are released. The average number of peptides bound to each vesicle in that study is comparable to those reported here, and fluctuations may be the origin of the chaotic pore-opening step in their model.
Several predictions of our model can be used to experimentally test its applicability to a specific case, such as the size dependence of the ensemble leakage kinetics, or the attainment of complete leakage at very long times, even with very low peptide concentrations. In this respect, it is worth mentioning that some studies claimed that leakage stopped before completion, suggesting pore inactivation (21,26) and/or lack of peptide exchange among vesicles (18,34). However, in some instances the reported experimental data do not necessarily support this conclusion, due to the relatively short length of the leakage curves. Because this is a very diagnostic property for the leakage mechanism, one should always inspect it very carefully by acquiring leakage curves over longer times.
Conclusions
From the data presented here, we can draw four major conclusions regarding the mechanism of peptide-induced leakage from a population of vesicles in the case of trichogin GA IV:
-
1.
All processes involved in peptide-membrane interaction attain equilibrium on a timescale much faster than the leakage kinetics, and therefore can be ruled out as the rate-limiting step of this process.
-
2.
Fluctuations in the number of aggregated peptides associated to each liposome and induced by peptide exchange among vesicles are significant due to the relatively small size of the liposomes.
-
3.
The stochastic model proposed here, which considers these fluctuations as the rate-limiting process in the slow leakage kinetics, gives a satisfactory quantitative description of the release data.
-
4.
The kinetic model provides an estimate for the average number of pores per vesicle, which correlates with an independent assessment of this quantity from equilibrium fluorescence data.
The kinetics of peptide-induced vesicle leakage provides a new example of a system whose behavior is determined by the discrete nature of the sample and by the fluctuations caused by the relatively small size of the discrete entities, as recently observed for different processes in cell biology (45,46).
Acknowledgments
We thank Dr. Gianfranco Bocchinfuso for helpful discussions, and an anonymous referee for his constructive comments.
This research was supported by the Ministero dell'Istruzione, dell'Università e della Ricerca, and Ministero degli Affari Esteri.
Supporting Material
References
- 1.Zasloff M. Antimicrobial peptides of multicellular organisms. Nature. 2002;415:389–395. doi: 10.1038/415389a. [DOI] [PubMed] [Google Scholar]
- 2.Lai Y., Gallo R.L. AMPed up immunity: how antimicrobial peptides have multiple roles in immune defense. Trends Immunol. 2009;30:131–141. doi: 10.1016/j.it.2008.12.003. [DOI] [PMC free article] [PubMed] [Google Scholar]
- 3.Epand R.M., Vogel H.J. Diversity of antimicrobial peptides and their mechanisms of action. Biochim. Biophys. Acta. 1999;1462:11–28. doi: 10.1016/s0005-2736(99)00198-4. [DOI] [PubMed] [Google Scholar]
- 4.Giuliani A., Pirri G., Rinaldi A.C. Antimicrobial peptides: natural templates for synthetic membrane-active compounds. Cell. Mol. Life Sci. 2008;65:2450–2460. doi: 10.1007/s00018-008-8188-x. [DOI] [PMC free article] [PubMed] [Google Scholar]
- 5.Bechinger B. Rationalizing the membrane interactions of cationic amphipathic antimicrobial peptides by their molecular shape. Curr. Opin. Colloid Interface Sci. 2009;14:349–355. [Google Scholar]
- 6.Shai Y. Mode of action of membrane active antimicrobial peptides. Biopolymers. 2002;66:236–248. doi: 10.1002/bip.10260. [DOI] [PubMed] [Google Scholar]
- 7.Sánchez-Gómez S., Lamata M., Martínez-de-Tejada G. Comparative analysis of selected methods for the assessment of antimicrobial and membrane-permeabilizing activity: a case study for lactoferricin derived peptides. BMC Microbiol. 2008;8:196. doi: 10.1186/1471-2180-8-196. [DOI] [PMC free article] [PubMed] [Google Scholar]
- 8.Melo M.N., Ferre R., Castanho M.A.R.B. Antimicrobial peptides: linking partition, activity and high membrane-bound concentrations. Nat. Rev. Microbiol. 2009;7:245–250. doi: 10.1038/nrmicro2095. [DOI] [PubMed] [Google Scholar]
- 9.Hancock R.E.W., Sahl H.G. Antimicrobial and host-defense peptides as new anti-infective therapeutic strategies. Nat. Biotechnol. 2006;24:1551–1557. doi: 10.1038/nbt1267. [DOI] [PubMed] [Google Scholar]
- 10.Epand R.M., Epand R.F. Liposomes as models for antimicrobial peptides. Methods Enzymol. 2003;372:124–133. doi: 10.1016/S0076-6879(03)72007-2. [DOI] [PubMed] [Google Scholar]
- 11.Weinstein J.N., Yoshikami S., Hagins W.A. Liposome-cell interaction: transfer and intracellular release of a trapped fluorescent marker. Science. 1977;195:489–492. doi: 10.1126/science.835007. [DOI] [PubMed] [Google Scholar]
- 12.Chen R.F., Knutson J.R. Mechanism of fluorescence concentration quenching of carboxyfluorescein in liposomes: energy transfer to nonfluorescent dimers. Anal. Biochem. 1988;172:61–77. doi: 10.1016/0003-2697(88)90412-5. [DOI] [PubMed] [Google Scholar]
- 13.Brender J.R., Hartman K., Ramamoorthy A. A single mutation in the nonamyloidogenic region of islet amyloid polypeptide greatly reduces toxicity. Biochemistry. 2008;47:12680–12688. doi: 10.1021/bi801427c. [DOI] [PMC free article] [PubMed] [Google Scholar]
- 14.Schwarz G., Robert C.H. Kinetics of pore-mediated release of marker molecules from liposomes or cells. Biophys. Chem. 1992;42:291–296. doi: 10.1016/0301-4622(92)80021-v. [DOI] [PubMed] [Google Scholar]
- 15.DeGrado W.F., Musso G.F., Kézdy F.J. Kinetics and mechanism of hemolysis induced by melittin and by a synthetic melittin analogue. Biophys. J. 1982;37:329–338. doi: 10.1016/S0006-3495(82)84681-X. [DOI] [PMC free article] [PubMed] [Google Scholar]
- 16.Portlock S.H., Clague M.J., Cherry R.J. Leakage of internal markers from erythrocytes and lipid vesicles induced by melittin, gramicidin S and alamethicin: a comparative study. Biochim. Biophys. Acta. 1990;1030:1–10. doi: 10.1016/0005-2736(90)90231-c. [DOI] [PubMed] [Google Scholar]
- 17.Schwarz G., Zong R.T., Popescu T. Kinetics of melittin induced pore formation in the membrane of lipid vesicles. Biochim. Biophys. Acta. 1992;1110:97–104. doi: 10.1016/0005-2736(92)90299-2. [DOI] [PubMed] [Google Scholar]
- 18.Benachir T., Lafleur M. Study of vesicle leakage induced by melittin. Biochim. Biophys. Acta. 1995;1235:452–460. doi: 10.1016/0005-2736(95)80035-e. [DOI] [PubMed] [Google Scholar]
- 19.Rex S., Schwarz G. Quantitative studies on the melittin-induced leakage mechanism of lipid vesicles. Biochemistry. 1998;37:2336–2345. doi: 10.1021/bi971009p. [DOI] [PubMed] [Google Scholar]
- 20.Arbuzova A., Schwarz G. Pore-forming action of mastoparan peptides on liposomes: a quantitative analysis. Biochim. Biophys. Acta. 1999;1420:139–152. doi: 10.1016/s0005-2736(99)00098-x. [DOI] [PubMed] [Google Scholar]
- 21.Yandek L.E., Pokorny A., Almeida P.F.F. Wasp mastoparans follow the same mechanism as the cell-penetrating peptide transportan 10. Biochemistry. 2009;48:7342–7351. doi: 10.1021/bi9008243. [DOI] [PMC free article] [PubMed] [Google Scholar]
- 22.Gregory S.M., Cavenaugh A., Almeida P.F. A quantitative model for the all-or-none permeabilization of phospholipid vesicles by the antimicrobial peptide cecropin A. Biophys. J. 2008;94:1667–1680. doi: 10.1529/biophysj.107.118760. [DOI] [PMC free article] [PubMed] [Google Scholar]
- 23.Belmonte G., Cescatti L., Menestrina G. Pore formation by Staphylococcus aureus alpha-toxin in lipid bilayers. Dependence upon temperature and toxin concentration. Eur. Biophys. J. 1987;14:349–358. doi: 10.1007/BF00262320. [DOI] [PubMed] [Google Scholar]
- 24.Pokorny A., Birkbeck T.H., Almeida P.F.F. Mechanism and kinetics of δ-lysin interaction with phospholipid vesicles. Biochemistry. 2002;41:11044–11056. doi: 10.1021/bi020244r. [DOI] [PubMed] [Google Scholar]
- 25.Pokorny A., Almeida P.F.F. Kinetics of dye efflux and lipid flip-flop induced by δ-lysin in phosphatidylcholine vesicles and the mechanism of graded release by amphipathic, α-helical peptides. Biochemistry. 2004;43:8846–8857. doi: 10.1021/bi0497087. [DOI] [PubMed] [Google Scholar]
- 26.Yandek L.E., Pokorny A., Almeida P.F. Mechanism of the cell-penetrating peptide transportan 10 permeation of lipid bilayers. Biophys. J. 2007;92:2434–2444. doi: 10.1529/biophysj.106.100198. [DOI] [PMC free article] [PubMed] [Google Scholar]
- 27.Schwarz G., Robert C.H. Pore formation kinetics in membranes, determined from the release of marker molecules out of liposomes or cells. Biophys. J. 1990;58:577–583. doi: 10.1016/S0006-3495(90)82401-2. [DOI] [PMC free article] [PubMed] [Google Scholar]
- 28.Grant E., Jr., Beeler T.J., Roseman M.A. Mechanism of magainin 2a induced permeabilization of phospholipid vesicles. Biochemistry. 1992;31:9912–9918. doi: 10.1021/bi00156a008. [DOI] [PubMed] [Google Scholar]
- 29.Matsuzaki K., Murase O., Miyajima K. Orientational and aggregational states of magainin 2 in phospholipid bilayers. Biochemistry. 1994;33:3342–3349. doi: 10.1021/bi00177a027. [DOI] [PubMed] [Google Scholar]
- 30.Gregory S.M., Pokorny A., Almeida P.F.F. Magainin 2 revisited: a test of the quantitative model for the all-or-none permeabilization of phospholipid vesicles. Biophys. J. 2009;96:116–131. doi: 10.1016/j.bpj.2008.09.017. [DOI] [PMC free article] [PubMed] [Google Scholar]
- 31.Saberwal G., Nagaraj R. Interaction of hydrophobic peptides with model membranes: slow binding to membranes and not subtle variations in pore structure is responsible for the gradual release of entrapped solutes. Biochim. Biophys. Acta. 1993;1151:43–50. doi: 10.1016/0005-2736(93)90069-c. [DOI] [PubMed] [Google Scholar]
- 32.Rapaport D., Peled R., Shai Y. Reversible surface aggregation in pore formation by pardaxin. Biophys. J. 1996;70:2502–2512. doi: 10.1016/S0006-3495(96)79822-3. [DOI] [PMC free article] [PubMed] [Google Scholar]
- 33.Kanellis P., Romans A.Y., Segrest J.P. Studies of synthetic peptide analogs of the amphipathic helix. Effect of charged amino acid residue topography on lipid affinity. J. Biol. Chem. 1980;255:11464–11472. [PubMed] [Google Scholar]
- 34.Parente R.A., Nir S., Szoka F.C., Jr. Mechanism of leakage of phospholipid vesicle contents induced by the peptide GALA. Biochemistry. 1990;29:8720–8728. doi: 10.1021/bi00489a031. [DOI] [PubMed] [Google Scholar]
- 35.Rathinakumar R., Wimley W.C. Biomolecular engineering by combinatorial design and high-throughput screening: small, soluble peptides that permeabilize membranes. J. Am. Chem. Soc. 2008;130:9849–9858. doi: 10.1021/ja8017863. [DOI] [PMC free article] [PubMed] [Google Scholar]
- 36.Ostolaza H., Bartolomé B., Goñi F.M. Release of lipid vesicle contents by the bacterial protein toxin α-haemolysin. Biochim. Biophys. Acta. 1993;1147:81–88. doi: 10.1016/0005-2736(93)90318-t. [DOI] [PubMed] [Google Scholar]
- 37.Andersson A., Danielsson J., Mäler L. Kinetic models for peptide-induced leakage from vesicles and cells. Eur. Biophys. J. 2007;36:621–635. doi: 10.1007/s00249-007-0131-9. [DOI] [PubMed] [Google Scholar]
- 38.Stella L., Mazzuca C., Pispisa B. Aggregation and water-membrane partition as major determinants of the activity of the antibiotic peptide trichogin GA IV. Biophys. J. 2004;86:936–945. doi: 10.1016/S0006-3495(04)74169-7. [DOI] [PMC free article] [PubMed] [Google Scholar]
- 39.Mazzuca C., Stella L., Pispisa B. Mechanism of membrane activity of the antibiotic trichogin GA IV: a two-state transition controlled by peptide concentration. Biophys. J. 2005;88:3411–3421. doi: 10.1529/biophysj.104.056077. [DOI] [PMC free article] [PubMed] [Google Scholar]
- 40.Gatto E., Mazzuca C., Pispisa B. Effect of peptide lipidation on membrane perturbing activity: a comparative study on two trichogin analogues. J. Phys. Chem. B. 2006;110:22813–22818. doi: 10.1021/jp064580j. [DOI] [PubMed] [Google Scholar]
- 41.Bocchinfuso G., Palleschi A., Stella L. Different mechanisms of action of antimicrobial peptides: insights from fluorescence spectroscopy experiments and molecular dynamics simulations. J. Pept. Sci. 2009;15:550–558. doi: 10.1002/psc.1144. [DOI] [PubMed] [Google Scholar]
- 42.Shnerb N.M., Louzoun Y., Solomon S. The importance of being discrete: life always wins on the surface. Proc. Natl. Acad. Sci. USA. 2000;97:10322–10324. doi: 10.1073/pnas.180263697. [DOI] [PMC free article] [PubMed] [Google Scholar]
- 43.Goutsias J. Classical versus stochastic kinetics modeling of biochemical reaction systems. Biophys. J. 2007;92:2350–2365. doi: 10.1529/biophysj.106.093781. [DOI] [PMC free article] [PubMed] [Google Scholar]
- 44.Cao Y., Samuels D.C. Discrete stochastic simulation methods for chemically reacting systems. Methods Enzymol. 2009;454:115–140. doi: 10.1016/S0076-6879(08)03805-6. [DOI] [PMC free article] [PubMed] [Google Scholar]
- 45.Fedoroff N., Fontana W. Genetic networks. Small numbers of big molecules. Science. 2002;297:1129–1131. doi: 10.1126/science.1075988. [DOI] [PubMed] [Google Scholar]
- 46.Rao C.V., Wolf D.M., Arkin A.P. Control, exploitation and tolerance of intracellular noise. Nature. 2002;420:231–237. doi: 10.1038/nature01258. [DOI] [PubMed] [Google Scholar]
- 47.Blomberg C. Fluctuations for good and bad: the role of noise in living systems. Phys. Life Rev. 2006;3:133–161. [Google Scholar]
- 48.Matsuzaki K., Murase O., Miyajima K. An antimicrobial peptide, magainin 2, induced rapid flip-flop of phospholipids coupled with pore formation and peptide translocation. Biochemistry. 1996;35:11361–11368. doi: 10.1021/bi960016v. [DOI] [PubMed] [Google Scholar]
- 49.Stella L., Pallottini V., Ricci G. Electrostatic association of glutathione transferase to the nuclear membrane. Evidence of an enzyme defense barrier at the nuclear envelope. J. Biol. Chem. 2007;282:6372–6379. doi: 10.1074/jbc.M609906200. [DOI] [PubMed] [Google Scholar]
- 50.Maulucci G., De Spirito M., Briganti G. Particle size distribution in DMPC vesicles solutions undergoing different sonication times. Biophys. J. 2005;88:3545–3550. doi: 10.1529/biophysj.104.048876. [DOI] [PMC free article] [PubMed] [Google Scholar]
- 51.Pispisa B., Mazzuca C., Toniolo C. A combined spectroscopic and theoretical study of a series of conformationally restricted hexapeptides carrying a rigid binaphthyl-nitroxide donor-acceptor pair. Chemistry. 2003;9:4084–4093. doi: 10.1002/chem.200304727. [DOI] [PubMed] [Google Scholar]
- 52.Lis L.J., McAlister M., Parsegian V.A. Measurement of the lateral compressibility of several phospholipid bilayers. Biophys. J. 1982;37:667–672. [PMC free article] [PubMed] [Google Scholar]
- 53.Matsuzaki K., Murase O., Miyajima K. Kinetics of pore formation by an antimicrobial peptide, magainin 2, in phospholipid bilayers. Biochemistry. 1995;34:12553–12559. doi: 10.1021/bi00039a009. [DOI] [PubMed] [Google Scholar]
- 54.Schwarz G., Gerke H., Stankowski S. Incorporation kinetics in a membrane, studied with the pore-forming peptide alamethicin. Biophys. J. 1987;52:685–692. doi: 10.1016/S0006-3495(87)83263-0. [DOI] [PMC free article] [PubMed] [Google Scholar]
- 55.Schwarz G., Beschiaschvili G. Thermodynamic and kinetic studies on the association of melittin with a phospholipid bilayer. Biochim. Biophys. Acta. 1989;979:82–90. doi: 10.1016/0005-2736(89)90526-9. [DOI] [PubMed] [Google Scholar]
- 56.Dürr U.H.N., Sudheendra U.S., Ramamoorthy A. LL-37, the only human member of the cathelicidin family of antimicrobial peptides. Biochim. Biophys. Acta. 2006;1758:1408–1425. doi: 10.1016/j.bbamem.2006.03.030. [DOI] [PubMed] [Google Scholar]
- 57.Hallock K.J., Lee D.-K., Ramamoorthy A. MSI-78, an analogue of the magainin antimicrobial peptides, disrupts lipid bilayer structure via positive curvature strain. Biophys. J. 2003;84:3052–3060. doi: 10.1016/S0006-3495(03)70031-9. [DOI] [PMC free article] [PubMed] [Google Scholar]
Associated Data
This section collects any data citations, data availability statements, or supplementary materials included in this article.