

Abstract
This paper reports the development of a class of isoform-selective peptide substrates for measuring endogenous lysine deacetylase (KDAC) activities in cell culture. The peptides were first identified by comparing the substrate specificity profiles of the four KDAC isoforms KDAC2, KDAC3, KDAC8, and sirtuin 1 (SIRT1) on a 361-member hexapeptide array wherein the two C-terminal residues to the acetylated lysine were varied. The arrays were prepared by immobilizing the peptides to a self-assembled monolayer of alkanethiolates on gold and could therefore be analyzed by a mass spectrometry technique termed SAMDI (self-assembled monolayers for matrix assisted laser desorption/ionization time-of-flight mass spectrometry). Arrays presenting the selective substrates were treated with nuclear extracts from HeLa, Jurkat, and smooth muscle cells and analyzed to measure endogenous deacetylase activities. We then use the arrays to profile KDAC activity through the HeLa cell cycle. We find that the activity profile of the KDAC3 selective peptide closely mirrors the changing acetylation state of the H4 histone, suggesting a role for this enzyme in cell cycle regulation. This work is significant because it describes a general route for identifying selective substrates that can be used to understand the differential roles of members of the deacetylase enzyme family in complex biological processes and further because the label-free approach avoids perturbation of enzyme activity that has plagued fluorescence-based assays.
Acetylation of lysine is a post-translational modification involved in many eukaryotic cellular processes (1). Though most commonly associated with histone proteins (2), a recent proteomic study by Mann and colleagues identified nearly 2,000 proteins in acetylated form and showed that this modification is used globally in regulating cell function (3). This recognition has motivated a renaming of the histone acetyltransferase (HAT) and histone deacetylase (HDAC) enzymes to reflect their broader roles [now the lysine acetyltransferases (KATs) and the lysine deacetylases (KDACs) (4)] and has highlighted our limited understanding of the functions of the individual enzymes responsible for achieving and maintaining acetylation states.
A significant effort is now directed at understanding the differential roles that the 18 human KDAC isoforms play in regulating cell behavior (5−8). These studies remain hampered by a lack of molecular reagents, including selective substrates and inhibitors (9), that would aid in dissecting the roles of the KDACs in cell culture. In one example, probes were synthesized that structurally mimic the nonselective KDAC inhibitor suberoylanilide hydroxamic acid (SAHA) but were modified to include a photolinking group (5). The probes were introduced to cell cultures and lysates and then irradiated with UV light to promote the photo cross-linking to nearby proteins. The complexes were then isolated using click chemistry, digested, and analyzed by mass spectrometry to characterize the expression level of KDAC1 in cancer cells (5). These probes provide an excellent tool to identify KDACs and their protein binding partners but require the discovery of isoform-selective inhibitors on which to base the design of probes that can distinguish between isoforms and a substantial experimental effort to process and analyze samples. Further, binding of the probe to the enzyme does not verify that the enzyme is catalytically active. This limitation is particularly relevant in those cases where protein cofactors are required for activity, such as with KDAC3 (10), but may still bind the probe absent the cofactor. Additionally, in vitro deacetylase assay kits are now commercially available, including the Fluor de Lys assay by Enzo Life Sciences, where tetramer sequences based on known substrates are coupled with a fluorophore adjacent to the acetylated lysine. Deacetylation renders the substrate sensitive to trypsin proteolysis which releases the fluorophore and fluorescence is observed. This and analogous techniques (11) can detect endogenous activities in cell lysates but suffer from a lack of selectivity due to limitations in sequence variation resulting from the location of the fluorophore and therefore cannot distinguish activity among the different isozymes. Though moderate selectivity has been realized by chemically modifying the acetyl position (12−14), the assays are still subjected to perturbation of enzyme activity and specificity that often accompany these formats (15−19).
Mass spectrometry (MS) provides a label-free format that overcomes the limitations of label-dependent deacetylase assays. We previously reported an assay that uses mass spectrometry to follow the deacetylation of peptide substrates that are immobilized to self-assembled monolayers on gold, a technique termed SAMDI, and therefore avoids the use of radioisotopes and fluorescent tags common to many in vitro KDAC assays (20,21). We also showed that SAMDI could be combined with peptide arrays to profile the specificities of recombinant KDACs (22). In the present work, we used peptide arrays that vary substrate−enzyme interactions beyond the adjacent sites to identify a first generation set of label-free substrates that can distinguish isoform-selective activities among recombinant KDAC2, KDAC8, and SIRT1 and can measure endogenous activities in different cell lines. Finally, we prepared arrays to profile KDAC activity through the HeLa cell cycle to demonstrate the efficacy of using these substrates to investigate biological processes.
Results and Discussion
Peptide Arrays and SAMDI MS Profile KDAC Specificity
To identify active substrates for the KDACs, we first synthesized a library of 361 hexapeptides having an arginine residue on the N-terminal side of the acetylated lysine (a favorable interaction for all KDACs profiled here based on our previous work) (22) and a variable sequence at the two C-terminal residues to the acetylated lysine: Ac-GRKAcXZC-NH2 where X, Z = all amino acids except cysteine. The peptides were spotted onto a maleimide-terminated monolayer to immobilize the peptides in the format of an array, which was then treated with a KDAC enzyme and analyzed by SAMDI-MS to determine the degree of deacetylation for each substrate (1). Since we know the sequence of the peptide substrate on each spot in the array, we could identify the specific residues that contribute to activity.
Figure 1.
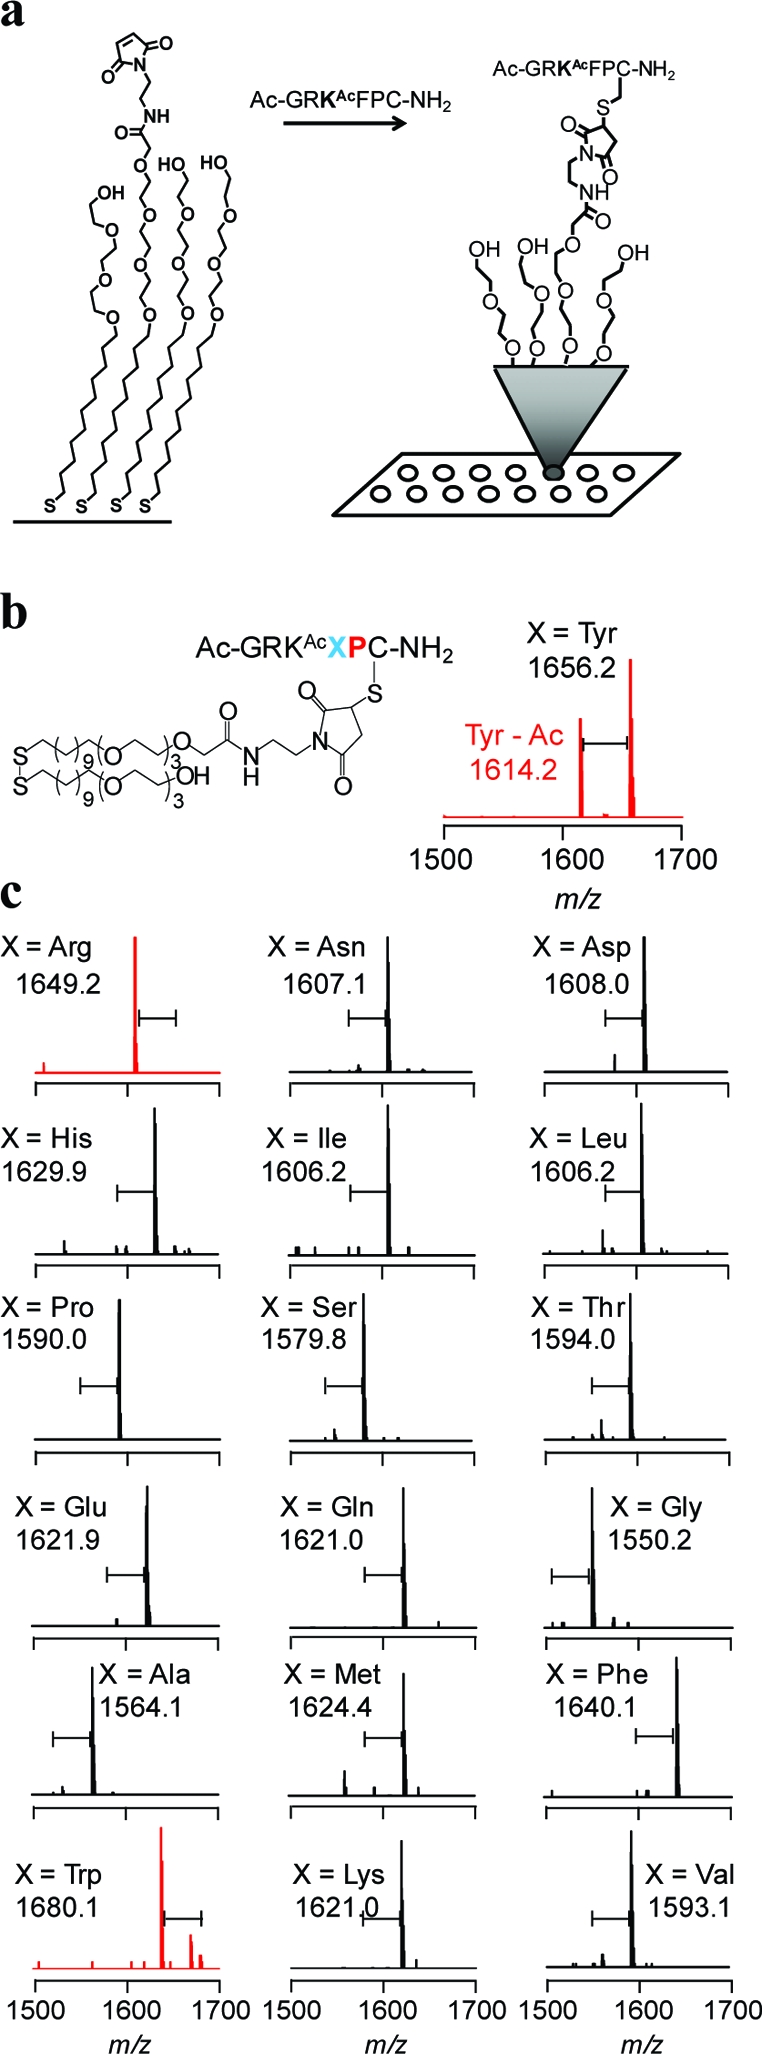
SAMDI follows the deacetylation of peptides immobilized to maleimide-terminated self-assembled monolayers. a) An array of self-assembled monolayers presenting maleimide groups allows the specific immobilization of cysteine-terminated peptides in a uniform orientation and density. b) The structure of the monolayer and immobilized peptide and the corresponding SAMDI spectrum after treatment with SIRT1 where X = Tyr. c) A series of representative SAMDI spectra where a shift of m/z 42 corresponds to a deacetylation reaction. Red spectra indicate reactions where SIRT1 showed high activity for the substrate.
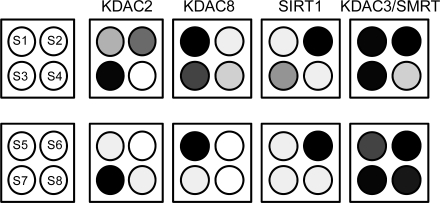
In a first example, we treated the peptide array with KDAC8 and analyzed the array by SAMDI-MS. Consistent with a previous study (22), the array revealed a high specificity for the tripeptide motif RKAcF but also demonstrated that when Phe occupies the X position, the Z position has little influence on KDAC8 activity. Indeed, the most active substrate had Gly in the Z position, whereas Glu, Asp, and Gln displayed the lowest activities (2, panel a). The SIRT1 fingerprint displayed specificity much lower than that of KDAC8 and showed a preference for those substrates having either Arg or aromatic residues in the X position. As with KDAC8, the presence of an acidic residue in the Z site reduced activity. This array also revealed that SIRT1 has a general preference for aromatic residues in the Z position, but this effect depends on the residue in the X position, with the most active substrates having either basic or hydrophobic residues in the X position. Additionally, the favorable effect of having an aromatic residue in the Z position is negated by placement of Pro in the X position, presumably owing to the bent conformation of this substrate (2, panel b).
Figure 2.

Specificity fingerprints determined by SAMDI for a) KDAC8, b) SIRT1, c) KDAC2, and d) KDAC3/SMRT. An array of peptides having sequence Ac-GRKAcXZC-NH2 was created, where the X and Z residues are shown on the horizontal and vertical axes, respectively. The degree of deacetylation was determined by SAMDI and is represented by the gray scale bar.
The specificity profiles of KDAC2 and KDAC3/SMRT are similar in that every substrate for KDAC2 is also a substrate for KDAC3/SMRT, which is consistent with the high sequence similarity of the enzymes. KDAC2 prefers Arg, Tyr, or Trp in the X site, but the extent of activity is influenced by the Z residue, with Lys, Arg, His, Trp, Phe, Leu, or Gly being the most active (2, panel c). The KDAC3/SMRT complex also prefers aromatic residues in the X or Z positions, especially Trp, but is less active when acidic residues occupy the neighboring site. This KDAC3 complex is most active toward substrates having aromatic residues in both the X and Z sites (2, panel d). This enzyme is also the least specific of those analyzed here in its recognition of substrates.
The specificity profiles provide a clear view of the sequence characteristics that give substrates that are optimally active for each enzyme isoform. We find that the most active substrates presented here, those having an N-terminal Arg to the acetylated lysine and with basic and aromatic residues favored at the C-terminal position relative to the acetylated lysine, do not mimic many of the known natural substrates, including histones. However, this is not surprising since histones make up only a small percentage of proteins in the acetylome (3), and we hypothesize that the natural substrates are not optimized toward deacetylase activity, in order to introduce a mechanism to regulate enzymatic activity. However, we note that Tyr and Phe were recently found to be among the most frequently occurring residues adjacent to acetylated lysines on nonhistone substrates (3), and a recent study identified that estrogen-related receptor α is a substrate for KDAC8, where Lys129 has Arg in the −1 position (24). Therefore, by screening nonbiased peptide libraries we were able to identify optimal sequences that may have been overlooked had the design of the substrates been based on only currently known substrates, a strategy commonly adopted by fluorescent-based assays that prevents the detection of unknown activities. The approach we employ is also useful for identifying substrates that display selectivity toward a particular KDAC isoform. These reagents will be important to measure the activity from different KDAC isoforms in complex cellular samples, as demonstrated below, to further our understanding of the differential roles of these enzymes in cellular behavior.
Identification of Isoform-Selective Substrates
On the basis of the specificity profiles, we selected four peptides that were optimized for both activity and selectivity toward the set of KDAC2, KDAC8, SIRT1, and KDAC3/SMRT. The peptides varied only in the identity of residues at the X and Z positions (S5−S8 in 1). For comparison, we also evaluate active substrates that were found in an earlier study (22) that varied the peptide sequence only at the X position (S1−S4). We first prepared identical arrays containing S1−S4 for use in profiling each KDAC to determine the relative activities for deacetylation. These profiles reveal that peptides S1−S3 have modest selectivity toward KDAC8, SIRT1, and KDAC2, respectively, but wherein each substrate has measurable activity by the other enzymes, with KDAC3/SMRT displaying significant activity toward each of the three peptides (3, panel a top). Optimization of the residue at the Z position gave peptides S5−S8 and led to a substantially improved specificity of these peptides (3, panel a bottom). For example, substrate S1 is deacetylated by KDAC8 and KDAC3/SMRT and partially deacetylated by KDAC2, but peptide S5 having a Pro in the Z position retained activity for KDAC8 and KDAC3/SMRT (although to a lesser extent than KDAC8) but was no longer a substrate for KDAC2. To clearly define how selective S5 is for KDAC8, we calculated a specificity factor by dividing the activity of KDAC8 on S5 by the sum of the activities by all enzymes (1). Because of the promiscuity of KDAC3/SMRT, we have calculated a specificity factor for both the three-enzyme system (including KDAC2, KDAC8, and SIRT1) and the four-enzyme system (including all enzymes in this study). Similarly, placement of a Val in the Z site of S2 gave peptide S6, which was active for SIRT1 but lost its activity for KDAC2 and 8. With peptide S7, placement of Trp at the Z position of peptide S3 retained activity for KDAC2 but lowered activity for KDAC8 and SIRT1. In each of these cases, KDAC3/SMRT retained activity for these peptides, reflecting the poor specificity of this deacetylase. We did find, however, that placement of Arg at the Z site of S4 gave a peptide that had a higher activity for KDAC3/SMRT (S8) compared with that of the other KDACs profiled (3, panel b).
Table 1. Peptide substrates for KDAC8, SIRT1, KDAC2, and KDAC3/SMRT used in SAMDI assays and specificity factor for the three-enzyme system (KDAC2, KDAC8, and SIRT1) and the four-enzyme system (all enzymes included).
| Peptide | Substrate sequence | Specificity factor for 3 (4) enzymes |
|---|---|---|
| S1 | Ac-GRKAcFGC-NH2 | 0.76 (0.43) |
| S2 | Ac-GRKAcRGC-NH2 | 0.71 (0.42) |
| S3 | Ac-GRKAcYGC-NH2 | 0.50 (0.33) |
| S4 | Ac-GRKAcNGC-NH2 | − (0.43) |
| S5 | Ac-GRKAcFPC-NH2 | 0.91 (0.57) |
| S6 | Ac-GRKAcRVC-NH2 | 0.95 (0.50) |
| S7 | Ac-GRKAcYWC-NH2 | 0.83 (0.47) |
| S8 | Ac-GRKAcNRC-NH2 | − (0.95) |
Figure 3.

Identification of isoform-selective peptides. a) Active substrates from the first peptide library (top) demonstrate enhanced selectivity after changing the residue in the Z position (bottom). b) An overlay of SAMDI spectra of substrates S5−S8 treated with KDAC2, KDAC8, SIRT1, and KDAC3/SMRT demonstrate the selectivity of each peptide substrate. Deacetylase activity is indicated by the red arrow.
We next assayed a set of peptides that were designed to determine whether optimization of the residue adjacent to the N-terminal Arg (at the −2 position to the acetylated lysine) would lead to improved activity and specificity. We synthesized 54 additional peptides with substitutions at this position of substrates S5−S7 with each amino acid (excluding cysteine) and found that the amino acid identity at this position had a less significant impact on activity (data not shown). We were unable to identify active substrates for KDAC2 or SIRT1 that lacked activity toward KDAC3/SMRT. In the case of KDAC8, we found that placement of Asp or Glu in this position resulted in nearly no activity with KDAC3/SMRT but also significantly reduced KDAC8 activity (Supplementary Figure S1).
Assays of Endogenous KDAC Activity
We used the SAMDI assay to determine whether our peptide substrates could measure endogenous activities in nuclear extracts from three cell lines: HeLa, Jurkat, and smooth muscle cells. We first assayed the extracts with a nonselective peptide, Ac-GRKAcYYC-NH2, that was generally deacetylated by the four recombinant enzyme isoforms profiled here. The extracts were applied to a monolayer presenting the peptide for 16 h at 37 °C and then rinsed, and the monolayers were analyzed by SAMDI to determine the fraction of peptide that had been deacetylated. Each of the extracts showed deacetylase activity, with the greatest activity found with the HeLa extract (Supplementary Figure S2, panel a), consistent with the use of this cell line as a source of KDAC activity in many deacetylase assays. We then applied the HeLa extract to peptide arrays presenting the selective substrates S5−S8. The HeLa extracts gave efficient deacetylation of peptides S6, S7, and S8, which suggests the presence of KDAC2, SIRT1, and KDAC3. Peptide S5, the KDAC8 substrate, was only weakly deacetylated compared to the other peptides (4, panel a). To confirm that peptide S6 was deacetylated by SIRT1, we repeated the reactions with HeLa extracts in the absence of NAD+, and we observed a significant decrease in activity only with the SIRT1-selective substrate S6 (4, panel b). Western blot analysis of the protein expression of these four KDACs in HeLa extracts shows bands for KDAC2, KDAC3, and SIRT1, whereas KDAC8 was undetected (Supplementary Figure S2, panel b), consistent with the activities determined by SAMDI.
Figure 4.

Measurement of endogenous KDAC activity using SAMDI. a) Nuclear extracts (NE) from HeLa, Jurkat, and smooth muscle cells were applied to arrays presenting the selective substrates and analyzed by SAMDI. b) Treatment of HeLa nuclear extracts on the selective substrates in the absence of NAD+, the required cofactor for SIRT1 activity, causes a decrease in deacetylation of the SIRT1 substrate.
Parallel experiments with extracts from the Jurkat and smooth muscle cells gave further evidence that these substrates could resolve isoform-specific deacetylase activities. With the Jurkat cell line, which demonstrated low levels of general KDAC activity, the KDAC2 substrate S7 was most efficiently deacetylated, whereas the other three substrates exhibited minimal deacetylation. Extracts from smooth muscle cell cultures showed deacetylation of the peptides optimized for KDAC2, SIRT1, and KDAC8, and the KDAC3 substrate was weakly deacetylated. The detection of KDAC8 activity is consistent with earlier reports that this isoform is highly expressed in this cell type (25) and consistent with our Western blot analysis (Supplementary Figure S2, panel b). It is important to note that although the Western blot analysis does not always correlate to our SAMDI activity profiles, this analytical technique only provides information on the level of protein expression and not the level of enzyme activity, which is critical for understanding the role of individual isozymes in regulating complex biological behavior.
We then compared the ability of the popular Fluor de Lys assay to distinguish between endogenous isoform activities to that of the SAMDI method. We used two Fluor de Lys substrates that are advertised for a particular KDAC isoform, KDAC8 (RHKAcKAc-FdL; KI-178) and SIRT1 (RHKKAc-FdL; KI-177). We observed fluorescence on both substrates upon treatment with HeLa nuclear extracts (data not shown), which could be interpreted to mean that the extracts contain both KDAC8 and SIRT1, a conclusion that contradicts the results from both SAMDI and Western blot analysis. Furthermore, recent reports have shown that these substrates are not active toward their respective enzymes absent the fluorophore (19,22) and that the presence of the fluorophore can significantly alter the effect of potential inhibitors and activators (18). Taken together, these results further demonstrate the importance of using a label-free activity assay, which can optimize substrates for activity and selectivity, for investigating this family of enzymes.
KDAC Activity through the Cell Cycle
Acetylation is an important post-translational modification involved in cell cycle regulation. Recent evidence has shown that histones are hypoacetylated during mitosis (26−31) and treatment of cells with nonselective KDAC inhibitors leads to cell cycle arrest at G2/M (32). These reports suggest that the KDAC enzyme family is involved in cell cycle maintenance, but there is a lack of suitable methods to directly observe the activity of the enzyme family and identify which isoforms are responsible for maintaining key acetylation states. Common strategies to detect acetylation rely on antibodies that bind to acetylated lysines, and this allows a comparison between acetylation states in different cellular samples (33). Mass spectrometry that incorporates SILAC technology (34) has been successful in quantifying acetylation patterns through cell cycle (30) but lacks the ability to identify which enzymes are active and responsible for the observed acetylation states. Studying individual enzymes using knockout strategies (35,36) is informative, yet it is unclear whether a change in acetylation state or phenotype is due to the loss of specific activity or a key protein−protein interaction and cannot account for enzyme redundancy. Here we demonstrate the ability of SAMDI to monitor activity in a complex biological process by measuring KDAC activity through the HeLa cell cycle using a combination of the selective and nonselective reagents described above.
In a first example, we treated HeLa cells with thymidine and nocodazole to arrest them in the G1/S phase and the G2/M phase, respectively, and we then analyzed the DNA content of the cells by flow cytometry using propidium iodide to confirm that the majority of cells were in the expected phase (5, panel a). We then isolated and applied the nuclear extracts from the two cellular conditions at a total protein concentration of 1 mg mL−1 to a peptide array presenting a series of nonselective KDAC substrates (Ac-GRKAcYYC-NH2, Ac-GRKAcWRC-NH2, Ac-GRKAcWTC-NH2, Ac-GRKAcYRC-NH2, and Ac-GRKAcRWC-NH2). The SAMDI spectra show higher KDAC activity in the samples isolated in the G2/M phase (5, panels b and c), consistent with literature reports of hypoacetylated histones during G2/M (26−30). To supplement these results we compared the G1/S- and G2/M-arrested cells using an antibody against acetylated H4 by Western blot of nuclear extracts and immunofluorescence of adherent cells. We observe a lower level of acetylated histone H4 in the G2/M phase cells compared to G1/S with Western blot analysis (5, panel d) and with immunofluorescence (5, panel e).
Figure 5.

KDAC activity is higher during G2/M than G1/S. a) Flow cytometry analysis indicating successful synchronization and segregation of cell populations after treatment of thymidine (G1/S) and nocodazole (G2/M). b) Representative SAMDI spectra of three nonselective peptides after treatment with nuclear extracts from G1/S (top) and G2/M arrested cells (bottom). c) SAMDI analysis from 5 nonselective peptides. *p-value <0.05. d) Western blot analysis of acetylated H4 in G1/S versus G2/M cell populations. e) Immunofluoresence of acetylated H4 (red, acetyl-H4; green, actin; blue, nuclei). Scale bar = 20 μm. Error bars are standard deviations of the average nuclear fluorescence for 17 (G2/M) and 34 (G1/S) cells.
We next wanted to observe fluctuations in KDAC activity through the cell cycle. We synchronized the cells in the G1/S phase with thymidine, released the cells from the thymidine block, and the cells were then allowed to proceed through the cell cycle. We isolated the nuclear extracts at 4-h intervals and analyzed the cell cycle progression using flow cytometry with propidium iodide. After synchronization the majority of cells are in G1/S phase (88%). After release the cells go through S phase at 4 h (81%) and G2/M phase at 8 h (61%), and after 12 h, the majority of cells are back at G1/S (82%) (6, panel a). We applied the nuclear extracts to arrays presenting a series of nonselective and selective substrates and measured the KDAC activity using SAMDI. The spectra showed an increase in KDAC activity at 4 h after thymidine release, when the cells were mainly in S phase, and reached a maximum peak at 8 h (G2/M phase), and then the activity decreased at the 12 h time point, when the cells had completed the cycle and returned to G1/S (6, panel b). Analysis of multiple nonselective peptides demonstrated that all peptides displayed similar behavior, although the degree to which the activity decreased at 12 h varied slightly (6, panel c). To determine if our SAMDI analysis was consistent with the levels of histone H4 acetylation (a marker of cell cycle) (37), we treated the extracts with the acetylated H4 antibody and observed the extent of acetylation using Western blot analysis. The results show a decrease in acetylation through the 8 h time point (G2/M) and then increase again at 12 h (G1/S) (6, panel d), consistent with our SAMDI analysis.
Figure 6.

KDAC activity monitored during cell cycle. a) Flow cytometry analysis indicating synchronization and cell cycle progression after release from thymidine block. b) Representative SAMDI spectra from three peptides treated with nuclear extracts from different phases. c) SAMDI analysis of KDAC activity using 5 nonselective KDAC substrates. *p-value <0.0005; **p-value <0.005. d) Western blot analysis of H4 acetylation through cell cycle. e) Inverse relationship between KDAC activity and H4 acetylation through cell cycle.
Finally, we used isoform-selective substrates S6−S8 to profile the activity of KDAC2, KDAC3, and SIRT1 through the HeLa cell cycle (7, panel a). We observe a continuous increase in the SAMDI activity profile for KDAC2, a similar pattern to the expression profile of KDAC2 as determined by Western blot (7, panel b). Our observation that acetylation of the H4 histone tail and KDAC2 activity diverge at the 12 h time point suggests that either the H4 histone is not a substrate for KDAC2 at this particular time point or that KDAC2 may not be involved in regulating the cell cycle, the latter supported in the literature (38). The SAMDI profile for KDAC3 activity increases through S phase, peaks at G2/M, and then decreases back at G1/S. Western blot analysis of KDAC3 displays a similar pattern, although we note that this may not directly relate to activity since activity is dependent on protein cofactors. We therefore analyzed expression of the cofactor NCOR and observed the same pattern, supporting the activity profile determined by SAMDI. The KDAC3 activity profile also closely matches with the acetylation of the H4 histone tail, which has been shown to be cell cycle dependent (37), and therefore suggests that KDAC3 is important in H4 deacetylation and cell cycle maintenance. This result also supports previous reports that showed that selective knockdown of KDAC3 but not KDAC1 or KDAC2 resulted in hyperacetylation of H4 and cell cycle arrest in G2/M (29,39). The activity profile of SIRT1 appears to resemble the general KDAC activity pattern, increasing through G2/M followed by a decrease at the 12 h time point, but Western blot analysis shows essentially equal expression throughout the cell cycle. It is also possible that the higher activity observed during G2/M with the SIRT1 substrate is due to overlapping activity by other isoforms such as KDAC3, as observed above with the recombinant enzymes. This ambiguity will be addressed as more selective substrates are identified.
Figure 7.

Selective KDAC activity through cell cycle using isoform-selective substrates S6−S8. a) SAMDI analysis of KDAC2, SIRT1, and KDAC3 through the HeLa cell cycle. *p-value <5 × 10⁻⁶; **p-value <1 × 10⁻⁶; #p-value <1 × 10⁻⁴. b) Western blot analysis indicating KDAC expression level through the cell cycle.
This paper addresses the current lack of peptide substrates that are selective for the KDAC isoforms. The use of SAMDI-MS and peptide arrays is significant because this method does not rely on labels that restrict the peptide sequence and therefore the development of selective substrates. The arrays allow an efficient profiling of hundreds of substrates and can identify those substrates that have the combination of activityandspecificity that will be important to resolving the deactylases. In addition to illustrating the benefits of this approach, this early report provides a set of peptides that have significantly improved specificity compared with that of the current assays, including the popular Fluor de Lys assay. As we continue developing reagents for other members of the KDAC family, we recognize that it may be difficult to identify highly selective peptides for each isoform. Rather, we expect that the approach described here will provide a set of peptide substrates that vary in their specificity for members of the KDAC family but as a set provide a high resolution profile of deacetylase activity in the cell. Further work that develops substrates for other KDACs and further optimizes the substrates, through for example the inclusion of non-natural amino acids, will provide the molecular reagents that may have broad value in advancing the biology of acetylation. This goal parallels the development of peptide reagents for profiling the caspase family of proteases, where the reagents are not highly selective for individual isoforms but nonetheless have been critical to advancing our understanding of the roles of these enzymes in cell function (17,40).
Methods
Reagents
All reagents are described in Supporting Information, as well as detailed methods for KDAC8 expression, cell culture, nuclear extract isolation protocols, flow cytometry, immunofluorescence, and Western blot analysis.
Synthesis of Peptide Library
Individual lanterns (Mimotopes) were placed in each well of a 96-well filter plate, and the filters were plugged. The N-terminal fluorenylmethyloxycarbonyl (FMOC) was deprotected with 20% piperidine in N′,N′-dimethylformamide (DMF) for 10 min, the solvent was then filtered with a vacuum manifold, and the process was repeated. The lanterns were then washed 5 times with DMF. A solution containing 15 mol equiv of amino acid, hydroxybenzotriazole (HOBt), and diisopropylcarbodiimide (DIC) was prepared, applied to each well, and incubated at RT for 2 h. The solutions were then filtered, the lanterns were washed 5 times with DMF, and then the next FMOC was deprotected. After acetylation of the N-terminus with 10% acetic anhydride in DMF for 30 min, a cleavage cocktail was applied to the lanterns containing 95% trifluoroacetic acid (TFA), 2.5% H2O, and 2.5% triisopropylsilane (TIS) and incubated at RT for 2 h. The solutions were then evaporated by flowing nitrogen over the plate for 16 h. The residues were taken up in water, transferred to a 1.5 mL microcentrifuge tube, and lyophilized overnight. The remaining solids were then suspended in deionized ultrafiltered (DIUF) water with 0.1% TFA and stored in a 384 plate at −20 °C.
KDAC Assay
(a) SAMDI: Peptide arrays were prepared by applying 1−2 μL of a 1:1 mixture of the stock peptide solution with 25 mM Tris pH 7.5 to slides patterned with gold circles (one peptide per circle) presenting maleimide terminated monolayers (23) and incubated at 37 °C for 1 h for recombinant proteins and 16 h for nuclear extract treated arrays. Following immobilization, the slides were washed with DIUF water and ethanol and then dried under nitrogen. KDAC enzymes were diluted, applied to each circle, and incubated at 37 °C for 1 h (in volumes of 1 μL). The slides were then rinsed with DIUF water and ethanol and dried under nitrogen. Monolayers were treated with matrix (2,4,6-trihydroxyacetophenone, 0.01 μL, 25 mg mL−1 in acetone), air-dried, and analyzed by SAMDI to produce a mass spectrum for each circle. (b) Fluorescence: The Fluor de Lys Assay was used according to the manufacturer’s instructions, and the fluorescence was measured on a Tecan Safire 2 fluorescence plate reader.
Mass Spectrometry
Mass analysis was performed using a 4800 MALDI-TOF/TOF (Applied Biosystems). A 355 nm Nd:YAG laser was used as a desorption/ionization source, and all spectra were acquired with 20 kV accelerating voltage using positive reflector mode. The extraction delay was 450 ns, 1200 laser shots were applied, and the entire surface of the circle was sampled. Each spectrum was calibrated using the EG3-EG3 disulfide background as an internal standard, and the extent of reaction was calculated as previously reported (22).
Acknowledgments
This work was supported by NIH (RO1 GM084188). Z.A.G.-L. is supported by the ARCS Foundation Chicago Chapter. K.A.K. is supported by a Ruth L. Kirschstein National Research Service Award Number F32GM087048 from the National Institute of General Medical Sciences of the National Institutes of Health. We would also thank Z. Lukic and J. Saric for assistance in KDAC8 expression and peptide synthesis.
Supporting Information Available
This material is available free of charge via the Internet at http://pubs.acs.org.
Funding Statement
National Institutes of Health, United States
Supplementary Material
References
- Yang X. J.; Seto E. (2008) Lysine acetylation: Codified crosstalk with other posttranslational modifications. Mol. Cell 31, 449–461. [DOI] [PMC free article] [PubMed] [Google Scholar]
- Strahl B. D.; Allis C. D. (2000) The language of covalent histone modifications. Nature 403, 41–45. [DOI] [PubMed] [Google Scholar]
- Choudhary C.; Kumar C.; Gnad F.; Nielsen M. L.; Rehman M.; Walther T. C.; Olsen J. V.; Mann M. (2009) Lysine acetylation targets protein complexes and co-regulates major cellular functions. Science 325, 834–840. [DOI] [PubMed] [Google Scholar]
- Allis C. D.; Berger S. L.; Cote J.; Dent S.; Jenuwien T.; Kouzarides T.; Pillus L.; Reinberg D.; Shi Y.; Shiekhattar R.; Shilatifard A.; Workman J.; Zhang Y. (2007) New nomenclature for chromatin-modifying enzymes. Cell 131, 633–636. [DOI] [PubMed] [Google Scholar]
- Salisbury C. M.; Cravatt B. F. (2008) Optimization of activity-based probes for proteomic profiling of histone deacetylase complexes. J. Am. Chem. Soc. 130, 2184–2194. [DOI] [PubMed] [Google Scholar]
- Cole P. A. (2008) Chemical probes for histone-modifying enzymes. Nat. Chem. Biol. 4, 590–597. [DOI] [PMC free article] [PubMed] [Google Scholar]
- Smith B. C.; Hallows W. C.; Denu J. M. (2008) Mechanisms and molecular probes of sirtuins. Chem. Biol. 59, 1002–1013. [DOI] [PMC free article] [PubMed] [Google Scholar]
- Chatterjee C.; Muir T. W. (2010) Chemical approaches for studying histone modifications. J. Biol. Chem. 285, 11045–11050. [DOI] [PMC free article] [PubMed] [Google Scholar]
- Bieliauskas A. V.; Pflum M. K. H. (2008) Isoform-selective histone deacetylase inhibitors. Chem. Soc. Rev. 37, 1402–1413. [DOI] [PMC free article] [PubMed] [Google Scholar]
- Guenther M. G.; Barak O.; Lazar M. A. (2001) The SMRT and N-CoR corepressors are activating cofactors for histone deacetylase 3. Mol. Cell. Biol. 21, 6091–6101. [DOI] [PMC free article] [PubMed] [Google Scholar]
- Ciossek T.; Julius H.; Wieland H.; Maier T.; Beckers T. (2008) A homogeneous cellular histone deacetylase assay suitable for compound profiling and robotic screening. Anal. Biochem. 372, 72–81. [DOI] [PubMed] [Google Scholar]
- Fatkins D. G.; Zheng W. P. (2008) A spectrophotometric assay for histone deacetylase 8. Anal. Biochem. 372, 82–88. [DOI] [PubMed] [Google Scholar]
- Riester D.; Wegener D.; Hildmann C.; Schwienhorst A. (2004) Members of the histone deacetylase superfamily differ in substrate specificity towards small synthetic substrates. Biochem. Biophys. Res. Commun. 324, 1116–1123. [DOI] [PubMed] [Google Scholar]
- Heltweg B.; Dequiedt F.; Marshall B. L.; Branch C.; Yoshida M.; Nishino N.; Verdin E.; Jung M. (2004) Subtype selective substrates for histone deacetylases. J. Med. Chem. 47, 5235–5243. [DOI] [PubMed] [Google Scholar]
- Kaeberlein M.; McDonagh T.; Heltweg B.; Hixon J.; Westman E. A.; Caldwell S. D.; Napper A.; Curtis R.; DiStefano P. S.; Fields S.; Bedalov A.; Kennedy B. K. (2005) Substrate-specific activation of sirtuins by resveratrol. J. Biol. Chem. 280, 17038–17045. [DOI] [PubMed] [Google Scholar]
- Borra M. T.; Smith B. C.; Denu J. M. (2005) Mechanism of human SIRT1 activation by resveratrol. J. Biol. Chem. 280, 17187–17195. [DOI] [PubMed] [Google Scholar]
- Su J.; Rajapaksha T. W.; Peter M. E.; Mrksich M. (2006) Assays of endogenous caspase activities: A comparison of mass spectrometry and fluorescence formats. Anal. Chem. 78, 4945–4951. [DOI] [PubMed] [Google Scholar]
- Pacholec M.; Bleasdale J. E.; Chrunyuk B.; Cunningham D.; Flynn D.; Garofalo R. S.; Griffith D.; Griffor M.; Loulakis P.; Pabst B.; Qiu X.; Stockman B.; Thanabal V.; Varghese A.; Ward J.; Withka J.; Ahn K. (2010) SRT1720, SRT2183, SRT1460, and resveratrol are not direct activators of SIRT1. J. Biol. Chem. 285, 8340–8351. [DOI] [PMC free article] [PubMed] [Google Scholar]
- Beher D.; Wu J.; Cumine S.; Kim K. W.; Lu S. C.; Atangan L.; Wang M. (2009) Resveratrol is not a direct activator of SIRT1 enzyme activity. Chem. Biol. Drug Des. 74, 619–624. [DOI] [PubMed] [Google Scholar]
- Gurard-Levin Z. A.; Mrksich M. (2008) The activity of HDAC8 depends on local and distal sequences of its peptide substrates. Biochemistry 47, 6242–6250. [DOI] [PMC free article] [PubMed] [Google Scholar]
- Mrksich M. (2008) Mass spectrometry of self-assembled monolayers: A new tool for molecular surface science. ACS Nano 2, 7–18. [DOI] [PMC free article] [PubMed] [Google Scholar]
- Gurard-Levin Z. A.; Kim J.; Mrksich M. (2009) Combining mass spectrometry and peptide arrays to profile the specificities of histone deacetylases. ChemBioChem 10, 2159–2161. [DOI] [PMC free article] [PubMed] [Google Scholar]
- Houseman B. T.; Gawalt E. S.; Mrksich M. (2003) Maleimide-functionalized self-assembled monolayers for the preparation of peptide and carbohydrate biochips. Langmuir 19, 1522–1531. [Google Scholar]
- Wilson B. J.; Tremblay A. M.; Deblois G.; Sylvain-Drolet G.; Giguere V. (2010) An acetylation switch modulates the transcriptional activity of estrogen-related receptor α. Mol. Endocrinol. 24, 1349–1358. [DOI] [PMC free article] [PubMed] [Google Scholar]
- Waltregny D.; Glenisson W.; Tran S. L.; North B. J.; Verdin E.; Colige A.; Castronovo V. (2005) Histone deacetylase HDAC8 associates with smooth muscle alpha-actin and is essential for smooth muscle cell contractility. FASEB J. 19, 966–968. [DOI] [PubMed] [Google Scholar]
- Marian B.; Wintersberger U. (1982) Modification of histones during the mitotic and meiotic cycle of yeast. FEBS Lett. 139, 72–76. [DOI] [PubMed] [Google Scholar]
- Valls E.; Sanchez-Molina S.; Martinez-Balbas M. A. (2005) Role of histone modifications in marking and activating genes through mitosis. J. Biol. Chem. 280, 42592–42600. [DOI] [PubMed] [Google Scholar]
- Kruhlak M. J.; Hendzel M. J.; Fischle W.; Bertos N. R.; Hameed S.; Yang X. J.; Verdin E.; Bazett-Jones D. P. (2001) Regulation of global acetylation in mitosis through loss of histone acetyltransferases and deacetylases from chromatin. J. Biol. Chem. 276, 38307–38319. [DOI] [PubMed] [Google Scholar]
- Li Y.; Kao G. D.; Garcia B. A.; Shabanowitz J.; Hunt D. F.; Qin J.; Phelan C.; Lazar M. A. (2006) A novel histone deacetylase pathway regulates mitosis by modulating Aurora B kinase activity. Genes Dev. 20, 2566–2579. [DOI] [PMC free article] [PubMed] [Google Scholar]
- Bonenfant D.; Towbin H.; Coulot M.; Schindler P.; Mueller D. R.; van Oostrum J. (2007) Analysis of dynamic changes in post-translational modifications of human histones during cell cycle by mass spectrometry. Mol. Cell. Proteomics 6, 1917–1932. [DOI] [PubMed] [Google Scholar]
- Sasaki K.; Ito T.; Nishino N.; Khochbin S.; Yoshida M. (2009) Real-time imaging of histone H4 hyperacetylation in living cells. Proc. Natl. Acad. Sci. U.S.A. 106, 16257–16262. [DOI] [PMC free article] [PubMed] [Google Scholar]
- Noh E. L.; Lim D. S.; Jeong G. J.; Lee J. S. (2009) An HDAC inhibitor, trichostatin A, induces a delay at G(2)/M transition, slippage of spindle checkpoint, and cell death in a transcription-dependent manner. Biochem. Biophys. Res. Commun. 378, 326–331. [DOI] [PubMed] [Google Scholar]
- Liu C. L.; Kaplan T.; Kim M.; Buratowski S.; Schreiber S. L.; Friedman N.; Rando O. J. (2005) Single-nucleosome mapping of histone modifications in S-cerevisiae. PLoS Biol. 3, 1753–1769. [DOI] [PMC free article] [PubMed] [Google Scholar]
- Ong S. E.; Blagoev B.; Kratchmarova I.; Kristensen D. B.; Steen H.; Pandey A.; Mann M. (2002) Stable isotope labeling by amino acids in cell culture, SILAC, as a simple and accurate approach to expression proteomics. Mol. Cell. Proteomics 1, 376–386. [DOI] [PubMed] [Google Scholar]
- Li M. X.; Jiang L. H.; Kelleher N. L. (2009) Global histone profiling by LC-FTMS after inhibition and knockdown of deacetylases in human cells. J. Chromatogr., B: Anal. Technol. Biomed. Life Sci. 877, 3885–3892. [DOI] [PMC free article] [PubMed] [Google Scholar]
- Haberland M.; Montgomery R. L.; Olson E. N. (2009) The many roles of histone deacetylases in development and physiology: implications for disease and therapy. Nat. Rev. Genet. 10, 32–42. [DOI] [PMC free article] [PubMed] [Google Scholar]
- Jasencakova Z.; Meister A.; Walter J.; Turner B. M.; Schubert I. (2000) Histone H4 acetylation of euchromatin and heterochromatin is cell cycle dependent and correlated with replication rather than with transcription. Plant Cell 12, 2087–2100. [DOI] [PMC free article] [PubMed] [Google Scholar]
- Zhu P.; Huber E.; Kiefer F.; Gottlicher M. (2004) Specific and redundant functions of histone deacetylases in regulation of cell cycle and apoptosis. Cell Cycle 3, 1240–1242. [DOI] [PubMed] [Google Scholar]
- Wilson A. J.; Byun D. S.; Popova N.; Murray L. B.; L’Italien K.; Sowa Y.; Arango D.; Velcich A.; Augenlicht L. H.; Mariadason J. M. (2006) Histone deacetylase 3 (HDAC3) and other class IHDACs regulate colon cell maturation and p21 expression and are deregulated in human colon cancer. J. Biol. Chem. 281, 13548–13558. [DOI] [PubMed] [Google Scholar]
- Talanian R. V.; Quinlan C.; Trautz S.; Hackett M. C.; Mankovich J. A.; Banach D.; Ghayur T.; Brady K. D.; Wong W. W. (1997) Substrate specificities of caspase family proteases. J. Biol. Chem. 272, 9677–9682. [DOI] [PubMed] [Google Scholar]
Associated Data
This section collects any data citations, data availability statements, or supplementary materials included in this article.