Abstract
Initially thought to play a restricted role in calcium homeostasis, the pleiotropic actions of vitamin D in biology and their clinical significance are only now becoming apparent. However, the mode of action of vitamin D, through its cognate nuclear vitamin D receptor (VDR), and its contribution to diverse disorders, remain poorly understood. We determined VDR binding throughout the human genome using chromatin immunoprecipitation followed by massively parallel DNA sequencing (ChIP-seq). After calcitriol stimulation, we identified 2776 genomic positions occupied by the VDR and 229 genes with significant changes in expression in response to vitamin D. VDR binding sites were significantly enriched near autoimmune and cancer associated genes identified from genome-wide association (GWA) studies. Notable genes with VDR binding included IRF8, associated with MS, and PTPN2 associated with Crohn's disease and T1D. Furthermore, a number of single nucleotide polymorphism associations from GWA were located directly within VDR binding intervals, for example, rs13385731 associated with SLE and rs947474 associated with T1D. We also observed significant enrichment of VDR intervals within regions of positive selection among individuals of Asian and European descent. ChIP-seq determination of transcription factor binding, in combination with GWA data, provides a powerful approach to further understanding the molecular bases of complex diseases.
There is increasing awareness of the biological actions of vitamin D (Holick 2007). The diversity of effects is remarkable but has not yet been fully placed in an evolutionary context. However, this process has begun with indications that lighter skin color evolved to optimize vitamin D production. Vitamin D deficiency, with resulting rickets-induced pelvic contraction, which is potentially lethal for the maternal–fetal unit, likely has exerted major selective pressures (Jablonski and Chaplin 2000). One billion people worldwide have vitamin D deficiency or insufficiency due to reduced sun exposure or inadequate intake for various reasons (Holick 2007). Vitamin D intake has been associated with reduced risk for several diseases, in particular multiple sclerosis (MS) (Ebers 2008), but also rheumatoid arthritis (RA), and type 1 diabetes (T1D) (Holick 2007). The molecular basis by which vitamin D exerts effects on such diseases remains incompletely understood, notably in relation to underlying genetic risk although recent studies have provided limited insights (Ramagopalan et al. 2009; Wang et al. 2010). Much vitamin D signaling occurs through binding by calcitriol, the active form of vitamin D, to its cognate nuclear vitamin D receptor (VDR). A heterodimer, formed with retinoid X receptor (RXR), then binds specific genomic sequences (vitamin D response elements, or VDREs) acting to influence gene transcription. A detailed understanding of the biological actions of vitamin D would elucidate relationships between vitamin D and numerous diseases. Recent advances in next-generation DNA sequencing now allow protein–DNA binding interactions to be identified using chromatin immunoprecipitation with massively parallel sequencing (ChIP-seq) with much greater depth, accuracy, and dynamic range than is possible using array-based hybridization approaches (Alekseyenko et al. 2008; Park 2009). Motivated by the biological and clinical significance of vitamin D–mediated gene regulation, we present here a comprehensive ChIP-seq genomic map of VDR-DNA binding and gene regulation in lymphoblastoid cell lines (LCLs) and show how this provides insights into genetic susceptibility to disease.
Results
Genome-wide VDR occupancy defined by ChIP-seq
We used ChIP-seq to identify the genomic locations bound by VDR in two LCLs (CEPH individuals GM10855 and GM10861 from the International HapMap Project) before and after calcitriol treatment. Peaks were called in the aligned sequence data using a model-based analysis of ChIP-seq (MACS) (Zhang et al. 2008) and compared with sequenced sonicated and amplified input DNA.
Previous studies have characterized a number of VDREs at candidate genes with validation by ChIP, showing that often two or more VDREs are clustered together and involved in modulating gene expression (Carlberg and Dunlop 2006). Our ChIP-seq data confirm VDR binding at specific gene loci such as the VDR gene itself (Zella et al. 2010), the proximal promoter of CCNC (encoding cyclin C) as previously reported (Sinkkonen et al. 2005), and in intron 4 of ALOX5 (encoding arachidonate 5-lipoxygenase) (Supplemental Fig. 1; Seuter et al. 2007). Our data also highlighted additional VDR-binding sites near these genes. For example, 15.4 kb downstream from ALOX5 is an inducible VDR binding site located within a DNase I hypersensitive and CTCF binding region, showing histone marks consistent with an active enhancer or similar regulatory element (Supplemental Fig. 1).
Basal occupancy
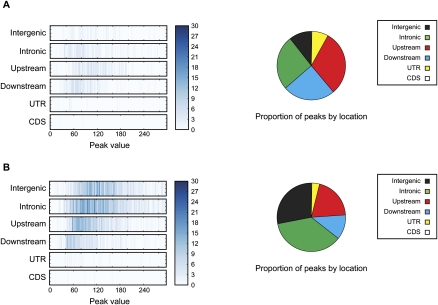
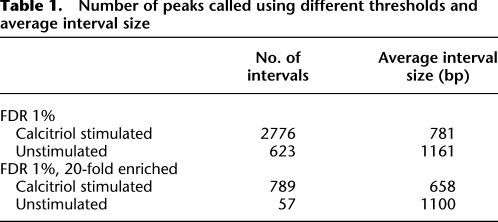
We identified 623 genomic regions occupied by VDR in the basal (unstimulated) state in these cell lines. We observed that VDR binding across the genome was more likely to occur in promoter regions, comprising 51% of the identified binding sites (Fig. 1). This may relate in part to amplification bias for open chromatin near to promoter regions, which has been recognized for ChIP-seq data sets. We tested for enrichment genome-wide of basal VDR binding sites with data from the ENCODE Project (Rosenbloom et al. 2010). We found 6.4-fold (P < 10−4) and fourfold (P < 10−4) enrichment of VDR basal occupancy in DNase I–hypersensitive and CTCF sites, respectively. Enrichments of VDR binding sites were twice as great in H3K4me3 and H3K27ac sites when compared with H3K4me1sites (H3K4me3: 8.7-fold enrichment, P < 10−4; H3K27ac: 8.7-fold enrichment, P < 10−4; H3K4me1: 3.6-fold enrichment, P = 10−4; H3K4me1 and H3K4me3 comparison: P < 10−4). We performed in silico binding site motif identification, and no known consensus motif was identified using MEME (Bailey and Elkan 1994) with an E-value threshold of 1 and the canonical rxrvdr motif using TOMTOM (Gupta et al. 2007) with a P-value threshold of 10−5. In addition, we examined MEME results for noncanonical motifs but found motifs that (1) occurred only in a small proportion of sequences submitted, (2) had only weak preferences for nucleotides at all positions, or (3) were compositionally biased. This was confirmed using GLAM2 and BioProspector (Liu et al. 2001; Frith et al. 2008).
Figure 1.
VDR binding intervals and genomic location. (A) Unstimulated cells. (B) Calcitrol-stimulated cells. Enrichment is shown by location with respect to gene structure (y-axis) and binding strength (peak value, maximum number of reads aligned to a genomic position within a ChIP-seq interval) (x–axis). Pie charts summarize the percentage of VDR binding sites based on location. Intergenic regions were defined as at least 5 kb away from the first or last exon of a gene, upstream (promoter) regions defined as within 5 kb of the transcriptional start site, and downstream regions as within 5 kb from the end of the last exon.
Calcitriol-stimulated binding
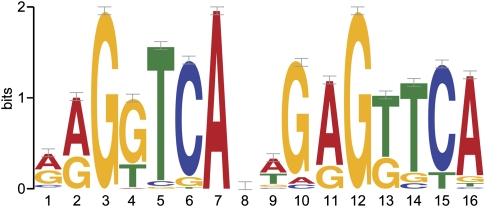
Upon stimulation with calcitriol, 2776 VDR binding sites were identified (Table 1; Supplemental Table 1). After stimulation, we found increased VDR binding in intronic (36%) and intergenic regions (28%) compared with the basal state (intronic 26%, intergenic 10%) (Figure 1). Among intervals detected by ChIP-seq and investigated for sequence signatures of VDR binding, the DR3 VDR motif was identified as the most significantly enriched motif (E-values < 10−69) (Fig. 2; Feldman et al. 2005). We looked for additional motifs that were similar to DR3 within the top 10 motifs returned by MEME (Bailey and Elkan 1994). We found three other motifs that showed similarity (P < 10−5 using TOMTOM (Gupta et al. 2007) to the DR3 motif. Using all such motifs we called all intervals by the presence or absence of VDR binding motifs within them. Sixty-seven percent of intervals could be explained by the presence of a DR3-like motif. Strong binding events were more likely to have a motif compared with weaker ones: 83% of the 25% strongest peaks contained the motif, compared with only 51% of the weakest 25% of peaks. It was also found that the DR3 VDR consensus motifs were predominantly located in introns and intergenic intervals: 73% of intervals in intronic and intergenic segments contained the motif, while only 59% of intervals within 5 kb upstream of a transcription start site contained a motif. Overall 58% of intervals with the motif contained only a single motif, while 39% contained two to four motifs. There was a modest but significant correlation between the number of binding motifs in an interval and the strength of the interval as assessed by peak height (r = 0.27, P < 10−11) (Supplemental Fig. 2).
Table 1.
Number of peaks called using different thresholds and average interval size
Figure 2.
MEME motif analysis for VDR intervals following calcitriol stimulation. The top-scoring motif found by MEME resembles the known VDR element. The nucleotide frequencies of the genomic sequences aligned at the motif are shown in a sequence logo representation (Schneider and Stephens 1990).
Calcitriol-stimulated VDR binding sites and their coincidence with ENCODE elements were assessed as before. Again, there was a greater enrichment of VDR binding sites within H3K4me3 and H3K27ac sites as compared with H3K4me1 (H3K4me3: ninefold enrichment, P < 10−4; H3K27ac: 9.6-fold enrichment, P < 10−4; H3K4me1: 4.8-fold enrichment, P = 10−4). The enrichment of VDR occupancy in DNase I–hypersensitive and CTCF sites was also significant (9.6-fold enrichment, P < 10−4 and 3.8-fold enrichment, P = 10−4). The enrichment seen in DNase I–hypersensitive sites was greater than that observed in the basal state (Supplemental Fig. 3). There was no difference in these enrichment values between intervals with a DR3 motif and those without.
We used microarrays to measure transcript abundance in the calcitriol-stimulated and unstimulated LCLs used for ChIP-seq analysis, together with three additional LCLs. Overall, 226 significantly upregulated and three significantly downregulated genes in calcitriol-stimulated lines were identified compared with basal. Details of significantly differentially expressed genes are available in Supplemental Table 2 and Supplemental Table 3. Gene ontology analysis showed that the differentially expressed genes were significantly enriched with those associated with immune functions (Supplemental Table 4). To investigate the role of VDR binding in vitamin D–mediated gene expression, we searched for VDR binding sites within 5 kb of the transcriptional start site (TSS) of vitamin D–responsive genes. Approximately 23% of vitamin D–responsive genes contained a VDR interval near the TSS, and, of these intervals, 96% had a DR3 motif. Excluding genes with a VDR binding site within 5 kb of the TSS, calcitriol-responsive genes had a VDR interval at a median distance of 66.6 kb away from the TSS as compared with genes with no significant effect on expression by calcitriol which had a VDR interval at a 352.8 kb median distance from the TSS (Mann-Whitney U test, P < 10−19).
VDR binding and disease
The action of VDR as a ligand-activated transcription factor illustrates how specific genetic and environmental risk factors may interact. Given the very rapid recent increase in our knowledge of genomic loci important in common disease through genome-wide association studies (GWAS), we sought to determine whether VDR binding sites preferentially occur within GWA study disease intervals.
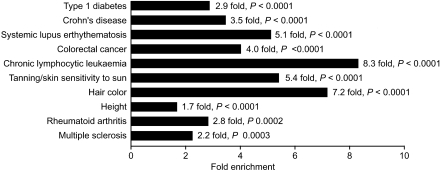
We analyzed GWAS intervals for T1D, Crohn's disease (CD), and MS together with 44 other common traits listed in the Catalog of Published Genome-Wide Association Studies (http://www.genome.gov/gwastudies) (traits and marker single nucleotide polymorphisms [SNPs] used are detailed in Supplemental Table 5). We found strikingly significant enrichment for VDR binding in associated intervals for MS, T1D, CD, systemic lupus erythematosus (SLE), RA, chronic lymphocytic leukemia, colorectal cancer, hair color, tanning, and height (Fig. 3). ChIP-seq data are available on the nuclear glucocorticoid receptor (GR) for the human A549 lung epithelial carcinoma cell line which has provided a very important model of the response to glucocorticoid (Reddy et al. 2009). There was no overlap in disease intervals enriched with GR binding (Supplemental Table 6) indicating that there has been no enrichment for binding sites of this ligand-activated nuclear receptor as defined in A549 cells, although ChIP-seq data for GR binding in lymphoblastoid cells will be required to allow a direct comparison with the enrichment seen for VDR binding in GWAS intervals.
Figure 3.
Common traits showing enrichment of VDR binding within intervals identified by GWAS. A total of 47 common diseases and traits were analyzed (see Methods and Supplemental Table 5) and those showing significant enrichment of VDR binding defined by ChIP-seq in two LCLs after calcitriol stimulation with a 1% FDR are shown.
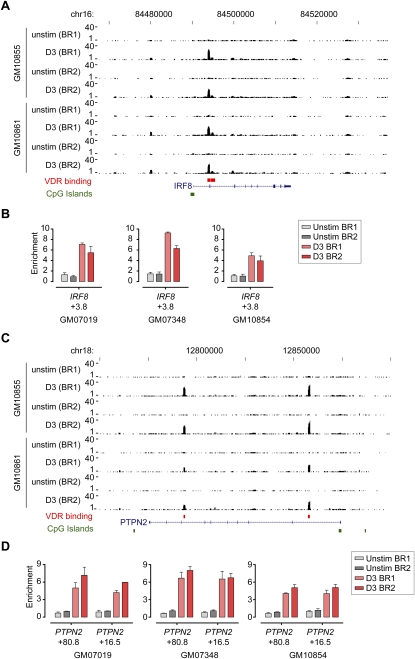
This analysis highlighted a number of gene loci in which roles for vitamin D in gene regulation had not previously been proposed (Supplemental Table 7). We noted, for example, novel intronic VDR binding sites involving IRF8 (Fig. 4), which is associated with MS (De Jager et al. 2009), and in PTPN2 (Fig. 4), a gene locus strongly implicated in CD and T1D in recent GWAS (Barrett et al. 2008; Cooper et al. 2008). Both genes showed increased expression after calcitriol stimulation (∼1.5-fold induction for both; Supplemental Table 2). We validated these novel VDR binding sites by ChIP experiments in additional LCLs (Fig. 4) together with other novel sites we found in gene loci such as PTPN22 and CD226, which have been strongly associated with autoimmune disease susceptibility (Supplemental Fig. 4) (Bottini et al. 2004; Barrett et al. 2008; Baranzini 2009; Hafler et al. 2009). A systematic listing of gene loci implicated in a range of autoimmune diseases in which we identified VDR binding is provided in Supplemental Table 7. This includes genes such as IRF5, CLEC16A, CD40, CDKAL1, CTLA4, HLA-DRB1, HLA-DQA1, PRDM1, PTGER4, STAM, TNFAIP3, and TNFSF4.
Figure 4.
VDR ChIP-seq analysis for IRF8 and PTPN2. VDR ChIP-seq data shown for two biological replicates of two LCLs, GM10855 and GM10861, either resting or after induction with calcitriol for 36 h. (A) Tracks shown for IRF8 (chr16: 84,467,000–84,537,000) with a novel site of VDR occupancy noted at +3.8 kb relative to the transcriptional start site (TSS), as well as weaker sites at −10.2 kb and +4.7 kb. (B) Validation of VDR binding by ChIP for GM07019, GM07348, and GM10854 analyzed by quantitative real-time PCR. Mean fold difference (±SD) in enrichment of each of the PCR amplicons is expressed relative to input DNA. (C) Tracks also shown for PTPN2 (chr18: 12,750,000–12,900,000) with VDR occupancy in intron 1 (+16.5 kb relative to the TSS of PTPN2) and intron 7 (+80.8 kb) with (D) validation by ChIP for GM07019, GM07348, and GM10854.
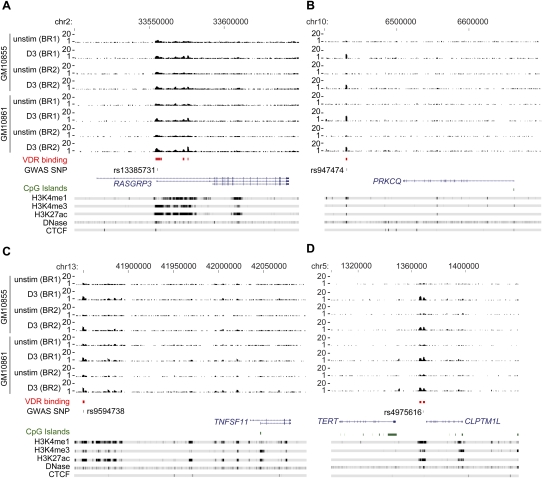
In some cases we found evidence that the most strongly associated SNP marker from GWAS was located within VDR binding intervals. For example, rs13385731 has been associated with SLE (Han et al. 2009) and is located within a VDR interval in the first intron of RASGRP3 (Fig. 5). A SNP associated with hair color, rs12203592 (Han et al. 2008), is located in a VDR interval in the fourth intron of IRF4. In other instances, disease-associated SNPs in intergenic regions within VDR binding intervals were defined, for example, rs947474 which is associated with T1D (Cooper et al. 2008) and is located 70 kb downstream from PRKCQ (Fig. 5); rs9594738 which is associated with bone mineral density and located 185 kb upstream of TNFSF11 (Fig. 5; Styrkarsdottir et al. 2008); and rs4975616, located 5 kb downstream from CLPTM1L and is associated with lung cancer (Fig. 5).
Figure 5.
VDR ChIP-seq analysis for RASGRP3, PRKCQ, TNFSF11, and CLPTM1L. VDR ChIP-seq data shown for two biological replicates of two LCLs, GM10855 and GM10861, either resting or after induction with calcitriol for 36 h. (A) RASGRP3 and flanking sequences (chr2: 33,500,000–33,650,000) with rs13385731 (GWAS SNP marker for SLE) located in an intronic VDR binding site; (B) PRKCQ and flanking sequences (chr10: 6,400,000–6,700,000) with rs947474 (GWAS SNP marker for T1D) located in the VDR binding site 78 kb downstream from PRKCQ; (C) TNFSF11 and flanking sequences (chr13: 41,830,000–42,100,000) with rs9594738 (GWAS SNP marker for bone mineral density) 185 kb upstream of TNFSF11; (D) CLPTM1L and flanking sequences (chr5: 1,300,000–1,440,000) with rs4975616 (GWAS SNP marker for lung cancer). Also shown are ChIP-seq and DNase-seq data for GM12878 generated by the ENCODE Project (The ENCODE Project Consortium 2007).
Gene expression in multiple sclerosis
The whole blood mRNA transcriptome has recently been determined for 99 untreated patients with multiple sclerosis; these include 43 patients with primary progressive MS, 20 patients with secondary progressive MS, 36 patients with relapsing-remitting MS, and 45 age-matched healthy controls (Gandhi et al. 2010). Transcription from genes from T cell, translational regulation, oxidative phosphorylation, immune synapse, and antigen presentation pathways were differentially expressed in all forms of MS (Gandhi et al. 2010). We observed significant enrichment of VDR binding in genes which are differentially expressed compared with controls for all MS forms: primary progressive MS, 1.9-fold enrichment, P < 0.0001; secondary progressive MS, 2.3-fold enrichment, P < 0.0001; and relapsing-remitting MS, 2.4-fold enrichment, P < 0.0001.
Signatures of selection and VDR occupancy
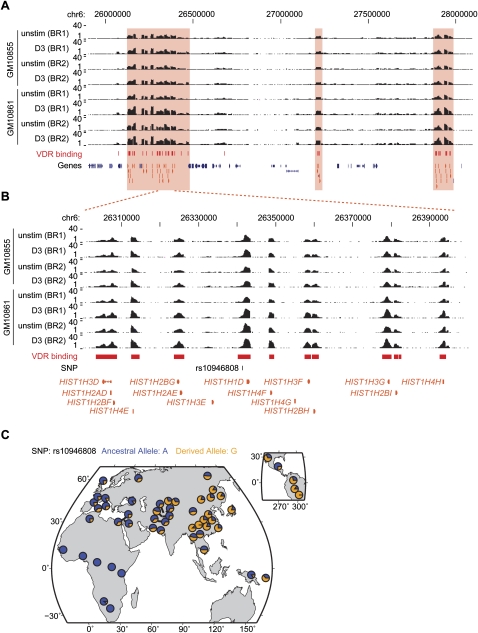
Analysis of data from the International HapMap Project has shown widespread signals of selective sweeps in all three continental groups (Voight et al. 2006). We found significant enrichment of VDR intervals within these regions among individuals of Asian (ASN) (2.9-fold enrichment, P = 0.0002) or European descent (CEU) (1.4-fold enrichment, P = 0.039) but no significant enrichment in the Yoruban (YRI) population (0.90-fold enrichment, P = 0.34). The regions of positive selection with VDR binding are listed in Supplemental Table 8. A region of positive selection in ASN populations encompasses the HIST1 gene cluster (Fig. 6) encoding 55 histone proteins. A SNP associated with height (Lettre et al. 2008), rs10946808, is located in a VDR binding interval within this region but does not itself disrupt a consensus binding motif. We identified an additional 10 VDR binding sites in this region of selection.
Figure 6.
VDR binding, histone H1 gene cluster, selection, and rs10946808. (A) Enrichment of VDR binding intervals in histone HIST1 gene cluster on chromosome 6p21-22 (chr6: 25,900,000–28,100,000). (B) The region chr6: 26,300,001–26,400,000 reported as showing evidnce of selection includes rs10946808 located 3′ of HIST1H1D. (C) Data from the Human Genome Diversity Project show rs10946808 has a higher minor allele frequency in Asians.
Discussion
Our study provides a comprehensive high-resolution map of VDR binding throughout the human genome, identifying thousands of hitherto unknown sites of VDR occupancy in lymphoblastoid cells. We show how following ligand activation, binding is enriched in intronic and intergenic regions with 2776 binding sites identified which highlight the pleiotropic actions of vitamin D by its influence on immune and other functional pathways (Holick 2007). There is significant enrichment in regions associated with active chromatin such as DNase I–hypersensitive sites and specific histone modifications, consistent with a regulatory role and, for example, enhancer function. The relatively high level of basal genome-wide occupancy we found is consistent with summary data recently reported for VDR binding in the mouse preosteoblastic cell line MC3T3-E1 derived from ChIP with microarray hybridization (ChIP-chip) analysis (Meyer et al. 2010). However, a direct comparison with our data is not possible as no listing of VDR binding intervals was provided in this brief report. We find that the DR3 motif is the most significantly enriched within the VDR binding intervals we defined, the presence and number of motifs correlating with the strength of VDR binding observed. Further work is needed to establish cell and tissue specificity in VDR occupancy and the temporal relationship with calcitriol stimulation. The precise association with alterations in gene expression will require more detailed transcriptome profiling; for both transcript and VDR analysis it is important that such work encompasses individuals with a range of different genetic backgrounds in the most physiologically or disease-relevant cellular context.
VDR was found to bind to a number of genes associated with autoimmune disease and cancer, in line with epidemiological data (Holick 2007), and a number of disease-associated SNPs were located within a VDR interval. These associated SNPs do not appear to directly disrupt a VDR consensus binding site motif suggesting that there may be further, as yet unidentified, genetic variants within VDR motifs. Rather than the risk-associated marker SNP, it is likely that linked SNPs in flanking, possibly VDRE, sequences will be responsible for exerting functional effects on transcription involving VDR. Further resequencing of normal and affected individuals, focused on such regions for specific risk haplotypes, would be highly informative. In view of the combinatorial nature of transcription, which provides context specificity in the regulation of gene expression, it is also important to consider that genetic variants are also likely to be modulating DNA binding by auxiliary factors in the transcriptional complex involving VDR. Future work to characterize functional variants will need to critically consider the most relevant cell type and developmental stage for a particular phenotype. Our data provide new evidence supporting a role for vitamin D in susceptibility to autoimmune disease through effects on a substantial number of associated genes, and highlight a number of important candidate regions and genetic variants to investigate further.
We also present evidence of VDR binding enrichment in regions of positive selection. The reasons behind this are unclear, but one suggestion is that evolutionary pressure has maintained vitamin D binding in some regions of the genome as humans migrated out of Africa. The evolutionary hypothesis regarding skin and hair color and vitamin D is also supported by our data (Jablonski and Chaplin 2000).
Genome-wide association studies have revealed a large number of novel loci involving common variants influencing susceptibility to many common diseases. These loci generally have modest effects on disease risk but provide insights into disease pathogenesis. The challenge now for researchers is to define the molecular mechanisms through which these variants operate. We show here how ChIP-seq for a biologically important nuclear receptor, integrated with the wealth of GWAS data now available, provides a powerful approach to further understand the molecular basis of complex disease.
Methods
VDR chromatin immunoprecipitation
Lymphoblastoid cell lines from CEPH individuals (GM10855 and GM10861) from the International HapMap Project were used. ChIP was carried out as described in Labhart et al. (2005). Cells were cultured as described (Ramagopalan et al. 2009), all in biological duplicates, either unstimulated or stimulated for 36 h with 0.1 μM calcitriol (Sigma) and then fixed with 1% formaldehyde for 15 min and quenched with 0.125 M glycine. Chromatin was isolated by adding lysis buffer, followed by disruption with a Dounce homogenizer. Lysates were sonicated (Misonix) to shear the DNA to an average length of 300–500 bp. Genomic DNA (input) was purified from an aliquot of chromatin and quantified on a Nanodrop spectrophotometer. Extrapolation to the original chromatin volume allowed quantitation of the total chromatin yield.
ChIP assays were carried out as follows: An aliquot of chromatin (50 μg) was precleared with protein A agarose beads (Invitrogen). VDR-bound genomic DNA regions were isolated using a rabbit polyclonal antibody against VDR (Santa Cruz Biotechnology, sc-1008). After incubation at 4°C overnight, protein A agarose beads were used to isolate the immune complexes. Complexes were washed, eluted from the beads with SDS buffer, and subjected to RNase and proteinase K treatment. Crosslinks were reversed by incubation overnight at 65°C, and ChIP DNA was purified by phenol-chloroform extraction and ethanol precipitation.
Quantitative PCR
To assay for the enrichment of positive control regions in the ChIP DNA or to confirm VDR binding in sites of interest in additional lymphoblastoid cell lines (GM07019, GM10854, and GM07348 from the HapMap project), quantitative PCRs (qPCRs) were carried out in triplicate with primers specific for these regions using SYBR Green Supermix (Bio-Rad). The resulting signals were normalized for primer efficiency by carrying out QPCR for each primer pair using input DNA (data not shown).
ChIP sequencing (Illumina)
Remaining ChIP DNA (90% of entire sample) was amplified following the Illumina ChIP-seq library generation protocol. In parallel, 20 ng each of input DNA (isolated from nonimmunoprecipitated chromatin) of the pooled GM10855 and GM10861 samples were also amplified for sequencing. In brief, DNA ends were polished and 5′-phosphorylated using T4 DNA polymerase, Klenow polymerase, and T4 polynucleotide kinase. After addition of 3′-A to the ends using Klenow fragment (3′-5′ exo minus), Illumina genomic adapters were ligated and the sample was size-fractionated (∼180–250 bp) on a 2% agarose gel. After a final PCR amplification step (18 cycles, Phusion polymerase), the resulting DNA libraries were quantified and tested by QPCR at the same specific genomic regions as the original ChIP DNA to assess quality of the amplification reactions. DNA libraries were sent to Vanderbilt Microarray Shared Resource for sequencing on a Genome Analyzer II. Sequence reads (35 bases; 10–19 million quality-filtered reads/sample) were aligned to the human genome (NCBI Build 36.3) using bowtie (0.10.1, [Langmead et al. 2009], options “-n 2 -a --best --strata -m 1 -p 4”). The number of unique alignments ranged from 9.0 million to 15.7 million. The number of reads (n) mapped to the same genomic location between biological replicates correlated well (r > 0.75, at least n > 5 in both replicates).
Sequence data
The gene set used in this analysis was from Ensembl release 45 (Hubbard et al. 2009) on the Human NCBI build 36.3 genomic sequence (International Human Genome Sequencing Consortium. 2004). Additional annotation tracks were obtained from the UCSC Genome Browser (Rhead et al. 2010). ENCODE data for cell line GM12878 (The ENCODE Project Consortium 2007) were obtained from the UCSC ENCODE Data Coordination Center (Rosenbloom et al. 2010); ChIP-seq data were produced by the Encode Chromatin Group at the Broad Institute and Massachusetts General Hospital; and DNase I data were produced by the Duke/UNC/UT-Austin/EBI ENCODE group (McDaniell et al. 2010).
Peak finding and data analysis
The collections of aligned reads (eight ChIP-seq and two input controls) were normalized to the same sequencing depth by randomly removing aligned reads. Mapping and peak calling are summarized in Supplemental Table 9. Duplicated reads were removed before normalization. Peak finding was carried out by running MACS (Zhang et al. 2008; options “--tsize=35 --bw=110 --mfold=16 --pvalue=1e-5”) on each ChIP-seq file against the matching input file. For the analysis, peaks with a false discovery rate (FDR) of <1% were selected. Replicates and cell lines were combined by retaining only those peaks that were present in all replicates and cell lines, respectively.
Motif discovery
We used MEME 4.3.0 (Bailey and Elkan 1994) to discover motifs. We selected 10% of the strongest peaks for each experiment (reads under peak). The location of the peak was extracted and extended by 100 bp on either side. Sequences were masked with dustmasker (Morgulis et al. 2006). MEME was instructed to report the top 10 motifs between 5 and 30 bases in length. We accepted all motifs that showed significant similarity (TOMTOM; Gupta et al. 2007) to the reported rxrvdr motif (JASPAR [Sandelin et al. 2004], MA0074.1, P-value <1 × 10⁻⁵). In order to collect all motif occurrences, we used MAST (Bailey and Gribskov 1998) without an E-value cutoff on the full length but masked ChIP-seq peaks.
Gene expression analysis
Lymphoblastoid cell lines from CEPH individuals (GM10855, GM10861, GM07019, GM10854, and GM07348) from the International HapMap Project were used. Cells were cultured as described (Ramagopalan et al. 2009), all in biological triplicates, either unstimulated or stimulated for 36 h with calcitriol (Sigma). RNA was extracted by use of RNeasy Plus Mini Kits (QIAGEN). RNA quality was assessed using the RNA 6000 Nano Assay (Agilent Technologies). cDNA was generated using the GeneChip WT cDNA Synthesis and Amplification kit (Affymetrix), per the manufacturer's instructions. cDNA was fragmented and end labeled using the GeneChip WT Terminal Labeling Kit (Affymetrix). Approximately 5.5 μg of labeled DNA target was hybridized to the Affymetrix GeneChip Human Exon 1.0 ST Array at 45°C for 16 h, per the manufacturer's recommendation. Hybridized arrays were washed and stained on a GeneChip Fluidics Station 450 and were scanned on a GCS3000 Scanner (Affymetrix). Resulting probe-signal intensities were sketch-quantile normalized using a subset of probe sets. Gene-expression levels were summarized using the robust multiarray average (RMA). Correlation between replicates was good (r > 0.97). The log2 expression signals for all cell lines and time points were averaged and used to calculate fold change. We applied the significance analysis of microarray method (SAM) (Tusher et al. 2001) implemented in the siggenes package (Schwender et al. 2006) in the Bioconductor package (Gentleman et al. 2004) using an FDR cutoff of 20%. Gene Ontology analysis was performed as described previously (Ashburner et al. 2000), with an FDR of 5%.
Significance analysis of genomic overlap
In order to assess if there is a significant overlap between two sets of genomic features we followed the procedure described in Gentleman et al. (2004). In brief, the percentage base overlap between a query set of genomic intervals is tested against a reference set of genomic intervals and the overlap is recorded. The expected overlap is then computed by randomizing the locations of the query set of intervals. The procedure accounts for compositional biases by requiring that the randomized location of a segment remains on the same chromosome and preserves the local G+C content. From 10,000 randomizations the procedure computes the expected overlap and an empirical P-value. The reported fold enrichment is the ratio of the observed overlap and the expected overlap. By aggregating the randomizations from multiple reference sets, an empirical FDR is computed. Only results with an FDR of <1% are reported. For analysis of enrichment of VDR binding sites in relation to DNase I hypersensitivity, CTCF binding, and histone modifications, ENCODE data generated for the unstimulated lymphoblastoid cell line GM12878 were used. We tested disease and selection intervals from data available at www.t1dbase.org, the NHGRI GWAS database (http://www.genome.gov/26525384), and data from (Voight et al. 2006; Barrett et al. 2008; De Jager et al. 2009; Gandhi et al. 2010) (interval defined as 150 kb on either side of main disease-associated SNP, or 100 kb on either side of a gene shown to be differentially expressed) for acute myeloid leukemia, BMI, aging, HIV/AIDS, alcohol dependence, Alzheimer's disease, amyotrophic lateral sclerosis, ankylosing spondylitis, asthma, atrial fibrillation, attention deficit hyperactivity disorder, bipolar disorder, blood pressure, bone mineral density, breast cancer, celiac disease, cholesterol, chronic lymphocytic leukemia, colorectal cancer, coronary artery disease, Crohn's disease, fasting glucose, hair color, HDL cholesterol, height, LDL cholesterol, leprosy, lung cancer, melanoma, multiple sclerosis, myocardial infarction, pancreatic cancer, Parkinson's disease, primary biliary cirrhosis, prostate cancer, psoriasis, QT interval, restless legs syndrome, rheumatoid arthritis, schizophrenia, stroke, systemic lupus erythematosus, tanning, triglycerides, type 2 diabetes, and ulcerative colitis. 4393 glucocorticoid receptor binding sites as described in Reddy et al. (2009) were also used to test for enrichment in disease intervals.
Acknowledgments
This work was funded by the Multiple Sclerosis Society of Canada Scientific Research Foundation, the Multiple Sclerosis Society of Great Britain and Northern Ireland, the Medical Research Council, and the Wellcome Trust [074318; 075491/Z/04]. S.V.R. is a Goodger Scholar at the University of Oxford. J.C.K. is a Wellcome Trust Senior Research Fellow in Clinical Science.
Author contributions: S.V.R., J.C.K., and G.C.E. conceived and designed the experiments. S.V.R., A.J.B., N.J.M., M.R.L., A.B., G.D., L.H., S.-M.O. A.E.H., C.T.W., J.M.M., G.G., and J.C.K. performed the experiments. S.V.R., A.H., G.C.E., C.P.P., and J.C.K. analyzed the data and wrote the paper.
Footnotes
[Supplemental material is available online at http://www.genome.org. The sequence data from this study have been submitted to the NCBI Gene Expression Omnibus (http://www.ncbi.nlm.nih.gov/geo) under series accession nos. GSE22484 and GSE22176, respectively.]
Article published online before print. Article and publication date are at http://www.genome.org/cgi/doi/10.1101/gr.107920.110.
References
- Alekseyenko AA, Peng S, Larschan E, Gorchakov AA, Lee OK, Kharchenko P, McGrath SD, Wang CI, Mardis ER, Park PJ, et al. 2008. A sequence motif within chromatin entry sites directs MSL establishment on the Drosophila X chromosome. Cell 134: 599–609 [DOI] [PMC free article] [PubMed] [Google Scholar]
- Ashburner M, Ball CA, Blake JA, Botstein D, Butler H, Cherry JM, Davis AP, Dolinski K, Dwight SS, Eppig JT, et al. 2000. Gene Ontology: Tool for the unification of biology. The Gene Ontology Consortium. Nat Genet 25: 25–29 [DOI] [PMC free article] [PubMed] [Google Scholar]
- Bailey TL, Elkan C 1994. Fitting a mixture model by expectation maximization to discover motifs in biopolymers. Proc Int Conf Intell Syst Mol Biol 2: 28–36 [PubMed] [Google Scholar]
- Bailey TL, Gribskov M 1998. Combining evidence using p-values: Application to sequence homology searches. Bioinformatics 14: 48–54 [DOI] [PubMed] [Google Scholar]
- Baranzini SE 2009. The genetics of autoimmune diseases: A networked perspective. Curr Opin Immunol 21: 596–605 [DOI] [PubMed] [Google Scholar]
- Barrett JC, Hansoul S, Nicolae DL, Cho JH, Duerr RH, Rioux JD, Brant SR, Silverberg MS, Taylor KD, Barmada MM, et al. 2008. Genome-wide association defines more than 30 distinct susceptibility loci for Crohn's disease. Nat Genet 40: 955–962 [DOI] [PMC free article] [PubMed] [Google Scholar]
- Bottini N, Musumeci L, Alonso A, Rahmouni S, Nika K, Rostamkhani M, MacMurray J, Meloni GF, Lucarelli P, Pellecchia M, et al. 2004. A functional variant of lymphoid tyrosine phosphatase is associated with type I diabetes. Nat Genet 36: 337–338 [DOI] [PubMed] [Google Scholar]
- Carlberg C, Dunlop TW 2006. The impact of chromatin organization of vitamin D target genes. Anticancer Res 26: 2637–2645 [PubMed] [Google Scholar]
- Cooper JD, Smyth DJ, Smiles AM, Plagnol V, Walker NM, Allen JE, Downes K, Barrett JC, Healy BC, Mychaleckyj JC, et al. 2008. Meta-analysis of genome-wide association study data identifies additional type 1 diabetes risk loci. Nat Genet 40: 1399–1401 [DOI] [PMC free article] [PubMed] [Google Scholar]
- De Jager PL, Jia X, Wang J, de Bakker PI, Ottoboni L, Aggarwal NT, Piccio L, Raychaudhuri S, Tran D, Aubin C, et al. 2009. Meta-analysis of genome scans and replication identify CD6, IRF8 and TNFRSF1A as new multiple sclerosis susceptibility loci. Nat Genet 41: 776–782 [DOI] [PMC free article] [PubMed] [Google Scholar]
- Ebers GC 2008. Environmental factors and multiple sclerosis. Lancet Neurol 7: 268–277 [DOI] [PubMed] [Google Scholar]
- The ENCODE Project Consortium 2007. Identification and analysis of functional elements in 1% of the human genome by the ENCODE pilot project. Nature 447: 799–816 [DOI] [PMC free article] [PubMed] [Google Scholar]
- Feldman D, Glorieux FH, Pike JW 2005. Vitamin D. Academic Press, San Diego and London [Google Scholar]
- Frith MC, Saunders NF, Kobe B, Bailey TL 2008. Discovering sequence motifs with arbitrary insertions and deletions. PLoS Comput Biol 4: e1000071 doi: 10.1371/journal.pcbi.1000071 [DOI] [PMC free article] [PubMed] [Google Scholar]
- Gandhi KS, McKay FC, Cox M, Riveros C, Armstrong N, Heard RN, Vucic S, Williams DW, Stankovich J, Brown M, et al. 2010. The multiple sclerosis whole blood mRNA transcriptome and genetic associations indicate dysregulation of specific T cell pathways in pathogenesis. Hum Mol Genet 19: 2134–2143 [DOI] [PubMed] [Google Scholar]
- Gentleman RC, Carey VJ, Bates DM, Bolstad B, Dettling M, Dudoit S, Ellis B, Gautier L, Ge Y, Gentry J, et al. 2004. Bioconductor: Open software development for computational biology and bioinformatics. Genome Biol 5: R80 doi: 10.1186/gb-2004-5-10-r80 [DOI] [PMC free article] [PubMed] [Google Scholar]
- Gupta S, Stamatoyannopoulos JA, Bailey TL, Noble WS 2007. Quantifying similarity between motifs. Genome Biol 8: R24 doi: 10.1186/gb-2007-8-2-r24 [DOI] [PMC free article] [PubMed] [Google Scholar]
- Hafler JP, Maier LM, Cooper JD, Plagnol V, Hinks A, Simmonds MJ, Stevens HE, Walker NM, Healy B, Howson JM, et al. 2009. CD226 Gly307Ser association with multiple autoimmune diseases. Genes Immun 10: 5–10 [DOI] [PMC free article] [PubMed] [Google Scholar]
- Han J, Kraft P, Nan H, Guo Q, Chen C, Qureshi A, Hankinson SE, Hu FB, Duffy DL, Zhao ZZ, et al. 2008. A genome-wide association study identifies novel alleles associated with hair color and skin pigmentation. PLoS Genet 4: e1000074 doi: 10.1371/journal.pgen.1000074 [DOI] [PMC free article] [PubMed] [Google Scholar]
- Han JW, Zheng HF, Cui Y, Sun LD, Ye DQ, Hu Z, Xu JH, Cai ZM, Huang W, Zhao GP, et al. 2009. Genome-wide association study in a Chinese Han population identifies nine new susceptibility loci for systemic lupus erythematosus. Nat Genet 41: 1234–1237 [DOI] [PubMed] [Google Scholar]
- Holick MF 2007. Vitamin D deficiency. N Engl J Med 357: 266–281 [DOI] [PubMed] [Google Scholar]
- Hubbard TJ, Aken BL, Ayling S, Ballester B, Beal K, Bragin E, Brent S, Chen Y, Clapham P, Clarke L, et al. 2009. Ensembl 2009. Nucleic Acids Res 37: D690–D697 doi: 10.1093/nar/gkn828 [DOI] [PMC free article] [PubMed] [Google Scholar]
- International Human Genome Sequencing Consortium 2004. Finishing the euchromatic sequence of the human genome. Nature 431: 931–945 [DOI] [PubMed] [Google Scholar]
- Jablonski NG, Chaplin G 2000. The evolution of human skin coloration. J Hum Evol 39: 57–106 [DOI] [PubMed] [Google Scholar]
- Labhart P, Karmakar S, Salicru EM, Egan BS, Alexiadis V, O'Malley BW, Smith CL 2005. Identification of target genes in breast cancer cells directly regulated by the SRC-3/AIB1 coactivator. Proc Natl Acad Sci 102: 1339–1344 [DOI] [PMC free article] [PubMed] [Google Scholar]
- Langmead B, Trapnell C, Pop M, Salzberg SL 2009. Ultrafast and memory-efficient alignment of short DNA sequences to the human genome. Genome Biol 10: R25 doi: 10.1186/gb-2009-10-3-r25 [DOI] [PMC free article] [PubMed] [Google Scholar]
- Lettre G, Jackson AU, Gieger C, Schumacher FR, Berndt SI, Sanna S, Eyheramendy S, Voight BF, Butler JL, Guiducci C, et al. 2008. Identification of ten loci associated with height highlights new biological pathways in human growth. Nat Genet 40: 584–591 [DOI] [PMC free article] [PubMed] [Google Scholar]
- Liu X, Brutlag DL, Liu JS 2001. BioProspector: Discovering conserved DNA motifs in upstream regulatory regions of co-expressed genes. Pac Symp Biocomput 6: 127–138 [PubMed] [Google Scholar]
- McDaniell R, Lee BK, Song L, Liu Z, Boyle AP, Erdos MR, Scott LJ, Morken MA, Kucera KS, Battenhouse A, et al. 2010. Heritable individual-specific and allele-specific chromatin signatures in humans. Science 328: 235–239 [DOI] [PMC free article] [PubMed] [Google Scholar]
- Meyer MB, Goetsch PD, Pike JW 2010. Genome-wide analysis of the VDR/RXR cistrome in osteoblast cells provides new mechanistic insight into the actions of the vitamin D hormone. J Steroid Biochem Mol Biol 121: 136–141 [DOI] [PMC free article] [PubMed] [Google Scholar]
- Morgulis A, Gertz EM, Schaffer AA, Agarwala R 2006. A fast and symmetric DUST implementation to mask low-complexity DNA sequences. J Comput Biol 13: 1028–1040 [DOI] [PubMed] [Google Scholar]
- Park PJ 2009. ChIP-seq: Advantages and challenges of a maturing technology. Nat Rev Genet 10: 669–680 [DOI] [PMC free article] [PubMed] [Google Scholar]
- Ramagopalan SV, Maugeri NJ, Handunnetthi L, Lincoln MR, Orton SM, Dyment DA, Deluca GC, Herrera BM, Chao MJ, Sadovnick AD, et al. 2009. Expression of the multiple sclerosis-associated MHC class II Allele HLA-DRB1*1501 is regulated by vitamin D. PLoS Genet 5: e1000369 doi: 10.1371/journal.pgen.1000369 [DOI] [PMC free article] [PubMed] [Google Scholar]
- Reddy TE, Pauli F, Sprouse RO, Neff NF, Newberry KM, Garabedian MJ, Myers RM 2009. Genomic determination of the glucocorticoid response reveals unexpected mechanisms of gene regulation. Genome Res 19: 2163–2171 [DOI] [PMC free article] [PubMed] [Google Scholar]
- Rhead B, Karolchik D, Kuhn RM, Hinrichs AS, Zweig AS, Fujita PA, Diekhans M, Smith KE, Rosenbloom KR, Raney BJ, et al. 2010. The UCSC Genome Browser database: Update 2010. Nucleic Acids Res 38: D613–D619 doi: 10.1093/nar/gkp939 [DOI] [PMC free article] [PubMed] [Google Scholar]
- Rosenbloom KR, Dreszer TR, Pheasant M, Barber GP, Meyer LR, Pohl A, Raney BJ, Wang T, Hinrichs AS, Zweig AS, et al. 2010. ENCODE whole-genome data in the UCSC Genome Browser. Nucleic Acids Res 38: D620–D625 doi: 10.1093/nar/gkp961 [DOI] [PMC free article] [PubMed] [Google Scholar]
- Sandelin A, Alkema W, Engstrom P, Wasserman WW, Lenhard B 2004. JASPAR: An open-access database for eukaryotic transcription factor binding profiles. Nucleic Acids Res 32: D91–D94 doi: 10.1093/nar/gkh012 [DOI] [PMC free article] [PubMed] [Google Scholar]
- Schneider TD, Stephens RM 1990. Sequence logos: A new way to display consensus sequences. Nucleic Acids Res 18: 6097–6100 [DOI] [PMC free article] [PubMed] [Google Scholar]
- Schwender H, Krause A, Ickstadt K 2006. Identifying interesting genes with siggenes. RNews 6: 45–50 [Google Scholar]
- Seuter S, Vaisanen S, Radmark O, Carlberg C, Steinhilber D 2007. Functional characterization of vitamin D responding regions in the human 5-lipoxygenase gene. Biochim Biophys Acta 1771: 864–872 [DOI] [PubMed] [Google Scholar]
- Sinkkonen L, Malinen M, Saavalainen K, Vaisanen S, Carlberg C 2005. Regulation of the human cyclin C gene via multiple vitamin D3-responsive regions in its promoter. Nucleic Acids Res 33: 2440–2451 [DOI] [PMC free article] [PubMed] [Google Scholar]
- Styrkarsdottir U, Halldorsson BV, Gretarsdottir S, Gudbjartsson DF, Walters GB, Ingvarsson T, Jonsdottir T, Saemundsdottir J, Center JR, Nguyen TV, et al. 2008. Multiple genetic loci for bone mineral density and fractures. N Engl J Med 358: 2355–2365 [DOI] [PubMed] [Google Scholar]
- Tusher VG, Tibshirani R, Chu G 2001. Significance analysis of microarrays applied to the ionizing radiation response. Proc Natl Acad Sci 98: 5116–5121 [DOI] [PMC free article] [PubMed] [Google Scholar]
- Voight BF, Kudaravalli S, Wen X, Pritchard JK 2006. A map of recent positive selection in the human genome. PLoS Biol 4: e72 doi: 10.1371/journal.pbio.0040072 [DOI] [PMC free article] [PubMed] [Google Scholar]
- Wang TT, Dabbas B, Laperriere D, Bitton AJ, Soualhine H, Tavera-Mendoza LE, Dionne S, Servant MJ, Bitton A, Seidman EG, et al. 2010. Direct and indirect induction by 1,25-dihydroxyvitamin D3 of the NOD2/CARD15-defensin beta2 innate immune pathway defective in Crohn disease. J Biol Chem 285: 2227–2231 [DOI] [PMC free article] [PubMed] [Google Scholar]
- Zella LA, Meyer MB, Nerenz RD, Lee SM, Martowicz ML, Pike JW 2010. Multifunctional enhancers regulate mouse and human vitamin D receptor gene transcription. Mol Endocrinol 24: 128–147 [DOI] [PMC free article] [PubMed] [Google Scholar]
- Zhang Y, Liu T, Meyer CA, Eeckhoute J, Johnson DS, Bernstein BE, Nussbaum C, Myers RM, Brown M, Li W, et al. 2008. Model-based analysis of ChIP-Seq (MACS). Genome Biol 9: R137 doi: 10.1186/gb-2008-9-9-r137 [DOI] [PMC free article] [PubMed] [Google Scholar]


