

Abstract
Insulin-like growth factor (IGF) system plays important roles in carcinogenesis and maintenance of the malignant phenotype. Signaling through the IGF-I receptor (IGF-IR) has been shown to stimulate the growth and motility of a wide range of cancer cells. γ-Synuclein (SNCG) is primarily expressed in peripheral neurons but also overexpressed in various cancer cells. Overexpression of SNCG correlates with tumor progression. In the present study we demonstrated a reciprocal regulation of IGF-I signaling and SNCG expression. IGF-I induced SNCG expression in various cancer cells. IGF-IR knockdown or IGF-IR inhibitor repressed SNCG expression. Both phosphatidylinositol 3-kinase and mitogen-activated protein kinase were involved in IGF-I induction of SNCG expression. Interestingly, SNCG knockdown led to proteasomal degradation of IGF-IR, thereby decreasing the steady-state levels of IGF-IR. Silencing of SNCG resulted in a decrease in ligand-induced phosphorylation of IGF-IR and its downstream signaling components, including insulin receptor substrate (IRS), Akt, and ERK1/2. Strikingly, SNCG physically interacted with IGF-IR and IRS-2. Silencing of IRS-2 impaired the interaction between SNCG and IGF-IR. Finally, SNCG knockdown suppressed IGF-I-induced cell proliferation and migration. These data reveal that SNCG and IGF-IR are mutually regulated by each other. SNCG blockade may suppress IGF-I-induced cell proliferation and migration. Conversely, IGF-IR inhibitors may be of utility in suppressing the aberrant expression of SNCG in cancer cells and thereby block its pro-tumor effects.
Keywords: Cancer Tumor Promoter, Growth Factors, Insulin-like Growth Factor (IGF), Receptor Regulation, Synuclein
Introduction
Insulin-like growth factor I (IGF-I) is one of endocrine or paracrine/autocrine growth factors that plays an important role in cellular proliferation and migration. Liver is the principal source of circulating IGF-I (1). IGF-I is also produced by other tissues in a paracrine/autocrine fashion (2). Accumulating evidence demonstrated that many tissues, including muscle, cartilage, bone, liver, kidney, brain, skin, and lungs, are targets of IGF-I (3, 4). IGF-I signaling in normal tissues is tightly regulated. The bioavailability of IGF-I is modulated by its binding proteins termed IGFBP. IGFBP-3 accounts for 80% of all IGF binding. IGF-I binds to IGFBP-3 in a 1:1 molar ratio (5, 6). The biological effects of IGF-I are mediated by binding to specific IGF receptors present on target tissues. Like epidermal growth factor receptor, IGF-I receptor (IGF-IR)3 is a ligand-dependent receptor-tyrosine kinase (7). Upon ligand binding, IGF-IR may be activated, thereby stimulating intracellular signal transduction cascades including insulin receptor substrate (IRS), phosphatidylinositol 3-kinase (PI3K), and mitogen-activated protein kinase (MAPK) pathways. Activation of PI3K and MAPK pathways play key roles in IGF-I induced cell growth, survival, and multiplication (8).
The presence of growth hormone and IGF-I is necessary for fetal growth, linear growth of the skeleton and other organs, maintenance of cognitive function, and prevention of cartilage degeneration (9). However, the IGF signaling pathway appears to play a crucial role in cancer that may limit lifespan. Epidemiological studies have shown that increased levels of IGF lead to an increased risk of cancer, including colon cancer, premenopausal breast cancer, lung cancer, and prostate cancer (10–13). High circulating levels of IGF-I have been reported in patients with breast cancer. Also, there is increased expression of IGF-I in many cancers including breast cancer and multiple myeloma (14). Using a liver-specific IGF-I-deficient mouse model in which the circulating levels of IGF-I are reduced, but tissue IGF-I levels are intact, LeRoith and co-workers (15) demonstrated that the growth and metastases of colon cancer are significantly reduced in IGF-I-deficient mice, suggesting that circulating IGF-I may be important in tumor progression. Using a strain of dwarf rats that were naturally deficient in both growth hormone and IGF-I as a model, Sonntag et al. (16) found that an increase in growth hormone and IGF-I during adolescence in these rats led to a 25% increase in tumor incidence. In addition, IGF-IR expression and kinase activity are elevated in various tumors (17–19). Regulation of IGF-IR expression and activity may dictate cell fate, i.e. cell cycle arrest, proliferation, or apoptosis. IGF-IR may promote tumor progression by stimulating tumor growth, angiogenesis, and metastasis (20). Blockade of IGF-IR inhibits tumorigenesis and metastasis (21, 22).
The synucleins are a group of proteins that have been implicated in human diseases such as neurodegenerative diseases, ocular diseases, and cancer (23). The synuclein family consists of α-, β-, and γ-synucleins. α-Synuclein is closely linked to Parkinson disease, Alzheimer disease, dementia with Lewy bodies, multiple system atrophy, and neurodegeneration with brain iron accumulation type 1 (24). β-Synuclein and γ-synuclein (SNCG), however, possess antagonistic properties to α-synuclein. SNCG is expressed in peripheral neurons (25). Thus far, the physiological function of SNCG remains largely unknown. Aberrant expression of SNCG is found in the majority of late-stage of breast and ovarian carcinoma as well as in liver cancer, gastric cancer, and pancreatic cancer (26–30). Overexpression of SNCG in breast cancer, colon cancer, and pancreatic carcinoma may serve as a prognostic marker (29, 31, 32). As a multifunctional protein, SNCG reportedly stimulates cancer metastasis (29, 33), impairs cell cycle checkpoint (34), promotes cancer cell proliferation and survival (35–37), and mediates chemotherapeutic drugs resistance (38). These data suggest that SNCG may be a proto-oncogene that promotes tumor progression and, hence, a potential molecular target for cancer therapy.
Here, we report that SNCG is involved in IGF-I signaling. IGF-I induces SNCG expression in different types of cancer cells. SNCG physically interacts with IGF-IR and IRS-2. IRS-2 mediates the interaction between SNCG and IGF-IR. SNCG knockdown results in proteasomal degradation of IGF-IR and a decrease in IGF-I-induced phosphorylation of IGF-IR and its downstream signaling components including IRS-1, Akt, and ERK1/2. SNCG blockade suppresses IGF-I-induced cellular proliferation and migration.
EXPERIMENTAL PROCEDURES
Reagents and Antibodies
IGF-I was purchased from PeproTech Inc. (Rocky Hill, NJ) and prepared by reconstituting in deionized water and by diluting to the appropriate concentration in Dulbecco's minimal essential medium (DMEM) and stored at −20 °C. Mitomycin C, 5-aza-2-deoxycytidine, and tyrphostin AG1024 were purchased from Sigma. The PI3K inhibitor LY294002, MAPK/ERK kinase (MEK) inhibitor U0126, anti-GRP78, anti-IGF-IRβ, anti-phosphorylated IGF-IRβ (Tyr-1131), anti-Akt and phosphorylated Akt (Ser-473), anti-ERK1/2, and phosphorylated ERK1/2 antibodies were purchased from Cell Signaling Technology (Beverly, MA). Another IGF-IR antibody for immunoprecipitation was from Abcam Ltd. (Shatin, N.T., Hong Kong). Anti-IRS-1, anti-IRS-2, and anti-phosphorylated IRS-1 (Tyr-896) antibodies were from Epitomics (Burlingame, CA). Anti-SNCG antibody and anti-actin antibody were from Santa Cruz Biotechnology (Santa Cruz, CA).
Cell Culture
Breast cancer cell line T47D, hepatoma cell line HepG2, colon cancer cell line SW480, and lung cancer cell line A549 were obtained from Cell Lines Bank, Chinese Academy of Science (Shanghai, China). The cells were maintained in DMEM containing 10% fetal bovine serum and 50 units/ml penicillin and 50 μg/ml streptomycin sulfate and incubated at 37 °C in a humidified atmosphere of 5% CO2.
RNA Interference
All siRNAs were custom-synthesized products of Ribobio Co., Ltd. (Guangzhou, China). The target sequences used for knockdown of SNCG, IGF-IR, IRS-1, and IRS-2 are shown in supplemental Table 1. The double-stranded siRNA duplex was dissolved in diethyl pyrocarbonate-treated water. Subconfluent proliferating cells were incubated with 50 nm siRNA in 2 ml of medium containing Lipofectamine.
Immunoprecipitation
Cells were lysed in the radioimmune precipitation assay buffer containing protease inhibitors. Cell lysates were incubated on ice for 30 min and then centrifuged for 20 min at 12,000 rpm to remove debris. The clarified cell lysates (1 mg of total proteins) were used for immunoprecipitation with primary antibodies or normal immunoglobulin G at 4 °C overnight. Then the supernatants were incubated with 40 μl of protein G-agarose beads for 3 h at 4 °C. After washing in lysis buffer three times, immunoprecipitated proteins were immunoblotted.
Western Blotting
Cells were lysed with cold radioimmune precipitation assay lysis buffer containing protease inhibitors. Aliquots of proteins were boiled in 2× loading buffer for 10 min, then loaded into 10% Tris-HCl polyacrylamide gels and transferred to PVDF membranes (Millipore Corp., Billerica, MA). Membranes were incubated with primary antibodies and appropriate HRP-secondary antibodies. Detection was performed with chemiluminescent agents. Images were gathered by the Alpha Innotech FluorChem imaging system. The protein levels were analyzed by densitometric analysis.
Quantitative Real-time Reverse Transcription-PCR
Total RNA was extracted using TRIzol reagent (Invitrogen). First-strand cDNAs were synthesized using the Moloney murine leukemia virus reverse transcriptase and oligo(dT) primers. SNCG and IGF-IR were amplified by real-time PCR using the SYBR Green PCR amplification mix (total volume 25 μl) and 320 nmol/liter primers. β-Actin was also amplified as a reference gene. The primer sequences for human SNCG were 5′-ATGCGGCTGCCCACGCTCCT-3′ (forward) and 5′-GTCTTGGCTCCCACATACAT-3′ (reverse). The primer sequences for human IGF-IR were 5′-GAATCGCATCATCATAACCT-3′ (forward) and 5′-ATCCTGCCCATCATACTCT-3′ (reverse). Relative quantification with the comparative threshold cycle (Ct) was done using the Ct method. The amount of SNCG or IGF-IR gene normalized to the endogenous reference gene (β-actin) is given by 2−ΔCt, where ΔCt is Ct (SNCG or IGF-IR) − Ct (β-actin).
Methylation-specific PCR
Methylation-specific PCR analysis of SNCG promoter methylation was done as described previously (39). Briefly, two μg of genomic DNA was treated with sodium bisulfite and purified. The purified DNA was dissolved in 20 μl of water, and 2 μl was used for methylation-specific PCR. The primers specific for unmethylated SNCG were 5′-GGTTTTTGTATTAATATTTTATTGGTG-3′ (forward) and 5′-ACAAAACTAAATCTCCCTACAAACTACAA-3′ (reverse). The primers specific for methylated SNCG were 5′-TCGTATTAATATTTTATCGGCGT-3′ (forward) and 5′-ACGAAACTAAATCTCCCTACGAACTACGT-3′ (reverse). The PCR conditions for both sets of primers were as follows: first cycle at 94 °C for 2 min, then 30 cycles of 94 °C for 30s, 52 °C for 30s, and 72 °C for 30s and a final elongation at 72 °C for 7 min.
Cell Proliferation Assay
Replicate cultures of 8000 cells per well were plated in 24-well plate. The SNCG siRNA (siSNCG) or control siRNA (siCtrl) was transfected into the cells followed by treating with or without 5 ng/ml IGF-I. The medium contained 5% charcoal-stripped bovine serum and were changed every 2 days, and IGF-I was supplied. Five days after the transfection, the cells were completely digested with 0.1% of trypsin. Single cell suspension was obtained by pipetting. Cell number was counted by using a hemocytometer.
Wound-healing Assay
Cells were seeded in 6-well plates at 50,000 cells/well. The cells were cultured in DMEM medium containing 5% charcoal-stripped bovine serum. Twenty-four hours after plating, the cells were treated with 2 μg/ml mitomycin C to inhibit cell proliferation. The siSNCG or siCtrl was transfected into the cells. Twenty-four hours after transfection, a 1-mm scratch was placed through the middle of the confluent cultures with a pipette tip and washed twice with PBS to remove debris followed by treating with or without 5 ng/ml IGF-I. The area of scratch was recorded by taking images under a phase-contrast microscope everyday. To ensure the consistency of observation, different observing points along the gap were labeled, and the same fields were observed every day. The images of the same fields of view were taken, and the gap width was measured by NIS-Elements F3.0 imaging system (Bio-Rad).
Statistical Analysis
One-way analysis of variance with least significant difference post hoc test (SPSS 13.0 for Windows) was used to test for the differences in cell growth. Two-way analysis of variance was used to test for the differences in cell migration over a 4-day time course. All statistical tests were two-tailed, and difference was considered statistically significant when p < 0.05.
RESULTS
IGF-I Up-regulates SNCG Expression in Cancer Cells
To determine whether SNCG is an IGF-I-responsive protein, the IGF-IR-positive T47D breast cancer cells were treated with different doses of IGF-I for 72 h followed by Western blot analysis of SNCG levels. Treatment with IGF-I stimulated SNCG expression in a dose-dependent manner (Fig. 1A). Moreover, T47D cells were treated with IGF-I for different periods. A time-dependent up-regulation of SNCG by IGF-I was observed (Fig. 1A). IGF-I also induced SNCG expression in IGF-IR-positive HepG2 hepatoma cells (Fig. 1B). Similar effects were observed in A549 lung cancer cells and SW480 colon cancer cells (Fig. 1C). In addition, we investigated whether IGF-I induced SNCG expression at the transcription level. Quantitative RT-PCR analysis demonstrated that IGF-I significantly induced SNCG transcription (Fig. 1D).
FIGURE 1.

IGF-I induces SNCG expression in cancer cells. A, top panel, T47D breast cancer cells were treated with IGF-I for 72 h at the indicated doses followed by Western blot analysis of SNCG expression. Bottom panel, T47D cells were treated with 5 ng/ml IGF-I for the indicated periods followed by Western blot analysis of SNCG expression. Twenty-microgram aliquots of total proteins were loaded. The relative content of SNCG after normalization to actin is shown. B, top panel, HepG2 hepatoma cells were treated with IGF-I for 72 h at the indicated doses followed by Western blot analysis of SNCG expression. Bottom panel, HepG2 cells were treated with 5 ng/ml IGF-I for the indicated periods followed by Western blot analysis of SNCG expression. Twenty-microgram aliquots of total proteins were loaded. The relative content of SNCG after normalization to actin is shown. C, SW480 colon cancer cells and A549 lung cancer cells were treated with 5 ng/ml IGF-I for 48 h followed by Western blot analysis of SNCG expression. Twenty-microgram aliquots of total proteins were loaded. The relative content of SNCG after normalization to actin is shown. D, T47D cells were treated with 5 ng/ml IGF-I for 24 h followed by real-time RT-PCR analysis of SNCG transcription. A representative of at least two independent experiments is shown.
IGF-IR Inhibitor or IGF-IR Knockdown Suppresses SNCG Expression
The biological effects of IGF-I are mediated by IGF-IR. IGF-IR is frequently overexpressed or constitutively activated in human tumors. To determine whether IGF-IR blockade can inhibit SNCG expression in IGF-IR-positive cancer cells, we treated HepG2 cells with AG1024, an IGF-IR inhibitor, and then treated the cells with or without IGF-I followed by Western blot analysis of SNCG expression. Treatment with AG1024 down-regulated IGF-IR levels and inhibited IGF-IR phosphorylation in the cells that were treated with or without IGF-I (Fig. 2A). Treatment with IGF-I strongly stimulated IGF-IR phosphorylation, although it also slightly down-regulated IGF-IR levels. AG1024 inhibited SNCG expression in HepG2 cells treated with or without exogenous IGF-I (Fig. 2B). In addition, we determined the effects of IGF-IR knockdown on SNCG expression. Two siRNA duplex to IGF-IRβ (siIGF-IR-1 and siIGF-IR-2) were synthesized. Both siIGF-IR-1 and siIGF-IR-2 down-regulated IGF-IR expression. Whereas IGF-I induced SNCG expression, IGF-IR knockdown blocked the induction of SNCG expression by IGF-I (Fig. 2C). AG1024 also inhibited SNCG expression in SW480 and A549 cells in which constitutively phosphorylated IGF-IR was detected (Fig. 2D). These data suggest that IGF-IR blockade can inhibit SNCG expression in IGF-IR-positive cancer cells.
FIGURE 2.

IGF-IR blockade represses SNCG expression. A, HepG2 cells were pretreated with or without 10 μm AG1024, an IGF-IR inhibitor, followed by treatment with or without 5 ng/ml IGF-I for 30 min. Total proteins were harvested and subjected to Western blot analysis of IGF-IRβ phosphorylation (Tyr-1131). Twenty microgram aliquots of total proteins were loaded. The relative content of phosphorylated IGF-IR (p-IGF-IR) and total IGF-IR after normalization to actin are shown. B, HepG2 cells were pretreated with or without 10 μm AG1024 then treated with or without 5 ng/ml IGF-I for 48 h. Total proteins were harvested and subjected to Western blot analysis of SNCG and IGF-IRβ expression. Twenty microgram aliquots of total proteins were loaded. The relative content of SNCG and IGF-IR after normalization to actin is shown. C, HepG2 cells were transfected with siCtrl or siRNA to IGF-IR (siIGF-IR) followed by treatment with or without 5 ng/ml IGF-I for 48 h. Total proteins were harvested and subjected to Western blot analysis of SNCG and IGF-IRβ expression. Twenty-microgram aliquots of total proteins were loaded. The relative content of SNCG and IGF-IR after normalization to actin is shown. D, SW480 colon cancer cells and A549 lung cancer cells were plated in cell culture dishes and treated with or without IGF-IR inhibitor AG1024 for 2 days. The cell lysates were harvested and subjected to Western blot analysis of SNCG expression. β-Actin was also detected as loading control. The relative content of SNCG and p-IGF-IR after normalization to actin is shown.
PI3K and MAPK Are Required for IGF-I Induction of SNCG Expression
IGF-I can activate multiple cell signaling pathways that stimulate cellular proliferation and migration. To investigate whether IGF-I-induced canonical signaling pathways such as PI3K and MAPK pathways are involved in IGF-I up-regulation of SNCG, HepG2 cells were treated with PI3K inhibitor LY294002 or MEK inhibitor U0126 followed by Western blot analysis of SNCG expression. Treatment of the cells with PI3K inhibitor abrogated the induction of SNCG expression by IGF-I (Fig. 3A). Moreover, U0126 partially inhibited IGF-I-induced SNCG expression. These data suggest that both PI3K and MAPK are involved in the induction of SNCG expression by IGF-I.
FIGURE 3.
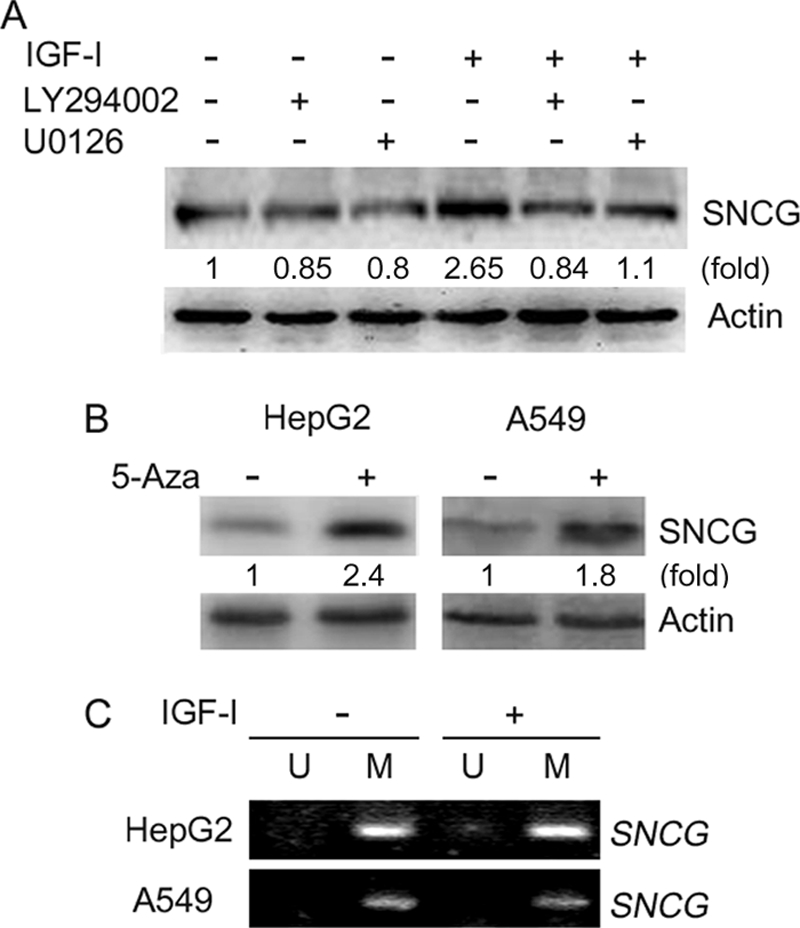
IGF-I induces SNCG expression through a mechanism-dependent on PI3K and MAPK but independent of promoter demethylation. A, HepG2 cells were pretreated with or without 10 μm PI3K inhibitor LY294002 and 10 μm MEK inhibitor U0126 then treated with or without 5 ng/ml IGF-I for 48 h. Total proteins were harvested and subjected to Western blot analysis of SNCG expression. The relative content of SNCG after normalization to actin is shown. B, HepG2 hepatoma cells and A549 lung cancer cells were plated in cell culture dishes and treated with or without 5-aza-2-deoxycytidine (5-Aza) for 5 days. The medium was changed, and fresh 5-aza-2-deoxycytidine was supplied everyday. The cell lysates were harvested and subjected to Western blot analysis of SNCG expression. β-Actin was also detected as loading control. The relative content of SNCG after normalization to actin is shown. C, HepG2 and A549 cells were treated with or without 5 ng/ml IGF-I for 48 h. Genomic DNA was isolated and treated with sodium bisulfite. The sodium bisulfite-treated DNA was then subjected to methylation-specific PCR using primers for unmethylated SNCG (U) or methylated SNCG promoter (M).
Previous studies have demonstrated that SNCG promoter hypermethylation contributes to the repression of SNCG expression (39). SNCG expression could be detected in both HepG2 and A549 cells (Fig. 1, B and C). Treatment with 5-aza-2-deoxycytidine, a DNA demethylating agent, could up-regulate SNCG expression in HepG2 and A549 cells (Fig. 3B), suggesting that SNCG promoter might be methylated in these cells. To determine whether IGF-I had any effects on SNCG promoter methylation, we treated HepG2 and A549 cells with IGF-I followed by Methylation-specific PCR analysis of SNCG promoter methylation. Indeed, SNCG promoter was methylated in HepG2 and A549 cells (Fig. 3C). As shown in Fig. 1, treatment of HepG2 and A549 cells with IGF-I could induce SNCG expression. However, IGF-I did not induce SNCG promoter demethylation (Fig. 3C). These data demonstrated that IGF-I had no effect on SNCG promoter methylation, suggesting that IGF-1 induced SNCG expression through a mechanism independent of change in the status of SNCG promoter methylation.
SNCG Knockdown Leads to a Decrease in IGF-I-induced Phosphorylation of IGF-IR, IRS-1, Akt, and ERK1/2
The above-mentioned data demonstrated that both PI3K and MAPK mediated the up-regulation of SNCG by IGF-I. Biological systems contain many types of feedback circuits, both positive and negative. To determine whether SNCG reciprocally regulates IGF-I signaling, T47D cells were transfected with siSNCG or siCtrl and treated with or without IGF-I for 30 min. Two siRNA duplex to SNCG, namely siSNCG-1 and siSNCG-2, were delivered into T47D cells. Western blot analysis demonstrated that both siSNCG-1 and siSNCG-2 abrogated IGF-I-induced phosphorylation of IGF-IR and its downstream targets, Akt and ERK1/2. In the meantime, SNCG knockdown led to a decrease in the steady-state levels of total IGF-IR but not total Akt and ERK1/2 (Fig. 4). Similar results were observed in HepG2 cells (Fig. 4). Moreover, we detected the effects of SNCG knockdown on IGF-I-induced IRS-1 phosphorylation, an immediate event downstream of IGF-IR activation. SNCG knockdown resulted in a decrease in IGF-I-induced IRS-1 phosphorylation (Fig. 5A). These data further demonstrated that SNCG could potentiate IGF-I signaling.
FIGURE 4.

SNCG knockdown suppresses IGF-I-induced phosphorylation of IGF-IR, Akt, and ERK. A, T47D and HepG2 cells were transfected with siCtrl or siRNA to SNCG (siSNCG-1). Forty-eight hours later the cells were treated with 5 ng/ml IGF-I for 30 min. Total proteins were harvested and subjected to Western blot analysis of phosphorylated IGF-IRβ (Tyr-1131, p-IGF-IR), ERK1/2 (p-ERK1/2), and Akt (Ser-473, p-Akt). The levels of total IGF-IRβ, ERK1/2, Akt, and SNCG were also detected. Forty-microgram aliquots of total proteins were loaded. The relative content of p-ERK1/2, ERK1/2, p-Akt, Akt, p-IGF-IR, IGF-IR, and SNCG after normalization to actin is shown. B, T47D and HepG2 cells were transfected with siCtrl or siSNCG-2. Forty-eight hours later the cells were treated with 5 ng/ml IGF-I for 30 min. Total proteins were harvested and subjected to Western blot analysis of IGF-IRβ (Tyr-1131), ERK1/2, and Akt (Ser-473) phosphorylation. The levels of total IGF-IRβ, ERK1/2, Akt, and SNCG were also detected. The relative content of p-ERK1/2, ERK1/2, p-Akt, Akt, p-IGF-IR, IGF-IR, and SNCG after normalization to actin is shown.
FIGURE 5.

SNCG knockdown inhibits IGF-I-induced IRS-1 phosphorylation and GRP78 expression. A, HepG2 cells were transfected with siCtrl, siSNCG-1, or siSNCG-2. Forty-eight hours later the cells were treated with or without 5 ng/ml IGF-I for 30 min. Total proteins were harvested and subjected to Western blot analysis of phosphorylated IRS-1(Tyr-896). The levels of total IRS-1 were also detected. The relative content of phosphorylated IRS-1 (p-IRS-1), IRS-1, and SNCG after normalization to actin is shown. B, HepG2 cells were transfected with siCtrl, siSNCG-1, or siSNCG-2. Twenty-four hours later the cells were treated with or without 5 ng/ml IGF-I for 48 h. Total proteins were harvested and subjected to Western blot analysis of SNCG and GRP78 expression. Twenty-microgram aliquots of total proteins were loaded. The relative content of GRP78 and SNCG after normalization to actin is shown. A representative of two independent experiments is shown.
In addition, we detected the effect of SNCG knockdown on the expression of GRP78, an IGF-I-responsive protein. Whereas IGF-I up-regulated GRP78 expression in siCtrl-transfected cells, SNCG knockdown by siSNCG-1 or siSNCG-2 inhibited the induction of GRP78 expression by IGF-I (Fig. 5B).
SNCG Prevents Proteasomal Degradation of IGF-IR
To confirm the effects of SNCG knockdown on IGF-IR expression, we transfected HepG2 cells with three SNCG siRNA that targeted different sites within SNCG mRNA, respectively. All of these siRNA duplexes down-regulated SNCG and IGF-IR expression (Fig. 6A). To determine whether SNCG regulates IGF-IR transcription, siSNCG or siCtrl was transfected into HepG2 cells followed by quantitative RT-PCR analysis of IGF-IR transcription. SNCG knockdown had no effect on IGF-IR transcription (Fig. 6B). To determine whether SNCG knockdown could promote IGF-IR degradation, HepG2 cells were transfected with siCtrl or two siRNA duplex to SNCG and treated with or without MG132, a proteasome inhibitor. Whereas SNCG knockdown led to a decrease in the levels of IGF-IR, treatment with MG132 blocked the down-regulation of IGF-IR by both siSNCG-1 and siSNCG-2 (Fig. 6C). These data suggested that SNCG could stabilize IGF-IR.
FIGURE 6.

SNCG prevents proteasomal degradation of IGF-IR. A, HepG2 cells were transfected with siCtrl or three siRNA duplex to SNCG that target different sites within SNCG mRNA (siSNCG, siSNCG-2, siSNCG-3). Forty-eight hours later the total proteins were harvested and subjected to Western blot analysis of IGF-IRβ and SNCG expression. Forty-microgram aliquots of total proteins were loaded. The relative content of IGF-IR and SNCG after normalization to actin is shown. B, HepG2 cells were transfected with siCtrl, siSNCG, or siSNCG-2. Twenty-four hours later the total RNA were isolated and subjected to quantitative real-time RT-PCR analysis of SNCG and IGF-IR transcription. β-Actin served as a reference gene. Four replicates were tested in each group. *, p < 0.001, compared with siCtrl. There was no significant difference in the levels of IGF-IR transcripts. C, HepG2 cells were transfected with siCtrl, siSNCG-1, or siSNCG-2 and treated with or without 5 μm MG132. Forty-eight hours later the total proteins were harvested and subjected to Western blot analysis of IGF-IRβ and SNCG expression. Forty-microgram aliquots of total proteins were loaded. The relative content of IGF-IR and SNCG after normalization to actin is shown. A representative of three independent experiments is shown.
IRS-2 Mediates the Physical Interaction between SNCG and IGF-IR
The abovementioned data demonstrated a functional interaction between SNCG and IGF-IR. To determine whether SNCG physically interacts with IGF-IR, the lysates of SNCG-positive HepG2 cells and SNCG-negative MCF-7 cells were immunoprecipitated with SNCG antibody or IGF-IR antibody followed by Western blotting of SNCG and IGF-IR in the immunoprecipitates. The results demonstrated that SNCG antibody co-immunoprecipitated IGF-IR in HepG2 cells but not in MCF-7 cells. Also, IGF-IR antibody co-immunoprecipitated SNCG in HepG2 cells but not in MCF-7 cells. These data indicated that SNCG physically interacted with IGF-IR (Fig. 7A).
FIGURE 7.

SNCG interacts with IGF-IR and IRS-2. A, HepG2 and MCF-7 lysates were subjected to immunoprecipitation (IP) with SNCG antibody, IGF-IR antibody, or normal IgG. The immunoprecipitates and cell lysates were subjected to Western blot analysis of IGF-IRβ and SNCG. B, HepG2 cell lysates were subjected to immunoprecipitation with SNCG, IRS-1, IRS-2 antibodies, or normal IgG. The immunoprecipitates were subjected to Western blot analysis of SNCG, IRS-1, and IRS-2. C, HepG2 cells were transfected with siCtrl or siIRS2. Forty-eight hours later cell lysates were harvested and subjected to immunoprecipitation with SNCG and IGF-IR antibodies or normal IgG. The immunoprecipitates were subjected to Western blot analysis of IRS-2, SNCG, and IGF-IRβ.
IRS-1 and IRS-2 are well known as binding proteins to IGF-IR. To determine whether SNCG is a component of IGF-IR and IRS complex, HepG2 cell lysates were immunoprecipitated with SNCG, IRS-1, or IRS-2 antibodies followed by Western blotting of SNCG, IRS-1, and IRS-2 in the immunoprecipitates. The results demonstrated that SNCG preferred IRS-2 binding to IRS-1 binding (Fig. 7B). To determine whether IRS-2 mediated the physical interaction between IGF-IR and SNCG, HepG2 cells were transfected with siRNA to IRS-2 or control siRNA followed by immunoprecipitation with SNCG or IGF-IR antibodies. Two siRNA duplex to IRS-2 (siIRS2–1 and siIRS2–2) were synthesized. Whereas SNCG antibody co-immunoprecipitated IGF-IR in siCtrl-transfected cells, IGF-IR was barely detected in the immunoprecipitates from siIRS2-transfected cells (Fig. 7C). Also, IGF-IR antibody co-immunoprecipitated SNCG in siCtrl-transfected cells but not in siIRS2-transfected cells (Fig. 7C). These data indicated that IRS-2 was required for the interaction between IGF-IR and SNCG.
SNCG Knockdown Abrogates the Pro-growth and Pro-migration Effects of IGF-I
To determine whether SNCG knockdown would impair IGF-I-induced cell growth, the abovementioned SNCG siRNA (siSNCG-1, siSNCG-2) or control siCtrl was transfected into T47D cells followed by treating with or without IGF-I. Cell proliferation was detected by counting cell numbers 5 days after IGF-I treatment. In the absence of exogenous IGF-I, SNCG knockdown did not significantly affect cell growth. Treatment of siCtrl-transfected T47D cells with IGF-I significantly increased cellular proliferation rate. SNCG knockdown led to a significant decrease in IGF-I-induced T47D cell growth (Fig. 8A). The down-regulation of SNCG by siRNA to SNCG was confirmed (Fig. 8B). Depletion of SNCG also significantly inhibited IGF-I-induced HepG2 cells proliferation (supplemental Fig. 1). Whereas treatment of siCtrl-transfected HepG2 cells with IGF-I increased cellular proliferation rate by 74%, treatment of siSNCG-transfected cells with IGF-I increased cellular proliferation rate by 44%. These results indicate that SNCG plays important roles in IGF-I-induced cellular proliferation.
FIGURE 8.

SNCG knockdown suppresses IGF-I-induced cell growth. A, T47D cells were transfected with siCtrl, siSNCG-1, or siSNCG-2. Twenty-four hours later the cells were treated with or without 5 ng/ml IGF-I for 5 days. Cell number was counted. The relative cell growth was plotted. Bars, S.E. The cell number in siCtrl-transfected and IGF-I-untreated group was set as 100%. *, p < 0.05, compared with IGF-I-untreated counterparts. Δ, p < 0.05, compared with IGF-I-treated siCtrl cells. A representative of three independent experiments is shown. B, in parallel, cell lysates from siCtrl- or siSNCG-transfected cells were harvested and subjected to Western blot analysis of SNCG expression.
To determine whether SNCG knockdown impairs IGF-I-induced cell migration, the above-mentioned SNCG siRNA (siSNCG-1, siSNCG-2) or siCtrl was transfected into HepG2 cells followed by treating with or without IGF-I. The cells were treated with a subtoxic dose of mitomycin C to inhibit cellular proliferation. Cell migration was dynamically detected by a wound-healing assay over a 4-day time course (Fig. 9). In the absence of exogenous IGF-I, SNCG knockdown by siSNCG-1 and siSNCG-2 slightly suppressed cell migration. Treatment with IGF-I significantly promoted cell migration. The difference in cell migration between siCtrl-transfected cells and siSNCG-transfected cells was more dramatic in IGF-I-treated groups than that in IGF-I-untreated groups (Fig. 9, A and B). Silencing of SNCG dramatically inhibited IGF-I-induced cell migration. The down-regulation of SNCG by siRNA to SNCG was confirmed (Fig. 9C). These data indicate that SNCG promotes IGF-I-induced cell migration.
FIGURE 9.

SNCG knockdown suppresses IGF-I-induced cell migration. A, HepG2 cells were transfected with siCtrl or siSNCG-1. Twenty-four hours later scratches were made in cell cultures. The cells were treated with or without 5 ng/ml IGF-I and 2 μg/ml mitomycin C for 4 days. The gap width was recorded everyday. Bar, 200 μm. The gap width at multiple constant points was measured. The relative gap width was plotted. For each group, the gap width on day 0 was set as 100%. Bars, S.E. *, p < 0.01, compared with IGF-I-untreated siCtrl cells or IGF-I-treated siSNCG cells. Δ, p < 0.05, compared with IGF-I-untreated siSNCG cells. A representative of three independent experiments is shown. B, HepG2 cells were transfected with siCtrl or siSNCG-2. Twenty-four hours later scratches were made in cell cultures. The cells were treated with or without 5 ng/ml IGF-I and 2 μg/ml mitomycin C for 4 days. Bar, 200 μm. C, cell lysates from siCtrl- or siSNCG-transfected cells were harvested and subjected to Western blot analysis of SNCG expression.
DISCUSSION
Multiple lines of evidence have shown that IGF-I signaling plays important roles in tumor progression. Intensive studies have been undertaken to understand IGF-I system components. The genes that were identified as IGF-I-responsive genes are involved in various cellular processes, including cell proliferation, differentiation, apoptosis, and migration, all of which are consistent with the known functions of IGF-I. It should be noted that the IGF-I-responsive gene portfolio may be cell type-specific or context-dependent. Previous studies demonstrated that IGF-I could up-regulate the expression of some oncogenes, including c-jun, twist, and TEL (40, 41). Microarray analysis of IGF-I signaling in 3T3-L1 cells also revealed that IGF-I up-regulated the mitogen heparin-binding epidermal growth factor (42). The IGF system has been implicated in various types of human tumors including breast cancer, liver cancer, colon cancer, and pancreatic cancer. Here, we identified SNCG as a novel IGF-I-responsive gene. Treatment with IGF-I up-regulated SNCG expression, while IGF-IR inhibitor suppressed SNCG expression. Whereas IGF-I signaling to HB-EGF expression depends on MAPK but does not require PI3K (42), the up-regulation of SNCG by IGF-I requires both PI3K and MAPK activity.
The biological effects of IGF-I are mediated by its receptor, IGF-IR. Whereas the EGF receptor family of receptors can be activated by overexpression, IGF-IR is barely activated by overexpression and can be activated by ligands (20). The increased expression of IGF-IR may result in an enhanced response to IGF-I that is manifested in greater downstream signaling through PI3K and MAPK. Interestingly, here we show that SNCG interacts with IGF-IR. Further study demonstrates that SNCG is a component of the IGF-IR and IRS complex. It is well known that IRS acts as adaptor proteins to mediate diverse signaling events. Although IRS-1 and IRS-2 are structurally similar, they may display differential affinity for a given protein, indicating that there are functional differences between IRS-1 and IRS-2 (43). Our results are in agreement with this scenario in showing that IRS-2, but not IRS-1, mediates the interaction between SNCG and IGF-IR.
Silencing of SNCG leads to a decrease in the steady-state levels of IGF-IR, which correlates with a decrease in IGF-I-induced phosphorylation of IGF-IR, IRS-1, Akt, and MAPK. The effects of SNCG expression on IGF-IR levels cannot be attributable to change in IGF-IR transcription. Instead, it appears that SNCG may prevent the degradation of ligand-unoccupied IGF-IR. The degradation of receptor-tyrosine kinases is commonly triggered by ligand binding, which represents a negative feed-back regulation of receptor signaling thereby limiting the duration of the response to ligands (44). Exposure to IGF-I initiates signal transduction cascades followed by the degradation of IGF-IR (45). The down-regulation of IGF-IR by IGF-I binding appears to precede the induction of SNCG expression. Overexpression of SNCG may stabilize IGF-IR and thereby enhance the magnitude of the following rounds of signaling in response to IGF-I stimulation. Alternatively, IGF-I-induced SNCG expression may boost signaling through multiple pathways that are regulated by SNCG.
The effects of IGF-I on cell proliferation, survival, and migration may be mediated by its downstream targets. Silencing of SNCG inhibits IGF-I-induced expression of GRP78, an IGF-I-responsive molecular chaperone (46). Given that GRP78 is a multifunctional protein involved in diverse cellular processes, including the folding and processing of newly synthesized proteins, regulation of calcium homeostasis, modulation of the unfolded protein response, and drug resistance (47), SNCG may indirectly regulate these cellular processes through IGF-IR and GRP78. Notably, SNCG itself is also up-regulated by IGF-I in PI3K- and MAPK-dependent manner. These data suggest that a positive feedback loop exists among SNCG and IGF-I axis. A similar feedback loop is present among IGF-I, HB-EGF, and MAPK. IGF-I induces HB-EGF gene transcription and promotes the cleavage and release of membrane-bound, cell surface HB-EGF with subsequent activation of EGF receptors, which is essential for the activation of MAPK by IGF-I (48). Our study suggests that SNCG is an important regulator of IGF-IR and a mediator for IGF-I signaling.
Activation of the IGF system is known to have substantial pleiotrophic effects on mammalian cells (49). The current study clearly demonstrates that SNCG is regulated by IGF-I and promotes IGF-I-induced cellular proliferation and migration. As a multifunctional protein, SNCG also stimulates estrogen-induced cell proliferation (36, 37). Accumulating evidence indicates that SNCG is a pro-metastasis gene. SNCG overexpression correlates with metastasis in breast carcinoma (31), pancreatic carcinoma (29), liver cancer, and gastric carcinoma (50). Overexpression of SNCG in breast cancer cells leads to an increase in cell motility in vitro and in tumor metastasis in vivo (33). SNCG knockdown reduced perineural invasion and liver/lymph node metastasis in a mouse model of pancreatic cancer (29). ERK and Rho kinases are mediators of SNCG-enhanced cell migration (51). ERK is also required for IGF-I-induced cell migration. In agreement with the suppression of IGF-I-induced ERK phosphorylation by SNCG knockdown, our data demonstrated that silencing of SNCG significantly inhibited IGF-I-induced cell migration. Identification of IGF-I signaling axis as a novel target of SNCG may help to understand how SNCG drives tumor progression. Disruption of IGF-I signaling has been shown to inhibit tumor growth and metastasis in mouse models (52). Given that the levels of SNCG and IGF-IR are mutually regulated by each other, SNCG blockade may be an alternative choice for suppressing IGF-I induced cell proliferation and migration. Conversely, IGF-IR inhibitors may be useful for suppressing the aberrant expression of SNCG in cancer cells, thereby blocking its pro-tumor effects.
Supplementary Material
This work was supported by National Natural Science Foundation of China Grant 30672360 and the Sichuan Science and Technology Program (2007Q14-036).

The on-line version of this article (available at http://www.jbc.org) contains supplemental Table 1 and Fig. 1.
- IGF-IR
- IGF-I receptor
- IRS
- insulin receptor substrate
- SNCG
- γ-synuclein
- siSNCG
- SNCG siRNA
- siCtrl
- control siRNA.
REFERENCES
- 1.Sjögren K., Liu J. L., Blad K., Skrtic S., Vidal O., Wallenius V., LeRoith D., Törnell J., Isaksson O. G., Jansson J. O., Ohlsson C. (1999) Proc. Natl. Acad. Sci. U.S.A. 96, 7088–7092 [DOI] [PMC free article] [PubMed] [Google Scholar]
- 2.Isaksson O. G., Lindahl A., Nilsson A., Isgaard J. (1987) Endocr. Rev. 8, 426–438 [DOI] [PubMed] [Google Scholar]
- 3.Daughaday W. H., Rotwein P. (1989) Endocr. Rev. 10, 68–91 [DOI] [PubMed] [Google Scholar]
- 4.Lund P. K., Moats-Staats B. M., Hynes M. A., Simmons J. G., Jansen M., D'Ercole A. J., Van Wyk J. J. (1986) J. Biol. Chem. 261, 14539–14544 [PubMed] [Google Scholar]
- 5.Bach L. A., Rechler M. M. (1995) Diabetes Rev. 3, 38–61 [DOI] [PubMed] [Google Scholar]
- 6.Firth S. M., Baxter R. C. (2002) Endocr. Rev. 23, 824–854 [DOI] [PubMed] [Google Scholar]
- 7.Ullrich A., Gray A., Tam A. W., Yang-Feng T., Tsubokawa M., Collins C., Henzel W., Le Bon T., Kathuria S., Chen E., Jacobs S., Francke U., Ramachandran J., Fujita-Yamaguchi Y. (1986) EMBO J. 5, 2503–2512 [DOI] [PMC free article] [PubMed] [Google Scholar]
- 8.Grey A., Chen Q., Xu X., Callon K., Cornish J. (2003) Endocrinology 144, 4886–4893 [DOI] [PubMed] [Google Scholar]
- 9.Ohlsson C., Mohan S., Sjögren K., Tivesten A., Isgaard J., Isaksson O., Jansson J. O., Svensson J. (2009) Endocr. Rev. 30, 494–535 [DOI] [PMC free article] [PubMed] [Google Scholar]
- 10.Chan J. M., Stampfer M. J., Giovannucci E., Gann P. H., Ma J., Wilkinson P., Hennekens C. H., Pollak M. (1998) Science 279, 563–566 [DOI] [PubMed] [Google Scholar]
- 11.Hankinson S. E., Willett W. C., Colditz G. A., Hunter D. J., Michaud D. S., Deroo B., Rosner B., Speizer F. E., Pollak M. (1998) Lancet 351, 1393–1396 [DOI] [PubMed] [Google Scholar]
- 12.Ma J., Pollak M. N., Giovannucci E., Chan J. M., Tao Y., Hennekens C. H., Stampfer M. J. (1999) J. Natl. Cancer Inst. 91, 620–625 [DOI] [PubMed] [Google Scholar]
- 13.Yu H., Spitz M. R., Mistry J., Gu J., Hong W. K., Wu X. F. (1999) J. Natl. Cancer Inst. 91, 151–156 [DOI] [PubMed] [Google Scholar]
- 14.Peyrat J. P., Bonneterre J., Hecquet B., Vennin P., Louchez M. M., Fournier C., Lefebvre J., Demaille A. (1993) Eur. J. Cancer 29A, 492–497 [DOI] [PubMed] [Google Scholar]
- 15.Wu Y., Yakar S., Zhao L., Hennighausen L., LeRoith D. (2002) Cancer Res. 62, 1030–1035 [PubMed] [Google Scholar]
- 16.Sonntag W. E., Carter C. S., Ikeno Y., Ekenstedt K., Carlson C. S., Loeser R. F., Chakrabarty S., Lee S., Bennett C., Ingram R., Moore T., Ramsey M. (2005) Endocrinology 146, 2920–2932 [DOI] [PubMed] [Google Scholar]
- 17.Hakam A., Yeatman T. J., Lu L., Mora L., Marcet G., Nicosia S. V., Karl R. C., Coppola D. (1999) Hum. Pathol. 30, 1128–1133 [DOI] [PubMed] [Google Scholar]
- 18.Hellawell G. O., Turner G. D., Davies D. R., Poulsom R., Brewster S. F., Macaulay V. M. (2002) Cancer Res. 62, 2942–2950 [PubMed] [Google Scholar]
- 19.Resnik J. L., Reichart D. B., Huey K., Webster N. J., Seely B. L. (1998) Cancer Res. 58, 1159–1164 [PubMed] [Google Scholar]
- 20.Reinmuth N., Fan F., Liu W., Parikh A. A., Stoeltzing O., Jung Y. D., Bucana C. D., Radinsky R., Gallick G. E., Ellis L. M. (2002) Lab. Invest. 82, 1377–1389 [DOI] [PubMed] [Google Scholar]
- 21.Dunn S. E., Ehrlich M., Sharp N. J., Reiss K., Solomon G., Hawkins R., Baserga R., Barrett J. C. (1998) Cancer Res. 58, 3353–3361 [PubMed] [Google Scholar]
- 22.Prager D., Li H. L., Asa S., Melmed S. (1994) Proc. Natl. Acad. Sci. U.S.A. 91, 2181–2185 [DOI] [PMC free article] [PubMed] [Google Scholar]
- 23.Surguchov A. (2008) Int. Rev. Cell Mol. Biol. 270, 225–317 [DOI] [PubMed] [Google Scholar]
- 24.Clayton D. F., George J. M. (1998) Trends Neurosci. 21, 249–254 [DOI] [PubMed] [Google Scholar]
- 25.Uversky V. N., Li J., Souillac P., Millett I. S., Doniach S., Jakes R., Goedert M., Fink A. L. (2002) J. Biol. Chem. 277, 11970–11978 [DOI] [PubMed] [Google Scholar]
- 26.Zhao W., Liu H., Liu W., Wu Y., Chen W., Jiang B., Zhou Y., Xue R., Luo C., Wang L., Jiang J. D., Liu J. W. (2006) Int. J. Oncol. 28, 1081–1088 [PubMed] [Google Scholar]
- 27.Yanagawa N., Tamura G., Honda T., Endoh M., Nishizuka S., Motoyama T. (2004) Clin. Cancer Res. 10, 2447–2451 [DOI] [PubMed] [Google Scholar]
- 28.Ji H., Liu Y. E., Jia T., Wang M., Liu J., Xiao G., Joseph B. K., Rosen C., Shi Y. E. (1997) Cancer Res. 57, 759–764 [PubMed] [Google Scholar]
- 29.Hibi T., Mori T., Fukuma M., Yamazaki K., Hashiguchi A., Yamada T., Tanabe M., Aiura K., Kawakami T., Ogiwara A., Kosuge T., Kitajima M., Kitagawa Y., Sakamoto M. (2009) Clin. Cancer Res. 15, 2864–2871 [DOI] [PubMed] [Google Scholar]
- 30.Bruening W., Giasson B. I., Klein-Szanto A. J., Lee V. M., Trojanowski J. Q., Godwin A. K. (2000) Cancer 88, 2154–2163 [PubMed] [Google Scholar]
- 31.Guo J., Shou C., Meng L., Jiang B., Dong B., Yao L., Xie Y., Zhang J., Chen Y., Budman D. R., Shi Y. E. (2007) Int. J. Cancer 121, 1296–1305 [DOI] [PubMed] [Google Scholar]
- 32.Hu H., Sun L., Guo C., Liu Q., Zhou Z., Peng L., Pan J., Yu L., Lou J., Yang Z., Zhao P., Ran Y. (2009) Clin. Cancer Res. 15, 5485–5493 [DOI] [PubMed] [Google Scholar]
- 33.Jia T., Liu Y. E., Liu J., Shi Y. E. (1999) Cancer Res. 59, 742–747 [PubMed] [Google Scholar]
- 34.Gupta A., Inaba S., Wong O. K., Fang G., Liu J. W. (2003) Oncogene 22, 7593–7599 [DOI] [PubMed] [Google Scholar]
- 35.Hua H., Xu L., Wang J., Jing J., Luo T., Jiang Y. (2009) J. Pathol. 217, 507–515 [DOI] [PubMed] [Google Scholar]
- 36.Jiang Y., Liu Y. E., Lu A., Gupta A., Goldberg I. D., Liu J., Shi Y. E. (2003) Cancer Res. 63, 3899–3903 [PubMed] [Google Scholar]
- 37.Jiang Y., Liu Y. E., Goldberg I. D., Shi Y. E. (2004) Cancer Res. 64, 4539–4546 [DOI] [PubMed] [Google Scholar]
- 38.Pan Z. Z., Bruening W., Giasson B. I., Lee V. M., Godwin A. K. (2002) J. Biol. Chem. 277, 35050–35060 [DOI] [PubMed] [Google Scholar]
- 39.Gupta A., Godwin A. K., Vanderveer L., Lu A., Liu J. W. (2003) Cancer Res. 63, 664–673 [PubMed] [Google Scholar]
- 40.Chiou S. T., Chang W. C. (1992) Biochem. Biophys. Res. Commun. 183, 524–531 [DOI] [PubMed] [Google Scholar]
- 41.Monnier D., Boutillier A. L., Giraud P., Chiu R., Aunis D., Feltz P., Zwiller J., Loeffler J. P. (1994) Mol. Cell. Endocrinol. 104, 139–145 [DOI] [PubMed] [Google Scholar]
- 42.Dupont J., Khan J., Qu B. H., Metzler P., Helman L., LeRoith D. (2001) Endocrinology 142, 4969–4975 [DOI] [PubMed] [Google Scholar]
- 43.Valverde A. M., Lorenzo M., Pons S., White M. F., Benito M. (1998) Mol. Endocrinol. 12, 688–697 [DOI] [PubMed] [Google Scholar]
- 44.Yarden Y., Sliwkowski M. X. (2001) Nat. Rev. Mol. Cell Biol. 2, 127–137 [DOI] [PubMed] [Google Scholar]
- 45.Lu Z., Hunter T. (2009) Ann. Rev. Biochem. 78, 435–475 [DOI] [PMC free article] [PubMed] [Google Scholar]
- 46.Shen J., Riggs P. K., Hensley S. C., Schroeder L. J., Traner A. R., Kochan K. J., Person M. D., DiGiovanni J. (2007) Mol. Carcinog. 46, 331–340 [DOI] [PubMed] [Google Scholar]
- 47.Lee A. S. (2007) Cancer Res. 67, 3496–3499 [DOI] [PubMed] [Google Scholar]
- 48.Roudabush F. L., Pierce K. L., Maudsley S., Khan K. D., Luttrell L. M. (2000) J. Biol. Chem. 275, 22583–22589 [DOI] [PubMed] [Google Scholar]
- 49.Zhang X., Yee D. (2000) Breast Cancer Res. 2, 170–175 [DOI] [PMC free article] [PubMed] [Google Scholar]
- 50.Liu H., Liu W., Wu Y., Zhou Y., Xue R., Luo C., Wang L., Zhao W., Jiang J. D., Liu J. W. (2005) Cancer Res. 65, 7635–7643 [DOI] [PubMed] [Google Scholar]
- 51.Pan Z. Z., Bruening W., Godwin A. K. (2006) Int. J. Oncol. 29, 1201–1205 [PubMed] [Google Scholar]
- 52.Sachdev D., Yee D. (2007) Mol. Cancer Ther. 6, 1–12 [DOI] [PubMed] [Google Scholar]
Associated Data
This section collects any data citations, data availability statements, or supplementary materials included in this article.