Abstract
The antimicrobial peptide, tilapia hepcidin (TH) 2-3, belongs to the hepcidin family, and its antibacterial function has been reported. Here, we examined the TH2-3-mediated regulation of proinflammatory cytokines in bacterial endotoxin lipopolysaccharide (LPS)-stimulated mouse macrophages. The presence of TH2-3 in LPS-stimulated cells reduced the amount of tumor necrosis factor (TNF)-α secretion. From a microarray, real-time polymerase chain reaction (PCR), and cytokine array studies, we showed down-regulation of the proinflammatory cytokines TNF-α, interleukin (IL)-1α, IL-1β, IL-6, and the prostaglandin synthesis gene, cyclooxygenase (COX)-2, by TH2-3. Studies with the COX-2-specific inhibitor, melaxicam, and with COX-2-overexpressing cells demonstrated the positive regulation of TNF-α and negative regulation of cAMP degradation-specific phosphodiesterase (PDE) 4D by COX-2. In LPS-stimulated cells, TH2-3 acts like melaxicam and down-regulates COX-2 and up-regulates PDE4D. The reduction in intracellular cAMP by TH2-3 or melaxicam in LPS-stimulated cells supports the negative regulation of PDE4D by COX-2 and TH2-3. This demonstrates that the inhibition of COX-2 is among the mechanisms through which TH2-3 controls TNF-α release. At 1 h after treatment, the presence of TH2-3 in LPS-stimulated cells had suppressed the induction of pERK1/2 and prevented the LPS-stimulated nuclear accumulation of NF-κB family proteins of p65, NF-κB2, and c-Rel. In conclusion, TH2-3 inhibits TNF-α and other proinflammatory cytokines through COX-2-, PDE4D-, and pERK1/2-dependent mechanisms.
Keywords: Antimicrobial Peptides, Cellular Immune Response, Cyclooxygenase (COX) Pathway, Endotoxin, Gene Regulation
Introduction
Antimicrobial peptides, positively charged molecules with short amino acid chains, play vital roles in host defense against pathogens by either direct antimicrobial actions or a broad range of immunomodulatory functions (1). A peptide from human urine was isolated and named hepcidin (Hep) based on its hepatic expression (2, 3). Hep functions as a key regulator of iron metabolism and as a defense peptide (3, 4). Recently, three Hep genes were isolated from tilapia (Oreochromis mossambicus) and named tilapia Hep (TH)2 1-5, TH2-2, and TH2-3 (5). In addition, the antimicrobial actions of synthesized TH1-5, TH2-2, and TH2-3 peptides were also reported against bacterial infections (5). However, detailed molecular functions of the immune response have not been studied so far. Because endogenous TH2-3 was stimulated by lipopolysaccharide (LPS) (5), studying the immune-response mechanism of TH2-3 may help elucidate the specific functions of this peptide.
LPS is a Gram-negative bacterial endotoxin that elicits pathogen-associated molecular patterns and stimulates proinflammatory cytokines in host cells (6, 7). Host cells show exaggerated responses to LPS; these lead to a systemic inflammatory response syndrome and produce elevated levels of proinflammatory mediators such as tumor necrosis factor (TNF)-α, which can cause sepsis and death (7–10). Hence, regulating the overproduction of proinflammatory cytokines by modulating the LPS-induced signaling cascade is a potential way to prevent sepsis. LPS recognizes the Toll-like receptor 4 complex (7, 11–16) and activates nuclear factor (NF)-κB family transcription factor proteins (17) by several downstream signaling mechanisms (18–20). Upon activation, the NF-κB dimer is localized to nuclei and activates the transcription of chemokines, adhesion molecules, and cytokines, including interleukin (IL)-1, IL-2, TNF-α, and IL-12 (19–21). Apart from some proinflammatory cytokines, a major prostaglandin-associated gene, cyclooxygenase (COX)-2/PTGS2, is also induced by various stimuli like bacterial endotoxins (22, 23). Nonsterol anti-inflammatory drugs such as aspirin and indomethacin inhibit the expression of COX-2 and are considered essential for relief of inflammation (23). The secondary messenger, cAMP, is activated by COX-2, and intracellular cAMP induces inflammatory cytokines by activating the protein kinase A (PKA) pathway (24). Other enzymes, called type 4 phosphodiesterases (PDEs), are involved in the hydrolysis of cAMP, and cAMP is degraded through the action of cAMP PDEs like PDE4D (25, 26). Hence, studying the significance of COX-2, and the relationship between COX-2 and PDE4D in cAMP regulation will help reveal the role of these gene combinations in controlling inflammation.
In this report, we show that the release of the LPS-induced proinflammatory cytokine, TNF-α, was more effectively reduced by TH2-3 than it was by TH1–5, TH2–2, and human (h)Hep. This study demonstrates the modulation of several proinflammatory gene expressions by TH2-3. In addition, we show that the suppression of COX-2 by TH2-3 activates the second messenger cAMP hydrolysis gene, PDE4D. Studies with phosphatase/kinase inhibitors and protein expression of phosphorylated extracellular signal-regulated protein kinase (pERK)1/2 showed that TH2-3 may interfere with the MAP-ERK kinase (MEK)1/2-associated mechanism of TNF-α induction. Taken together, we show that TH2-3 modulates LPS-induced proinflammatory cytokines by acting through MEK1/2-, COX-2-, and PDE4D-associated pathways.
EXPERIMENTAL PROCEDURES
Cell Lines and Cell Culture
The mouse macrophage cell line, RAW264.7, was obtained from American Type Culture Collection (ATCC, collection TIB-71) and was cultured in Dulbecco's minimum essential medium (DMEM) as per ATCC instructions. Primary macrophages were harvested from 6∼8-week-old BALB/c mice by peritoneal lavage. Cells from four animals were pooled and resuspended at 106 cells in 1 ml of DMEM with 10% fetal bovine serum (FBS), 4 mm l-glutamine, 100 units/ml penicillin, and 100 μg/ml streptomycin. Two milliliters of resuspended cells were seeded in a 35-mm Petri plate and cultured at 37 °C for 2 h. Then nonadherent cells in the supernatant were aspirated, replaced with fresh DMEM with 10% FBS, cultured overnight, and used for the antimicrobial peptide and LPS treatments.
LPS, Peptides, Inhibitors, Reagents, and Antibodies
LPS from Escherichia coli 0111:B4 was purchased from Sigma-Aldrich (catalog no. L2630). Antimicrobial peptides TH1-5 (GIKCRFCCGCCTPGICGVCCRF), TH2-2 (GIKCCFCCGCCNSGVCELCCRF), TH2-3 (QSHLSLCRWCCNCCRSNKGC), and hHep (DTHFPICIFCCGCCHRSKCGMCCKT) were prepared as described previously (5). The p38 mitogen-activated protein kinase (MAPK) inhibitor, SB203580 (catalog no. 559389; Calbiochem), the MEK1 inhibitor, PD98059 (catalog no. 9900; Cell Signaling), the MEK1/2 inhibitor, U0126 (catalog no. 9903; Cell Signaling), and the serine/threonine phosphatase inhibitor, calyculin A (catalog no. 9902; Cell Signaling) were used according to the specifications of the respective companies. For immunofluorescence, rabbit anti-NF-κB/p65 (catalog no. 4764), NF-κB2/p52 (catalog no. 4882), and c-Rel (catalog no. 4774) polyclonal primary antibodies were obtained from Cell Signaling. Anti-rabbit immunoglobulin G (IgG) (whole molecule) and the F (ab′)2 fragment-Cy3 secondary antibody were purchased from Sigma-Aldrich (catalog no. C2306).
LPS and Antimicrobial Peptide Treatment
RAW264.7 cells were seeded in 6-well plates at 1 × 10⁶ cells/well and cultured for 24 h. The next day, 2 h prior to treatment, the old medium in the plates was aspirated out and replaced with serum-free DMEM. For treatment with LPS or antimicrobial peptide alone, 2 ml of serum-free DMEM containing 10 ng/ml LPS or 100 μg/ml antimicrobial peptide was added. Co-treatment with LPS was carried out by adding LPS (10 ng/ml) and antimicrobial peptide (100 μg/ml) in serum-free DMEM. In the case of TH2-3 pretreatment, serum-free DMEM with 100 μg/ml antimicrobial peptide was initially added and incubated in a growth chamber for 30 min, and later 10 ng/ml of LPS was added to the old medium. For TH2-3 after treatment, 10 ng/ml LPS was first added for 30 min, and 100 μg/ml TH2-3 was then added. Cells or supernatants were collected at 1, 2, 4, and 24 h for further analysis.
Complementary (c)DNA Preparation and the Microarray
A Tri-reagent (catalog no. TR 118; Invitrogen) kit was used to isolate total RNA. Full-length first-strand cDNA from total cellular RNA was prepared by Moloney murine leukemia virus high performance reverse transcriptase (catalog no. RT80125K; Epicenter Biotechnologies, Madison, WI). The Agilent mouse oligomicroarray 44K (60-mer) with Sure Print Technology (G4414A; Agilent Technologies, Santa Clara, CA) was used to analyze differentially expressed genes between TH2-3 and LPS and between TH2-3 pre- or post-treated RAW264.7 cells.
Analysis of the DNA Microarrays
Analyses of the chip quality, normalization, direction of differential gene expression, and statistics were conducted with Genespring GX*10.0 Expression analysis software. The following filtering steps were carried out: (i) signal filtering based on the row intensity and the intensity of the spot, and (ii) filtering based on flags to select real images converted into digital data. Biological replicates were then averaged, the overall multiple of change for each treatment group was calculated, and a false discovery rate correction at the p ≤ 0.05 level was applied. Differentially expressed genes from the array data were confirmed by a real-time PCR.
Real-time PCR
A quantitative real-time PCR was conducted using SYBR Green® Real-time PCR Master Mix (catalog no. QPK-201T; Toyobo Life Science, Osaka, Japan), according to the manufacturer's instructions, in an ABI prism 7000 sequence detection system (Applied Biosciences). The multiple of change was calculated relative to a vehicle-treated control after normalization to a housekeeping gene (GAPDH) using 2-ΔΔCt, where ΔCt is (gene of interest Ct) − (GAPDH Ct), and ΔΔCt is (ΔCt treated) − (ΔCt control) (27). The primer sequences are listed in supplemental Table 1.
Cytokine Array
Concentrations of cytokines in the culture medium of 24-h-treated samples were quantified using Raybio® Mouse Cytokine Antibody Array G series III (catalog no. AAM-CYT-3; Raybiotech, Norcross, GA) and IV (catalog no. AAM-CYT-4) kits according to instructions provided with the kits. After blocking, incubation, and washing steps, the membrane was exposed to Kodak X-Omat AR film (catalog no. 1651454; Raybio). Signal intensities were quantified with a Molecular Imager FXTM Pro Plus System and Quantity One® software (Bio-Rad). After blank value deletion, the expression values of the biotin-conjugated immunoglobulin G (IgG) at six spots of the positive control were set to 100%. Then the percent expression of other cytokines relative to the positive control was calculated.
Estimates of TNF-α and Total Protein
The concentration of TNF-α was estimated using a murine TNF-α enzyme-linked immunosorbent assay (ELISA) development kit (catalog no. 900-K54; Peprotech, Rocky Hill, NJ) following the vendor's instructions. Total protein concentrations of supernatant samples were determined by means of a Bradford assay kit (catalog nos. BA00050 and BA00070; OZ Biosciences, Marseille Cedex, France).
COX-2 Overexpression
A pRECEIVER-M03 vector carrying COX-2-e-green fluorescent protein (GFP) driven by a cytomegalovirus (CMV) promoter (catalog no. Ex-Mm21016-M03; Genecopia, Rockville, MD) was purchased. RAW264.7 cells were cultured in 6-well plates at 1.4 × 10⁶ cells/well overnight, and pRECEIVER-M03 was transfected into cells at 5 μg/ml with the aid of a Transfectene lipid reagent (catalog no. 170–3352; Bio-Rad) and cultured for 12 h. Then cells were used for antimicrobial peptide and/or LPS treatments. pRECEIVER-M03 without a COX-2 open reading frame (ORF) was used as an empty vector control. Overexpression was confirmed by a real-time PCR and Western blot analysis.
Intracellular cAMP Assay
An ELISA-based ParameterTM Cyclic AMP Assay kit (catalog no. KGE002B; R&D Systems) was used to determine the cAMP content. Briefly, cells were trypsinized, and 106 cells were pelleted and lysed in 100 μl of lysis buffer. The protein was quantified by a Bradford assay, and lysate with 100 μg of protein was split into aliquots, the volume was made up to 100 μl with lysis buffer, and this was used for the ELISA.
Treatment with Inhibitors
Overnight-cultured cells were washed with phosphate-buffered saline (PBS) and preincubated for 1 h in the desired concentrations of inhibitors in serum-free medium. LPS- and/or TH2-3-treated RAW264.7 cells were cultured in the presence or absence of inhibitors of phosphatase (calyculin A), kinase (PD98059, U0126, and SB203580), the Ca2+ carrier (ionomycin), and IκB-α (TPA). The sample was collected at 24 h after treatment and stored at −80 °C for further analysis.
Western Blot Analysis
Total cell lysate was extracted by Cytobuster (catalog no. 71009; Novagen, San Diego, CA) reagent with a complete Protease Inhibitor Mixture tablet (catalog no. 04 693 116 00, Roche Applied Science). Nuclear extracts was prepared by an NE B-per extraction kit according to the vendor's instructions. A uniform quantity of lysate (50 μg for COX-2 and 10 μg for other proteins) was resolved by 10% SDS-PAGE and was transferred to polyvinylidene difluoride (PVDF) membranes. PBS/T (1% PBS containing 0.1% Tween 20) with 5% nonfat milk powder was used for membrane blocking and preparation of antibody dilutions. One hour-blocked membranes were probed with 1:1000 (for all antibodies used in this study)-diluted primary antibodies overnight at 4 °C and detected with 1:1000-diluted goat anti-rabbit/mouse IgG labeled with horseradish peroxidase (HRP; catalog nos. 7074 (rabbit) and 7076 (mouse); Cell Signaling) for 2 h at room temperature. After three washings with PBS/T for 10 min, the membrane was incubated with Immobilon Western chemiluminescent HRP substrate (catalog no. WBKLS0500; Millipore) for 1 or 2 min at room temperature and exposed to HyBlot CL autoradiography film (catalog no. E3012; Denville Scientific, Metuchen, NJ).
Immunocytochemical Analysis
RAW264.7 cells were cultured overnight in 12-well plates (105 cells/well) over a glass coverslip. Then the medium was aspirated and replaced with 2 ml of DMEM containing either 100 ng/ml LPS or 100 μg/ml TH2-3 plus 100 ng/ml LPS, or was untreated as the control. Cells were cultured for 1 h, after which the coverslips were washed with PBS and fixed in Carnoy's fixative (3:1 ratio of methanol and acetic acid) for 5 min. Detergent was extracted with 3% Triton X-100 (catalog no. T8787; Sigma) for 10 min. The immunocytochemical analysis was performed as described previously (28) with a rabbit anti-NF-κB2, c-REL, or p65 polyclonal primary antibody (1:100), and a Cy3-conjugated sheep anti-rabbit IgG (1:100) secondary antibody. Then DAPI staining was carried out to visualize nuclei. At the end, the coverslips were mounted on slides, and fluorescence signals were observed by a Leica TCS SP5 confocal microscope (Leica Microsystems, Hsinchu, Taiwan). Images were analyzed by a free version of LAS AF lite software (Leica Microsystems).
Flow Cytometry
Cells cultured at a concentration of 1 × 10⁶ cells/well in 6-well plates were treated with LPS or LPS + TH2-3 for 1 h. The method described in a previous report was followed to study NF-κB in isolated nuclei (29) with some modifications. Briefly, nuclei were isolated using an Ez Prep Nuclei Isolation kit (catalog no. NUC-101; Sigma-Aldrich) and 1× PBS with 0.5% BSA was used as washing and staining buffer. Alexa Fluor 488-conjugated mouse anti-human p65 (catalog no. sc-8008-AF488; Santa Cruz Biotechnology), and NF-κB2/p52 (catalog no. sc-7386-AF488; Santa Cruz Biotechnology) monoclonal antibodies were used at 1 μg in 100 μl of staining buffer to detect NF-κB proteins, and 20 μg/ml propidium iodide was used to counterstain nuclei. For whole cell intracellular staining, about 106 cells were fixed and permeabilized in intraprep reagent (catalog no. IM2388; Beckman Coulter) by following company instructions, and 106 cells were probed with 1 μg of p65 or NF-κB2 primary antibody in 100 μl of staining buffer for 30 min, washed with 4 ml of wash buffer followed by staining with Cy3-conjugated sheep anti-rabbit IgG for 30 min, and washed with 4 ml of wash buffer. Immediately the nuclei or cells were resuspended in 1 ml of wash buffer with 1% formaldehyde and analyzed in a BD FACS Caliber 2 Laser (488 and 63 5 nm) flow cytometer (BD Biosciences).
Statistical Analysis
Results are expressed as the mean ± S.E. For statistical analysis SPSS statistical software (SPSS, Chicago, IL) was used, and the significance between treatment conditions was analyzed by a univariate analysis of variance (ANOVA) and post hoc Duncan's analysis. Data were considered statistically significant at p ≤ 0.05.
RESULTS
Antimicrobial Peptide TH2-3 Inhibits LPS-induced TNF-α Release
Comparison of TNF-α release in LPS-stimulated cells in the presence and absence of antimicrobial peptide demonstrated the anti-endotoxin activity of the antimicrobial peptide (8). For this purpose RAW264.7 cells were treated with TH2-3, LPS, or TH2-3 together with LPS for 0, 1, 2, 4, and 24 h, and TNF-α release was assayed by an ELISA. To avoid the possibility of TH2-3-mediated cytotoxicity, a cell proliferation assay was carried out with different concentrations of antimicrobial peptide in RAW264.7 cells, and a concentration of 100 μg/ml in cell culture medium was used for antimicrobial peptide treatments (data not shown). TH1-5, TH2-2, and hHep were also included in the experiments to compare their anti-endotoxin efficiencies. Treatment with LPS increased TNF-α release in the medium, and the amount increased with time and reached a peak at 24 h (supplemental Fig. 1, A–C). Under pre- and co-treatment conditions, the presence of TH2-3 effectively suppressed LPS-stimulated TNF-α release at all time points. With TH2-3 post-treatment, TNF-α release was higher in the 1-, 2-, and 4-h treatments, but at 24 h, the release was controlled by TH2-3. In contrast, TH1-5, TH2-2, and hHep failed to control TNF-α (supplemental Fig. 1, A–D). These data show that TH2-3 exhibited potential anti-endotoxin activity, whereas hHep and the other tilapia hepcidins did not.
Next, the percentage of TNF-α release in cells treated with LPS plus TH2-3 was calculated against cells treated with LPS alone. This value was subtracted from 100%, and the percentage inhibition of TNF-α over LPS was obtained and is displayed in Fig. 1. The release of TNF-α was inhibited at a constant level at all time points in pretreated cells (Fig. 1). During co-treatment, the inhibition rate was lower at 1 h, but showed higher inhibition at 2, 4, and 24 h. Under post-treatment conditions, TH2-3 was unable to control the release of TNF-α at 1, 2, and 4 h; whereas in the late stage at 24 h after treatment, a reduction in TNF-α was observed. This indicates that the sustained presence of TH2-3 either before or at the time of the addition of LPS is necessary to effectively regulate TNF-α.
FIGURE 1.
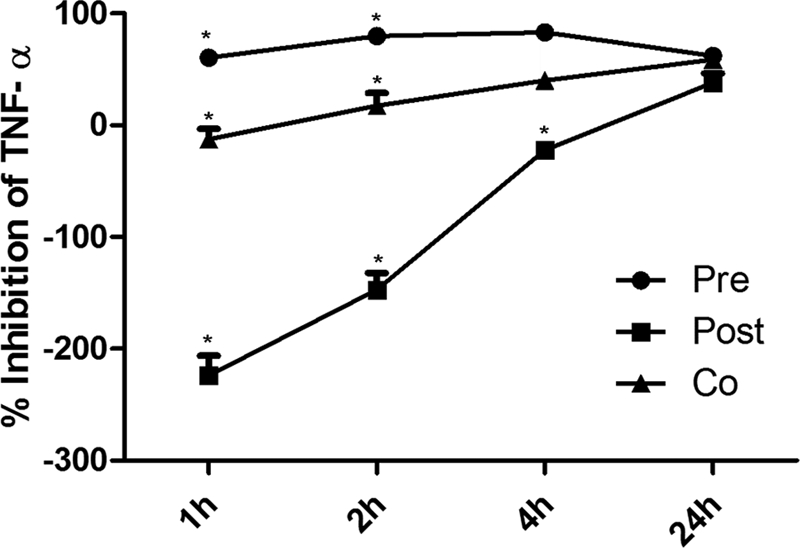
Presence of TH2-3 suppresses LPS-stimulated secretion of TNF-α. The concentration of TNF-α in the cell culture supernatants was monitored by an ELISA following stimulation of cells with LPS (10 ng/ml) in the absence or presence of 100 μg/ml TH2-3 (pre-, co-, and post-treatments) for 1, 2, 4, and 24 h of treatment. The percentages of TNF-α release by pre-, co-, and post-treatments against LPS alone were estimated, and the values were subtracted from 100% and are displayed as the TNF-α inhibition percent against LPS. Values are the mean of three to five independent experiments (n = 3–5). Error bars, S.E. *, values differ at p < 0.05.
TH2-3 Altered the Gene Expression Profile Stimulated by LPS in the Microarray
To understand the impact of TH2-3 on LPS-induced cells, gene expressions were compared using a microarray. RAW264.7 cells were stimulated with TH2-3 under pre- and post-treatment conditions for 24 h with samples collected from two independent experiments. After eliminating bad signals and bad flags, 4889 entities of 22,712 were identified which exhibited a multiple of change of >2.0 at a false discovery rate p value correction of <0.05 between [LPS] versus [LPS + TH2-3 Pre] conditions. Among the genes, 2171 and 2718 genes were up- and down-regulated by LPS, respectively (supplemental Data 1A). The gene expressions of COX-2 and many proinflammatory cytokine genes were down-regulated by the presence of TH2-3 in LPS-stimulated cells. Similar pattern of regulation by TH2-3 was observed in [TH2-3] versus [LPS+TH2-3 post] treatment conditions (supplemental Data 1B). This shows that TH2-3 negatively regulates several LPS-stimulated genes. Several of the genes down-regulated by TH2-3 are well characterized proinflammatory cytokines, chemokines, and associated genes. Next, the differentially expressed genes were overlaid in Pathway Studio 6.2 software, and genes showing a direct interaction within the set were mapped. The gene symbols were color-coded red for up-regulated and green for down-regulated conditions and are presented graphically (supplemental Fig. 2, A and B). The names of the genes in supplemental Fig. 2B are listed in supplemental Fig. 2C. The pathway map showed that genes associated with proinflammatory cytokines (TNF-α, IL-6, IL-1α, IL-1β, IL-23α, and TNFSRF1b), chemokines (CXCL3 and CXCL10), colony-stimulating factor, transcription factor, and DNA-binding proteins (cMYC, MT2, and ID1) were up-regulated by LPS. LPS-mediated up-regulation was suppressed by the presence of TH2-3 (supplemental Fig. 2). cAMP hydrolase- (PDE4D), integrin- (ITGA4), and tubulin (MTMR11)-associated genes were suppressed by LPS, and this was prevented by TH2-3. The data showed that several LPS-stimulated sepsis- and inflammation-oriented genes were modulated by TH2-3.
LPS-induced Genes Were Selectively Modulated by TH2-3 at the Transcription Level
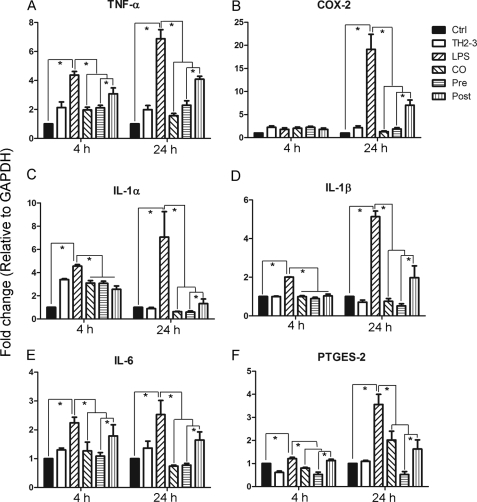
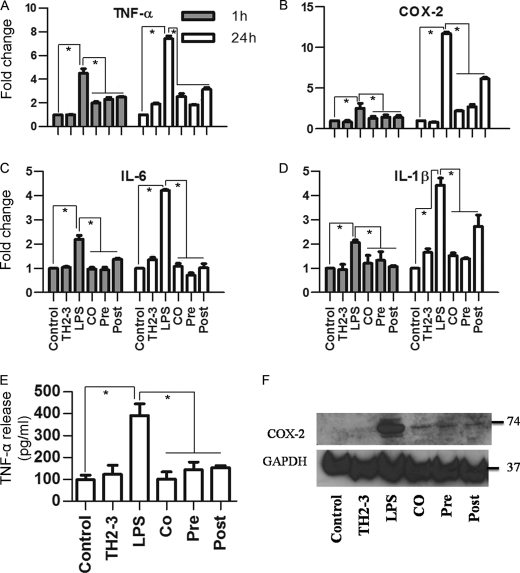
Based on the microarray data, representative LPS- and TH2-3-responsive gene expressions were checked by real-time PCR in RAW264.7 cells at 1, 2, 4, and 24 h (Fig. 2; data not shown for 1 and 2 h). Several proinflammatory-associated genes were up-regulated at 1 h of treatment, and the induction was slightly decreased at 2 or 4 h, but had increased by 24 h. At 24 h, expression rates of TNF-α, COX-2, IL-1α, IL-1β, IL-6, and PTGES-2 (Fig. 2) were higher in LPS-treated samples than in the presence of TH2-3 under co-, pre-, and post-treatment conditions. This confirmed the transcriptional down-regulation of LPS-induced genes by TH2-3. Notably, the suppression was higher in pre- and co-treated conditions than with post-treatment. Because the time difference between the addition of LPS and TH2-3 in co- and post-treatment was only 30 min, the signaling activation induced by LPS in the first 30 min was critical for inducing proinflammatory cytokines. The major proinflammatory gene, TNF-α, was efficiently controlled by the presence of TH2-3 (Fig. 2A). Additionally LPS-induced prostaglandin-associated genes, COX-2 and PTGES, were also negatively regulated by TH2-3 (Fig. 2, B and F). In particular, the induction of COX-2 in LPS-treated samples at 24 h was effectively suppressed by TH2-3. A similar kind of TH2-3-mediated regulation was observed when TNF-α, COX-2, IL-6, and IL-1β genes were tested in 1 h- and 24 h-treated mouse primary residential peritoneal macrophage (RPM) cells obtained from peritoneal lavage (Fig. 3, A–D).
FIGURE 2.
TH2-3 modulates LPS-stimulated proinflammatory cytokine genes in RAW264.7 cells. Real-time PCR expression of TNF-α (A), COX-2 (B), IL-1α (C), IL-1β (D), IL-6 (E), and PTGES-2 (F) genes in TH2-3-, LPS-, pre-, co-, and post-treated conditions at 4 and 24 h after treatment is shown. Multiples of change (y axis) for each gene were normalized to GAPDH and are relative to the gene expression in unstimulated cells of each time point (normalized to 1) using the comparative Ct method. Values are the mean of three or four independent experiments (n = 3 or 4). Error bars, S.E. *, values differ at p < 0.05.
FIGURE 3.
TH2-3 modulates LPS-stimulated proinflammatory cytokines in mouse RPM cells collected from peritoneal lavage. Real-time PCR expression of TNF-α (A), COX-2 (B), IL-6 (C), and IL-1β (D) genes in RPM cells with TH2-3-, LPS-, pre-, co-, and post-treated conditions at 1 and 24 h is shown. Multiples of change of each gene were normalized to GAPDH and are relative to the gene expressions in unstimulated cells at each time point (set to 1) using the comparative Ct method. E, secretion of TNF-α in the cell culture supernatants of 24-h-treated RPM cells was measured by an ELISA. Values are the mean of three independent experiments (n = 3). Error bars, S.E. *, values differ at p < 0.05. F, about 50 μg of whole cell protein extracts from 24 h-treated RPM cells was subjected to a Western blot analysis using a COX-2-specific primary antibody and anti-rabbit IgG secondary antibody. An antibody specific to GAPDH was used as the control. Proteins extracted from three independent experiments were mixed together and used for the expression analysis.
TH2-3 Inhibits Release of LPS-stimulated Proinflammatory Cytokines
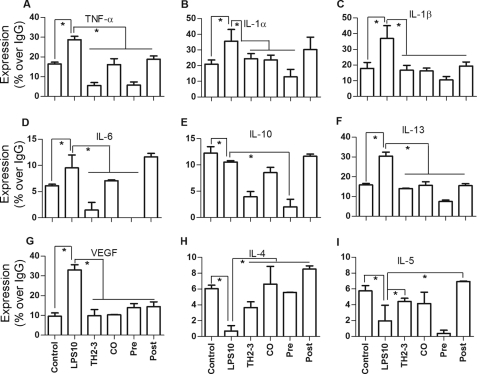
TNF-α secretion in 24-h-treated RPM cell culture was assayed by an ELISA, and the COX-2 expression in the whole cell lysate was tested by a Western blot analysis. Similar to RAW264.7 cells, the presence of TH2-3 effectively controlled TNF-α secretion in RPM cells (Fig. 3E). To compare the results with the cytokine array, the TNF-α secretion relative percent to IgG is shown in supplemental Fig. 3, G and H. Additionally, the expression of COX-2 protein was suppressed by TH2-3 in LPS-stimulated cells (Fig. 3F). To investigate further the effects of transcriptional regulation in the release of proinflammatory cytokines, a cytokine array was used. At 24 h of treatment, LPS-stimulated release rates of TNF-α, IL-1α, IL-1β, IL-6, IL-10, IL-13, and vascular endothelial growth factor (VEGF) were down-regulated by TH2-3 (Fig. 4, A–G, and supplemental Data 1C). In comparisons of pre-, co-, and post-treatment conditions, the suppression rate was higher under TH2-3 pre- and co-treated conditions than the post-treated condition. Under a post-treated condition, IL-6 and IL-10 expressions were comparable with those with LPS alone. This observation is in accordance with the real-time PCR results. Expressions of cytokines such as IL-4 and IL-5 were induced to a greater extent by the presence of TH2-3 than with LPS alone, showing that TH2-3 may selectively modulate different cytokines at different levels. Pre- and co-treatment with TH2-3 controlled the LPS-induced signaling mechanism in the early phase up to 4 h, and late induction was effectively controlled by pre-, co-, and post-treatment with TH2-3. This implies that TH2-3 may show two kinds of responses to LPS. The early response may modulate specific signaling mechanisms up to 4 h of LPS treatment, and the late response at 24 h involves an additional pathway in addition to the early one.
FIGURE 4.
TH2-3 regulates LPS-induced release of proinflammatory cytokines. RAW264.7 cell culture supernatants of untreated control, TH2-3-, LPS-, pre-, co-, and post-treated conditions for 24 h were analyzed by a cytokine array kit, and the cytokine secretions of TNF-α (A), IL-1α (B), IL-1β (C), IL-6 (D), IL-10 (E), IL-13 (F), VEGF (G), IL-4 (H), and IL-5 (I) are expressed as relative percentages to the IgG positive control. Mixtures of three independent experimental samples were used for the cytokine array, and the result is the mean of two replicate values. Error bars, S.E. *, values differ at p < 0.05.
COX-2 and PDE4D Regulated TNF-α Expression and Release
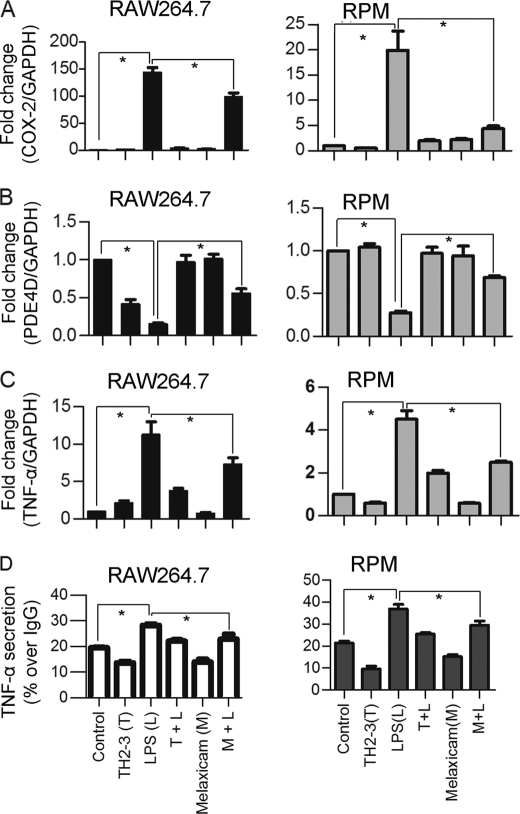
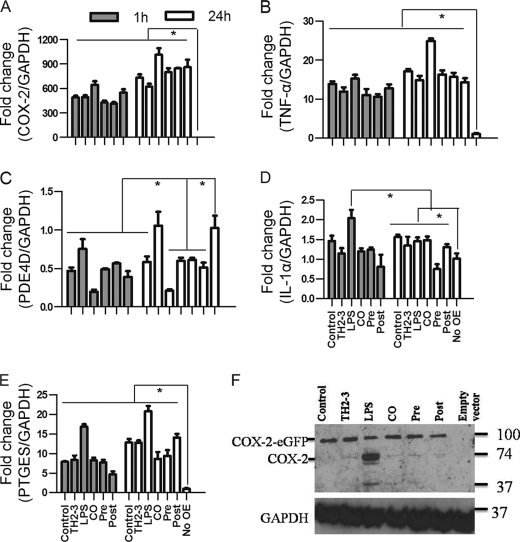
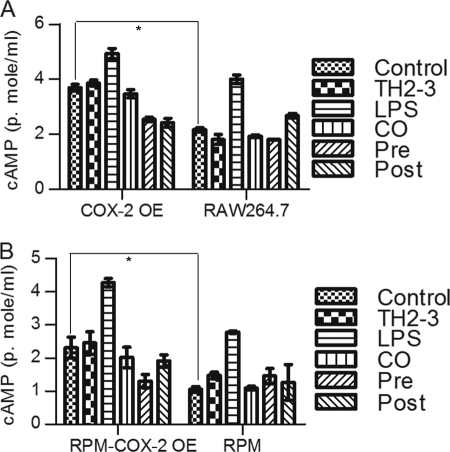
The microarray and real-time PCR showed that COX-2 was highly induced by LPS, and it was suppressed by the presence of TH2-3 at 24 h (Figs. 2 and 3). The COX-2-specific inhibitor, melaxicam, was used to determine whether the suppression of COX-2 by TH2-3 was involved in regulating TNF-α and other proinflammatory cytokines. LPS (100 ng/ml)-stimulated RAW264.7 and RPM cells were cultured in the presence or absence of melaxicam (30 μm) for 24 h, and the expressions of proinflammatory cytokines were analyzed by real-time PCR. The presence of the COX-2 inhibitor reduced the LPS-stimulated expressions of COX-2, TNF-α, and IL-6, but the expressions of IL-1α, IL-1β, and IL-23α were not suppressed (Fig. 5 and supplemental Fig. 3). This showed that in addition to an IL-1-dependent mechanism, TH2-3 regulates TNF-α and IL-6 through suppression of COX-2. Similar to TH2-3, a COX-2 inhibitor also up-regulated the cAMP hydrolase, PDE4D, in LPS-stimulated cells (Fig. 5B). In addition, TNF-α secreted by LPS stimulation was inhibited in the presence of melaxicam as observed by an ELISA (Fig. 5D). To confirm the involvement and connection between COX-2 and PDE4D further, a COX-2-eGFP driven by a CMV promoter in the pRECEIVER-M03 plasmid was transfected into RAW264.7 cells. Gene expressions of COX-2, TNF-α, PDE4D, IL-1α, and PTGES were studied in COX-2-overexpressing (OE) cells (Fig. 6, A–E). The overexpression was confirmed by a Western blot analysis using a COX-2-specific antibody in whole cell lysates (Fig. 6F). Additionally, the amount of TNF-α secreted increased in COX-2-OE cells (supplemental Fig. 6). COX-2-OE cells induced the expression of TNF-α and associated proinflammatory cytokines and suppressed PDE4D gene expression (Fig. 6, A–E). Because PDE4D is known to degrade cAMP, inhibition of COX-2 was unable to suppress PDE4D and may have decreased intracellular cAMP. To understand this phenomenon, the cAMP concentration was estimated by an indirect ELISA. In a COX-2-OE condition, down-regulation of PDE4D increased cAMP, and cAMP was comparatively higher than in non-OE cells (Fig. 7). Between TH2-3 and LPS treatments, the presence of TH2-3 in LPS-stimulated cells showed reduced cAMP (Fig. 7). This result supports the regulation of PDE4D by COX-2 and cAMP.
FIGURE 5.
Effects of melaxicam on the expressions of TNF-α, COX-2, and PDE4D. RAW264.7 or RPM cells were treated with 100 ng/ml LPS in the presence or absence of 100 μg/ml TH2-3 or 30 μm melaxicam for 24 h. A–C, relative expressions of COX-2, PDE4D, and TNF-α by real-time PCR are shown. D, secretion of TNF-α in the culture medium at 24 h after treatment was measured by an ELISA, and the results are displayed as percent expression over IgG. Values are the mean of three independent experiments (n = 3). Error bars, S.E. *, values differ at p < 0.05.
FIGURE 6.
Overexpression of COX-2 induces proinflammatory cytokine expressions in TH2-3-treated cells. RAW264.7 cells were transfected with a pRECEIVER-COX-2-eGFP vector and treated with LPS and/or TH2-3. A–E, the gene expressions of COX-2 (A), TNF-α (B), PDE4D (C), IL-1α (D), and PTGES (E) were measured by a real-time PCR. Multiples of change for each gene were normalized to GAPDH and are relative to the gene expression in unstimulated cells (set to 1) using the comparative Ct method. Values are the mean of three independent experiments (n = 3). Error bars, S.E. *, values differ at p < 0.05. F, Western blot with a COX-2-specific antibody in COX-2-overexpressing cells at 24 h after treatment is shown. Whole cell lysates from three independent experiments were pooled together, and 50 μg of the cell lysate was used to detect the expression.
FIGURE 7.
Effects of TH2-3 and COX-2 on intracellular cAMP concentrations. Murine RAW264.7 macrophages or RPM cells were overexpressed (OE) with COX-2-eGFP, and along with the empty vector control, were treated with TH2-3 and LPS under pre-, co-, and post-conditions for 24 h, and the intracellular cAMP from 100 μg total cell protein lysate was measured by an ELISA technique. A, RAW264.7-COX2-OE or RAW264.7 cells at 24 h after treatment. B, RPM-COX-2-OE or RPM cells at 24 h after treatment. Values are the mean of three independent experiments (n = 3). Error bars, S.E. *, values differ at p < 0.05.
TH2-3 Modulated pERK1/2
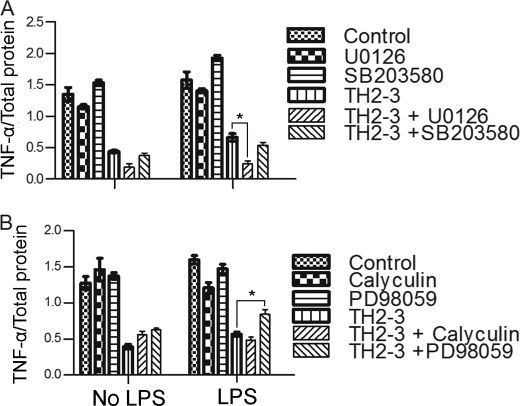
To determine the additional signaling pathways mediated by TH2-3, a study with different inhibitors was conducted. RAW264.7 cells were treated with inhibitors for Ser/Thr phosphatase (calyculin A), MEK1 (PD98059), MEK1/2 (U0126), p38 MAPK (SB203580), a Ca2+ carrier (ionomycin), and IκBα (TBA). The above inhibitors may elucidate the possible role of TH2-3 in regulating proinflammatory cytokines. For that, TNF-α secretion relative to total protein (Fig. 8) in the supernatant was observed in 4-h-treated cells. To compare with the cytokine array results, the TNF-α relative secretion percentage to IgG in the supernatant was calculated and displayed (supplemental Fig. 4). Under LPS-stimulated conditions, the presence of calyculin significantly reduced TNF-α release compared with LPS alone, whereas SB203580 and TPA increased TNF-α release. This showed that LPS can induce Ser/Thr phosphatase and inhibit MAPK and IκBα to induce TNF-α release.
FIGURE 8.
Effects of various signaling inhibitors on TH2-3-mediated regulation of proinflammatory cytokines. Overnight-cultured RAW264.7 cells were treated with 10 ng/ml LPS and/or 100 μg/ml TH2-3 in the presence or absence of various phosphatase and kinase inhibitors in serum-free medium for 4 h. Then, secretion of TNF-α in the supernatants of control, LPS, TH2-3, and LPS co-treated with TH2-3 cells was assayed by an ELISA. A, U0126 (a MEK1/2 inhibitor) at 10 μm or 10 μm SB 203508 (a P38/MAPK inhibitor). B, calyculin A (a serine/threonine phosphatase inhibitor) at 10 μm or 10 μm PD98059 (a MEK1 inhibitor). Values are the mean of three independent experiments (n = 3). Error bars, S.E. *, values differ at p < 0.05.
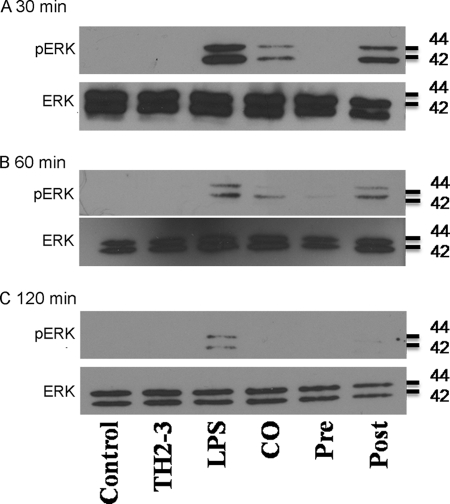
In the case of TH2-3 with inhibitors in LPS-stimulated cells, TH2-3 with PD98059 increased TNF-α release, and the combination of TH2-3 and U0126 decreased TNF-α release. This showed that TH2-3 can regulate TNF-α release by modifying the MEK1/2-mediated signaling pathway. Recent reports showed that PD98059 is specific to ERK1, and U0126 is specific to ERK1/2 and suppressed pERK1/2 stimulated by LPS (30, 31). This suggests that TH2-3 may act through pERK1/2. To understand the underlying mechanism, the expressions of ERK1/2 and pERK1/2 in LPS-stimulated cells in the presence or absence of TH2-3 were analyzed by Western blotting. Total cell lysates were collected from LPS alone, and pre-, co-, and post-treated conditions at 0.5, 1, and 2 h after treatment, and subjected to Western blotting using ERK1/2- and pERK1/2-specific antibodies. In all treatment conditions, ERK1/2 was highly expressed (Fig. 9), whereas pERK1/2 expression was high in LPS-stimulated cells, but decreased in the presence of TH2-3. In the pretreatment condition, pERK1/2 was completely suppressed, but pERK1/2 was observed at 0.5 and 1 h in co- and 0.5, 1, and 2 h in post-treated conditions (Fig. 9).
FIGURE 9.
Effects of TH2-3 on LPS-stimulated pERK expression. RAW264.7 cells were treated with LPS under pre-, co-, and post-conditions for 0.5 h (A) 1 h (B), and 2 h (C). Total cell lysates from three independent experiments were pooled together, and 10 μg of protein from each treatment was subjected to Western blotting against ERK1/2- and pERK1/2-specific primary antibodies followed by an anti-rabbit secondary antibody.
Nuclear Accumulation of LPS-induced NF-κB Subunits Was Inhibited by TH2-3
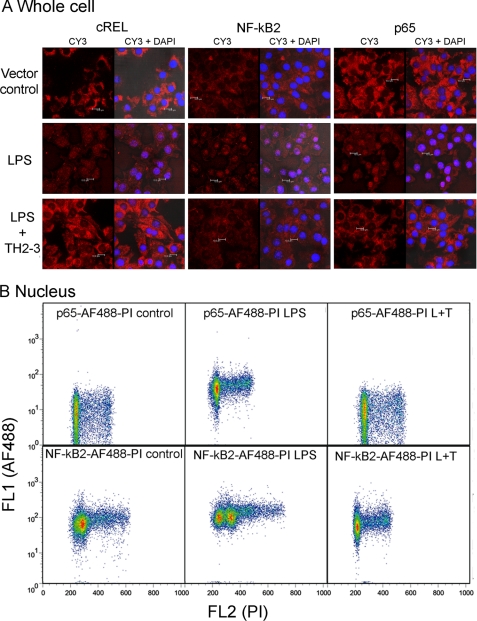
In general, LPS increased the nuclear localization of the NF-κB protein, and it bound to DNA activation sites in the promoter regions of several proinflammatory cytokines and activated their transcription. To investigate the effects of LPS-induced nuclear accumulation on NF-κB proteins by TH2-3, the subcellular distributions of NF-κB2, c-REL, and p65 were analyzed by immunocytochemistry. In RAW264.7 cells stimulated with 100 ng/ml LPS for 1 h, increases in the staining of p65, NF-κB2 and cREL were observed in the nucleus, demonstrating activation of NF-κB in the nucleus (Fig. 10A). But nuclear staining was prevented in the presence of TH2-3. To confirm the nuclear accumulation further, LPS- or LPS + TH2-3-treated whole cells or isolated nuclei were stained with p65 or NF-κB2 conjugated with the AF488 antibody and subjected to flow cytometry. In 1-h-treated nuclei, shifts in the florescence intensities of p65-AF488 and NF-κB2-AF488 were detected in LPS-stimulated samples and were higher than the vector control, and LPS + TH2-3-treated conditions (Fig. 10B and supplemental Fig. 5A). Notably, the florescence pattern did not differ among LPS, LPS + TH2-3, and untreated whole cells (supplemental Fig. 5B). This shows that the presence of TH2-3 prevented LPS-stimulated NF-κB activation of proinflammatory cytokines. Taken together, TH2-3 may act upon ERK1/2 and regulate NF-κB activation in the early hours of LPS stimulation.
FIGURE 10.
TH2-3 inhibited the LPS-mediated nuclear translocation of NF-κB subunits. RAW264.7 cells were stimulated with 100 ng/ml LPS, LPS co-treated with 100 μg/ml TH2-3, or an untreated vector control for 1 h. A, cells cultured over the coverslip were fixed in 4% paraformaldehyde, and localizations of p65, NF-κB2 and cREL were observed by probing with a respective polyclonal anti-rabbit antibody and Cy3-conjugated secondary antibody. Localization of NF-κB alone (Cy3) and co-localization of NK-κB with nuclei stained with DAPI (Cy3 + DAPI) are shown for comparison. Results are representative of three independent experiments. B, flow cytometric analysis of p65 and NF-κB2 expressions in nuclei is shown. Nuclei were isolated from 1-h-treated cells and stained with p65-AF488- or NF-κB2-AF488-conjugated primary antibodies and 10 μg/ml propidium iodide (PI). Then cells were analyzed in BD FACS caliber, and the shift in florescence intensity is displayed in the figure. The results shown are representative of three independent experiments.
DISCUSSION
In the innate immune system, the pattern recognition receptor subfamily member, Toll-like receptor 4, acts as a crucial receptor for the pathogen-associated molecular pattern of Gram-negative bacteria known as LPS (32). Avoiding excessive and imbalanced cytokine responses against LPS is a key to preventing sepsis (32, 33). The results of this paper showed that the major proinflammatory cytokine, TNF-α, released by LPS-stimulated RAW264.7 and mouse RPM cells was controlled by TH2-3, and the anti-endotoxin efficiency in suppressing TNF-α was higher with TH2-3 than with other tilapia and human Heps. This implies that TH2-3 is a potential antimicrobial peptide against inflammation and sepsis, and additional studies in mice are ongoing to elucidate its in vivo functions.
In treatment with LPS alone, induction rates of TNF-α, IL-1α, IL-1β, and COX-2/PTGS2 increased at 1 h and in the slow phase at 2 or 4 h, and the induction was observed for up to 24 h. This kind of temporal expression pattern induced by LPS is in accordance with a previous report of LPS-stimulated macrophages (31). The TH2-3 peptide efficiently suppressed cytokine stimulation at both early and late times of LPS stimulation, and the suppression efficiency was much higher in the late phase. Suppression of NF-κB by TH2-3 shows that LPS-initiated and Toll-like receptor 4-mediated activation of the NF-κB-associated pathway is negatively regulated by TH2-3. NF-κB family genes play key roles in pathogen-associated sepsis (34, 35). Signal transduction mechanisms triggered by inflammation-associated stimuli enhance the nuclear localization of NF-κB homodimeric or heterodimeric forms (36–38).
In melaxicam-treated RAW264.7 cells, expressions of TNF-α, IL-6, and PTGER2 were down-regulated, and that of PDE4D was up-regulated by COX-2. But, the IL-1α, IL-1β, and IL-23a genes were not down-regulated by melaxicam. This indicates that in addition to COX-2, TH2-3 may also regulate additional cytokines by acting through different signaling mechanisms. Treatment with major signaling pathway inhibitors showed that TH2-3 may influence the MEK1/2 pathways and reduce ERK1/2 phosphorylation to regulate proinflammatory cytokines. This supports the idea that the LPS-induced nuclear accumulation of NF-κB is inhibited by TH2-3 through MEK1/2. Immunocytochemistry and Western blotting showed that the presence of TH2-3 prevented the nuclear accumulation of NF-κB2 and p65 in LPS-stimulated cells, and it may regulate the transcription of proinflammatory cytokines.
Expression of the cAMP hydrolase gene, PDE4D, was down-regulated by LPS, and its down-regulation was abolished in the presence of TH2-3. In general, cAMP induction is synergistic with inflammatory cytokines (39). Positive regulation of NF-κB/Rel by cAMP cascades and attenuation of the LPS-induced effect by inhibition of adenylate cyclase were demonstrated in RAW264.7 cells (40). Expression of the prostaglandin E (PGE)2-associated gene, COX-2, increased by 2- and 19-fold in LPS-stimulated cells after 4 and 24 h of treatment, respectively. PGE2 is the major product of COX-2 (41), and it acts via receptor-mediated generation of cAMP and activation of PKA (41). The induction of PGE2 also precedes the increase in cAMP, and PGE2 acts as an autocrine factor for adenylate cyclase activation (24). The observations in this report showed the existence of regulation of TNF-α by COX-2, PDE4D, and associated mechanisms. The presence of TH2-3 suppressed endogenously expressed COX-2 protein, but failed to inhibit the overexpression of COX-2-eGFP protein according to Western blotting (Fig. 6F). This demonstrates that COX-2-mediated regulation was at the transcriptional not the translational level. Expressions of PDE4D, COX-2, and TNF-α in melaxicam-treated and COX-2-OE cells showed that suppression of COX-2 may increase the cAMP hydrolase, PDE4D. An increase in intracellular cAMP resulted in activation of PKA, PKC, p38, MAPK, ERK, IκK, and p65 phosphorylation, and NF-κB which may be involved in proinflammatory cytokine production (28). In our report, the induction of cAMP was in accordance with the expression of COX-2 and suppression of PDE4D. In addition, suppression of PDE4D was prevented by TH2-3 in LPS-stimulated cells. Hence, activation of PDE4D by TH2-3 may result in hydrolysis of cAMP, whereas the cAMP-mediated activation of PKA or other pathways related to proinflammatory cytokine production was abolished. Taken together, TH2-3 may act through the MEK1/2 pathway; and secondary messenger cAMP pathways may act through COX-2 and PDE4D, to regulate the expression of proinflammatory cytokines.
The other tilapia peptide, TH2-2, failed to exhibit any antimicrobial function against LPS (supplemental Fig. 1). This suggests that unlike the dual role of iron regulatory and antimicrobial functions carried out by mammalian Hep, fish Hep genes evolved to separate those into independent mechanisms (42). A comparison of the iron-regulatory mechanism between these Heps supports this notion. Notably, the interaction efficiency of tilapia Heps with the Hep-binding domain (42) of the iron-regulated transporter solute carrier family 40, and LPS-responsive beige-like anchor proteins in the mouse should clarify this phenomenon. In addition, COX-2 binds to iron with a heme-binding motif in its catalytic region (43). Studying the relationship between ferritin iron homeostasis mediated by hepcidin and its consequences for transcription of COX-2 will help explain the role of iron in bacterial diseases.
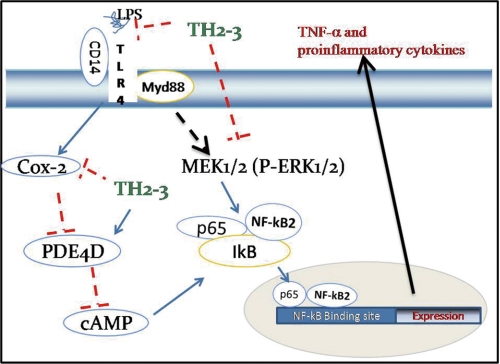
Enhanced resistance to different bacterial pathogens in transgenic fish expressing TH2-3 has recently been reported (44). Prior to this study of TH2-3, the involvement of any fish antimicrobial peptide in the mammalian host defense mechanism had not been reported. Thus, the present report is significant in terms of exploiting the potentiality of fish and marine resources for clinical purposes. In conclusion, the suppression of TNF-α and other proinflammatory cytokines in mammalian cells by TH2-3 (Fig. 11) will widen the options of utilizing aquatic resources to develop novel drugs against inflammation and sepsis.
FIGURE 11.
Proposed signaling pathway modulated by TH2-3 in LPS-induced RAW264.7 cells.
Supplementary Material
This work was supported by the Marine Research Station, Institute of Cellular and Organismic Biology, Academia Sinica, Jiaushi, Ilan 262, Taiwan.

The on-line version of this article (available at http://www.jbc.org) contains supplemental Figs. 1–6, Table 1, and Data 1.
- TH
- tilapia hepcidin
- hHep
- human hepcidin
- OE
- overexpressing
- PDE
- phosphodiesterase
- PGE
- prostaglandin E
- RPM
- residential primary macrophage.
REFERENCES
- 1.Jenssen H., Hamill P., Hancock R. E. W. (2006) Clin. Microbiol. Rev. 19, 491–511 [DOI] [PMC free article] [PubMed] [Google Scholar]
- 2.Verga Falzacappa M. V., Muckenthaler M. U. (2005) Gene 364, 37–44 [DOI] [PubMed] [Google Scholar]
- 3.Park C. H., Valore E. V., Waring A. J., Ganz T. (2001) J. Biol. Chem. 276, 7806–7810 [DOI] [PubMed] [Google Scholar]
- 4.Ganz T. (2003) Blood 102, 783–788 [DOI] [PubMed] [Google Scholar]
- 5.Huang P. H., Chen J. Y., Kuo C. M. (2007) Mol. Immunol. 44, 1922–1934 [DOI] [PubMed] [Google Scholar]
- 6.Zhong J., Gavrilescu L. C., Molnár A., Murray L., Garafalo S., Kehrl J. H., Simon A. R., Van Etten R. A., Kyriakis J. M. (2009) Proc. Natl. Acad. Sci. U.S.A. 106, 4372–4377 [DOI] [PMC free article] [PubMed] [Google Scholar] [Retracted]
- 7.Godowski P. J. (2005) Nat. Immunol. 6, 544–546 [DOI] [PubMed] [Google Scholar]
- 8.Mookherjee N., Brown K. L., Bowdish D. M., Doriah S., Falsafi R., Hokamp K., Roche F. M., Mu R., Doho G. H., Pistolic J., Powers J. P., Bryan J., Brinkman F. S. L., Hancock R. E. (2006) J. Immunol. 176, 2455–2464 [DOI] [PubMed] [Google Scholar]
- 9.Lolis E., Bucala R. (2003) Nat. Rev. Drug Discov. 2, 635–645 [DOI] [PubMed] [Google Scholar]
- 10.Vogel S. N., Fitzgerald K. A., Fenton M. J. (2003) Mol. Interv. 3, 466–477 [DOI] [PubMed] [Google Scholar]
- 11.Andreakos E., Sacre S. M., Smith C., Lundberg A., Kiriakidis S., Stonehouse T., Monaco C., Feldmann M., Foxwell B. M. (2004) Blood 103, 2229–2237 [DOI] [PubMed] [Google Scholar]
- 12.O'Neill L. A., Greene C. (1998) J. Leukocyte Biol. 63, 650–657 [PubMed] [Google Scholar]
- 13.O'Neill L. A., Dinarello C. A. (2000) Immunol. Today 21, 206–209 [DOI] [PubMed] [Google Scholar]
- 14.Zhang G., Ghosh S. (2001) J. Clin. Invest. 107, 13–19 [DOI] [PMC free article] [PubMed] [Google Scholar]
- 15.Burns K., Martinon F., Esslinger C., Pahl H., Schneider P., Bodmer J. L., Di Marco F., French L., Tschopp J. (1998) J. Biol. Chem. 273, 12203–12209 [DOI] [PubMed] [Google Scholar]
- 16.Kobayashi K., Hernandez L. D., Galán J. E., Janeway C. A., Jr., Medzhitov R., Flavell R. A. (2002) Cell 110, 191–202 [DOI] [PubMed] [Google Scholar]
- 17.Ninomiya-Tsuji J., Kishimoto K., Hiyama A., Inoue J., Cao Z., Matsumoto K. (1999) Nature 398, 252–256 [DOI] [PubMed] [Google Scholar]
- 18.Kopp E., Medzhitov R., Carothers J., Xiao C., Douglas I., Janeway C. A., Ghosh S. (1999) Genes Dev. 13, 2059–2071 [DOI] [PMC free article] [PubMed] [Google Scholar]
- 19.Tripathi T., Aggarwal A. (2006) Curr. Sci. 90, 519–531 [Google Scholar]
- 20.Schmid J. A., Birbach A. (2008) Cytokine Growth Factor Rev. 19, 157–165 [DOI] [PubMed] [Google Scholar]
- 21.Zhang X., Song Y., Ci X., An N., Ju Y., Li H., Wang X., Han C., Cui J., Deng X. (2008) Inflamm. Res. 57, 524–529 [DOI] [PubMed] [Google Scholar]
- 22.Wang C., Petzke M. M., Iyer R., Wu H., Schwartz I. (2008) J. Immunol. 180, 8306–8315 [DOI] [PMC free article] [PubMed] [Google Scholar]
- 23.Tanabe T., Tohnai N. (2002) Prostaglandins Other Lipid Mediat. 68–69, 95–114 [DOI] [PubMed] [Google Scholar]
- 24.Chen C. C., Chiu K. T., Sun Y. T., Chen W. C. (1999) J. Biol. Chem. 274, 31559–31564 [DOI] [PubMed] [Google Scholar]
- 25.Willoughby D., Wong W., Schaack J., Scott J. D., Cooper D. M. F. (2006) EMBO J. 25, 2051–2061 [DOI] [PMC free article] [PubMed] [Google Scholar]
- 26.Houslay M. D., Adams D. R. (2003) Biochem. J. 15, 1–18 [DOI] [PMC free article] [PubMed] [Google Scholar]
- 27.Pfaffl M. W. (2001) Nucleic Acids Res. 29, e45. [DOI] [PMC free article] [PubMed] [Google Scholar]
- 28.Chen B. C., Liao C. C., Hsu M. J., Liao Y. T., Lin C. C., Sheu J. R., Lin C. H. (2006) J. Immunol. 177, 681–693 [DOI] [PubMed] [Google Scholar]
- 29.Cognasse F., Sabido O., Béniguel L., Genin C., Garraud O. (2003) Immunol. Lett. 90, 49–52 [DOI] [PubMed] [Google Scholar]
- 30.Cerioni L., Palomba L., Cantoni O. (2003) FEBS Lett. 547, 92–96 [DOI] [PubMed] [Google Scholar]
- 31.Gilchrist M., Thorsson V., Li B., Rust A. G., Korb M., Roach J. C., Kennedy K., Hai T., Bolouri H., Aderem A. (2006) Nature 441, 173–178 [DOI] [PubMed] [Google Scholar]
- 32.Rittirsch D., Flierl M. A., Ward P. A. (2008) Nat. Rev. Immunol. 8, 776–787 [DOI] [PMC free article] [PubMed] [Google Scholar]
- 33.Scott M. G., Dullaghan E., Mookherjee N., Glavas N., Waldbrook M., Thompson A., Wang A., Lee K., Doria S., Hamill P., Yu J. J., Li Y., Donini O., Guarna M. M., Finlay B. B., North J. R., Hancock R. E. W. (2007) Nat. Biotechnol. 25, 465–472 [DOI] [PubMed] [Google Scholar]
- 34.Perkins N. D. (2007) Nat. Rev. Mol. Cell Biol. 8, 49–62 [DOI] [PubMed] [Google Scholar]
- 35.Jeon Y. J., Han S. H., Lee Y. W., Lee M., Yang K. H., Kim H. M. (2000) Immunopharmacology 48, 173–183 [DOI] [PubMed] [Google Scholar]
- 36.Ghosh S., May M. J., Kopp E. B. (1998) Annu. Rev. Immunol. 16, 225–260 [DOI] [PubMed] [Google Scholar]
- 37.Ryseck R. P., Bull P., Takamiya M., Bours V., Siebenlist U., Dobrzanski P., Bravo R. (1992) Mol. Cell. Biol. 12, 674–684 [DOI] [PMC free article] [PubMed] [Google Scholar]
- 38.Kim T., Yoon J., Cho H., Lee W. B., Kim J., Song Y. H., Kim S. N., Yoon J. H., Kim-Ha J., Kim Y. J. (2005) Nat. Immunol. 6, 211–218 [DOI] [PubMed] [Google Scholar]
- 39.Koide M., Kawahara Y., Nakayama I., Tsuda T., Yokoyama M. (1993) J. Biol. Chem. 268, 24959–24966 [PubMed] [Google Scholar]
- 40.Chen C. C., Wang J. K. (1999) Mol. Pharmacol. 55, 481–488 [PubMed] [Google Scholar]
- 41.Fournier T., Riches D. W., Winston B. W., Rose D. M., Young S. K., Noble P. W., Lake F. R., Henson P. M. (1995) J. Immunol. 155, 2123–2133 [PubMed] [Google Scholar]
- 42.De Domenico I., Nemeth E., Nelson J. M., Phillips J. D., Ajioka R. S., Kay M. S., Kushner J. P., Ganz T., Ward D. M., Kaplan J. (2008) Cell Metab. 8, 146–156 [DOI] [PMC free article] [PubMed] [Google Scholar] [Retracted]
- 43.Chandrasekharan N. V., Simmons D. L. (2004) Genome Biol. 5, 241.1–241.7 [DOI] [PMC free article] [PubMed] [Google Scholar]
- 44.Hsieh J. C., Pan C. Y., Chen J. Y. (2010) Fish Shellfish Immunol. 29, 430–439 [DOI] [PubMed] [Google Scholar]
Associated Data
This section collects any data citations, data availability statements, or supplementary materials included in this article.


