

Abstract
Aims/hypothesis
Prolonged exposure of pancreatic beta cells to excessive levels of glucose and fatty acids, referred to as glucolipotoxicity, is postulated to contribute to impaired glucose homeostasis in patients with type 2 diabetes. However, the relative contribution of defective beta cell function vs diminished beta cell mass under glucolipotoxic conditions in vivo remains a subject of debate. We therefore sought to determine whether glucolipotoxicity in rats is due to impaired beta cell function and/or reduced beta cell mass, and whether older animals are more susceptible to glucolipotoxic condition.
Methods
Wistar rats (2 and 6 months old) received a 72 h infusion of glucose + intravenous fat emulsion or saline control. In vivo insulin secretion and sensitivity were assessed by hyperglycaemic clamps. Ex vivo insulin secretion, insulin biosynthesis and gene expression were measured in isolated islets. Beta cell mass and proliferation were examined by immunohistochemistry.
Results
A 72 h infusion of glucose + intravenous fat emulsion in 2-month-old Wistar rats did not affect insulin sensitivity, insulin secretion or beta cell mass. In 6-month-old rats by contrast it led to insulin resistance and reduced insulin secretion in vivo, despite an increase in beta cell mass and proliferation. This was associated with: (1) diminished glucose-stimulated second-phase insulin secretion and proinsulin biosynthesis; (2) lower insulin content; and (3) reduced expression of beta cell genes in isolated islets.
Conclusions/interpretation
In this in vivo model, glucolipotoxicity is characterised by an age-dependent impairment of glucose-regulated beta cell function despite a marked increase in beta cell mass.
Keywords: Ageing, Biosynthesis, Gene expression, Glucose clamp, Hyperglycaemia, Hyperlipidaemia, Insulin, Islets of Langerhans
Introduction
Type 2 diabetes occurs in genetically predisposed individuals when pancreatic beta cells fail to compensate for peripheral insulin resistance [1]. Chronic hyperglycaemia [2], hyperlipidaemia [3] and a combination of both [4] have been proposed to contribute to beta cell failure. Specifically, the glucolipotoxicity hypothesis posits that chronically elevated levels of glucose and fatty acids synergistically contribute to beta cell dysfunction in type 2 diabetes [4, 5].
The mechanisms by which glucolipotoxicity impairs beta cell function in vivo remain poorly understood. While experiments performed in the Zucker diabetic fatty rat were instrumental in identifying some cellular mechanisms of glucolipotoxicity [3], the profound alterations in intracellular fatty acid metabolism resulting from disrupted leptin signalling in this model limit the relevance of these findings to the human condition. In non-genetic rodent models, prolonged elevations of circulating fatty acid levels generally lead to decreased insulin secretion in vivo [6-8] and ex vivo [8, 9], although conflicting results have been reported [10, 11]. Using alternate and cyclical infusions of glucose and intravenous fat emulsion (IF) over 72 h in 2-month-old Wistar rats, we previously observed reduced insulin gene expression and insulin content, whereas insulin secretion in hyperglycaemic clamps and in isolated islets remained unaltered [12]. We hypothesise that the inconsistent effect of fatty acids on insulin secretion in vivo are due to: (1) incomplete replication of glucolipotoxic conditions by infusing lipids without glucose; and (2) the use of young animals, which are capable of mounting an adequate compensatory response to the insulin-resistant state induced by lipid infusion. In humans, age is known to represent an independent risk factor for beta cell failure [13].
To our knowledge, the question of whether simultaneously elevated levels of glucose and fatty acids impair insulin secretion and/or lead to decreased beta cell mass in normal rats in vivo has not been examined. However, this is an issue that is key to our understanding of the pathogenesis of glucolipotoxicity. We therefore sought to address the following questions. First, does glucolipotoxicity occur in vivo in normal rats? Second, is glucolipotoxicity due to defective beta cell function, loss of beta cell mass or both? Third, is age a susceptibility factor in the development of glucolipotoxicity?
Methods
Animals, infusions and hyperglycaemic clamps
All procedures were in accordance with the National Institutes of Health Principles of Laboratory Animal Care and were approved by the Institutional Committee for the Protection of Animals at the Centre Hospitalier de l’Université de Montréal. Male Wistar rats weighing 250 to 300 g (~2 months old) and 500 to 600 g (~6 months old; Charles River, St Constant, QC, Canada) were housed under controlled temperature on a 12-h light–dark cycle with unrestricted access to water and standard laboratory chow. Animals underwent catheterisation of the jugular vein and carotid artery, as described [12] and were enabled to recover for 5 days (Electronic supplementary material [ESM] Fig. 1). The animals were randomised into two groups, receiving either 0.9% saline (vol./vol.; Baxter, Mississauga, ON, Canada) or 70% glucose (wt/wt; McKesson, Montreal, QC, Canada) plus 20% IF (vol./vol.) (Intralipid; Fresenius Kabi, Uppsala, Sweden) with 20 U/ml heparin (Sandoz, Boucherville, QC, Canada; glucose + IF). Infusion was performed using infusion pumps (Pump 33; Harvard Apparatus Canada, Saint Laurent, QC, Canada) with independent operation of two syringes simultaneously. Initial glucose infusion rates were 3.3 and 2.8 ml kg−1 h−1 for glucose in 2-and 6-month-old rats, respectively, and were adjusted to maintain blood glucose levels within the target range of 13.8 to 16.7 mmol/l throughout the 72 h infusion period. The infusion rate of IF + heparin was 1.7 ml kg−1 h−1 and remained unchanged throughout the infusion. The infusion rate in the saline group was matched to that of the glucose + IF group. A first group of rats was subjected to one-step hyperglycaemic clamps followed by an arginine bolus prior to and at the end of the 72 h infusion to measure insulin secretion in vivo, as previously described [12]. Briefly, a 50% dextrose (McKesson) solution was infused through the jugular vein to clamp plasma glucose at 13 to 14 mmol/l for 70 min and adjusted on the basis of instantaneous assessments using a glucose analyser (YSI Incorporated, Yellow Springs, OH, USA). A bolus of arginine (174 mg/kg) (Sandoz) was injected at 60 min. Plasma samples were collected from the carotid artery for insulin and C-peptide measurements at −30, 0, 5, 15, 30, 45, 60, 61 and 70 min. At the end of the post-infusion clamp the animals were killed and the pancreas removed for morphological analyses. The M/I index of insulin sensitivity was calculated by dividing the average glucose infusion rate during the second half of the glucose clamp (M expressed in μmol kg−1 min−1) by the average circulating insulin value (I expressed in pmol/l) during the same time period [7]. The disposition index (DI) of insulin secretion corrected for insulin sensitivity was calculated by multiplying the M/I index by the average circulating C-peptide (in nmol/l) during the second half of the clamp [7]. Insulin clearance was estimated by the C-peptide/insulin ratio [7].
Islet isolation and measurements of insulin secretion and proinsulin biosynthesis
In a second series of experiments, islets were isolated at the end of the infusion by collagenase digestion and dextran density gradient centrifugation as described [14]. For perifusion experiments, batches of 100 islets each were placed in Swinnex chambers (Millipore, Nepean, ON, Canada) and perifused for 60 min with KRB buffer containing 2.8 mmol/l glucose. The glucose concentration was increased to 16.7 mmol/l at time 0 for a total of 70 min. At 60 min, arginine-potentiation of glucose-induced insulin secretion was measured by adding 10 mmol/l arginine to the KRB for 10 min. At 70 min the glucose concentration of the KRB was decreased to 2.8 mmol/l. Samples were collected at 1 min intervals throughout the perifusion for insulin determination. Intracellular insulin was extracted with acidified ethanol at the end of the perifusion to measure insulin content. For measurements of proinsulin biosynthesis, isolated islets were recovered for 1 h at 11 mmol/l glucose, after which batches of 100 islets each were washed, transferred to KRB containing 2.8 mmol/l glucose and incubated for 90 min at 37°C. After centrifugation, islets were resuspended for 30 min at 37°C in KRB with 2.8 or 16.7 mmol/l glucose. The medium was then replaced with KRB containing 2.8 or 16.7 mmol/l glucose and 3.7×10⁶ Bq [3H]leucine (GE-Amersham Biosciences, Baie d’Urfé, QC, Canada), after which the islets were incubated for 30 min at 37°C. The islets were then washed three times with cold KRB and sonicated in 100 mmol/l HCl. The lysate was centrifuged at 17,100×g for 15 min and aliquots were precipitated with trichloroacetic acid for measurement of total protein synthesis. The remaining supernatant fraction was used for measurement of proinsulin biosynthesis by immunoprecipitation with anti-bovine insulin antisera (Millipore/Linco, Billerica, MA, USA) and alkaline urea-gel electrophoresis [15].
Analytical measurements
Plasma glucose and NEFA levels were assessed using a kit (NEFA C kit; Wako Chemical, Osaka, Japan). Insulin and C-peptide were assessed by radioimmunoassay (Linco Research, St Charles, MO, USA), and triacylglycerol by a kit (GPO Trinder kit; Sigma Aldrich, Saint Louis, MO, USA).
RT-PCR
Total RNA was extracted from aliquots of 150 islets each and RT-PCR was carried out as described [12] using primers listed in ESM Table 1. Results are expressed as the ratio of target mRNA to cyclophilin mRNA.
Table 1.
Functional variables during hyperglycaemic clamps in 2- and 6-month-old Wistar rats before or following 72 h infusions with saline or glucose and IF
| Variables | Pre-infusion | Post-infusion |
||||
|---|---|---|---|---|---|---|
| 2-month |
6-month |
|||||
| 2-month | 6-month | Saline | Glucose + IF | Saline | Glucose + IF | |
| GIR (μmol kg−1 min−1) | 346.4±10.5 | 277.3±12.0** | 377.5±13.9 | 329.0±11.8* | 274.5±28.9 | 241.4±22.3 |
| Plasma insulin (pmol/l) | 1,464.7±141.3 | 1,392.1±146.7 | 1,625.9±188.1 | 1,658.5±369.9 | 1,429.2±247.5 | 2,650.4±372.5* |
| M/I index (μmol kg−1 min−1×pmol/l) | 0.27±0.03 | 0.25±0.03 | 0.24±0.02 | 0.26±0.04 | 0.23±0.03 | 0.11±0.02* |
| Plasma C-peptide (pmol/l) | 4,178.4±278.2 | 4,654.4±420.4 | 3,143.4±153.4 | 3,322.3±277.5 | 4,462.7±531.9 | 5,603.6±554.5 |
| DI (C-peptide×M/I index) | 1.10±0.10 | 1.02±0.09 | 0.76±0.11 | 0.80±0.10 | 0.98±0.17 | 0.56±0.09* |
| C-peptide:insulin (molar ratio) | 3.19±0.23 | 3.63±0.25 | 2.03±0.29 | 2.42±0.30 | 4.03±0.98 | 2.28±0.24* |
Values are mean ± SEM for four to 16 rats in each group
p<0.05 vs respective saline;
p<0.01 vs 2-month-old
GIR, glucose infusion rate
Beta cell mass, proliferation and apoptosis
Pancreases were trimmed of fat, weighed, fixed in 4% buffered paraformaldehyde (wt/wt) and embedded in paraffin. Sections (5 μm) were mounted on glass slides for immunohistochemical and beta cell mass analyses after insulin immunostaining and haematoxylin counterstaining as described [16]. Beta cell proliferation was measured immunohistochemically by staining for the nuclear marker, Ki67, and for insulin as previously detailed [16], counting 1,000 to 1,500 islet beta cells per animal. For determination of apoptotic beta cells, a modified TUNEL staining protocol was used [16].
Expression of data and statistics
Data are expressed as mean ± SEM. Statistical analyses were performed using Student’s t test or ANOVA, followed by two-by-two comparisons using the Tukey–Kramer honestly significant difference test or Bonferroni post hoc adjustments, as appropriate. A value of p<0.05 was considered significant.
Results
Infusion of glucose + IF induces insulin resistance and impairs insulin secretion in vivo in 6-month-old Wistar rats
Prior to initiating the 72 h infusion, 2- and 6-month-old male Wistar rats were subjected to a one-step hyperglycaemic clamp, followed during the last 10 min of the clamp by a bolus of arginine (Fig. 1). Both the M/I index and DI were similar between 2- and 6-month-old rats (Table 1), indicating that insulin sensitivity and secretion were similar in both groups prior to the infusion.
Fig. 1.
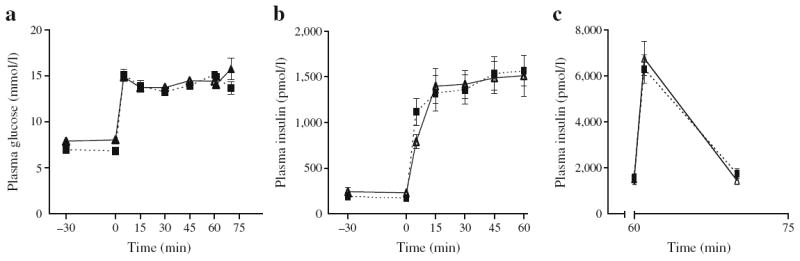
Insulin secretion in vivo under hyperglycaemic clamps prior to the 72 h infusions in 2- and 6-month-old Wistar rats. Plasma glucose levels (a), and plasma insulin levels during the glucose clamp (b) and after injection of an arginine bolus (c) in 2- (continuous lines, black triangles) and 6-month-old (dotted lines, black squares) rats. Data are mean ± SEM of 14 to 16 rats in each group
Rats from both age groups then received glucose + IF or saline infusions for 72 h. Glucose + IF infusions resulted in sustained elevation of plasma glucose and NEFA levels relative to saline-infused controls; these elevations were comparable in both age groups (Table 2). Energy intake, calculated by adding energy provided by the infusion (glucose + IF-infused group) to that provided by food intake, was not different between the two groups (data not shown). Circulating triacylglycerol levels were higher in saline-infused 6-month-old than in saline-infused 2-month-old rats, whereas the glucose + IF infusion in the 6-month-old group resulted in decreased triacylglycerol (presumably due to the co-infusion of heparin), although this did not reach significance (Table 2).
Table 2.
Metabolic variables and pancreatic weight of 2- and 6-month-old Wistar rats following 72 h infusions with saline or glucose + IF
| Variables | 2-month-old |
6-month-old |
||
|---|---|---|---|---|
| Saline | Glucose + IF | Saline | Glucose + IF | |
| Glucose (mmol/l) | 6.6±0.6 | 13.9±1.5** | 6.1±0.3 | 16.2±1.9** |
| Insulin (pmol/l) | 341±116.8 | 2900±738.2* | 181.2±60.2 | 2195±584.6** |
| NEFA (mmol/l) | 0.3±0.1 | 0.9±0.2* | 0.26±0.07 | 0.8±0.1** |
| Triacylglycerol (mmol/l) | 0.5±0.1 | 0.4±0.1 | 1.0±0.1*** | 0.6±0.1 |
| Pancreas weight (g) | 1.44±0.1 | 1.07±0.0* | 2.2±0.1 | 1.73±0.1** |
Values are mean ± SEM of four to nine rats in each group
p<0.05,
p<0.01 vs respective saline;
p<0.05 vs 2-month-old saline
In the 2-month-old group, glucose + IF infusions markedly increased circulating insulin levels (Table 2). Within 30 min post-infusion and before the hyperglycaemic clamp began, plasma insulin decreased but remained higher than in the saline-infused group (Fig. 2b). Plasma glucose and insulin levels during the subsequent hyperglycaemic clamp and in response to the arginine bolus at the end of the glucose clamp are shown in Fig. 2a–c. Insulin secretion curves were similar in the glucose + IF and saline groups, both during the glucose clamp (Fig. 2b) and in response to arginine (Fig. 2c). Plasma C-peptide levels, M/I index, DI and C-peptide/insulin ratio were similar in the glucose + IF- and saline-infused groups (Table 1). These data indicate that glucose + IF infusion did not significantly affect insulin sensitivity, insulin secretion or insulin clearance in 2-month-old rats.
Fig. 2.
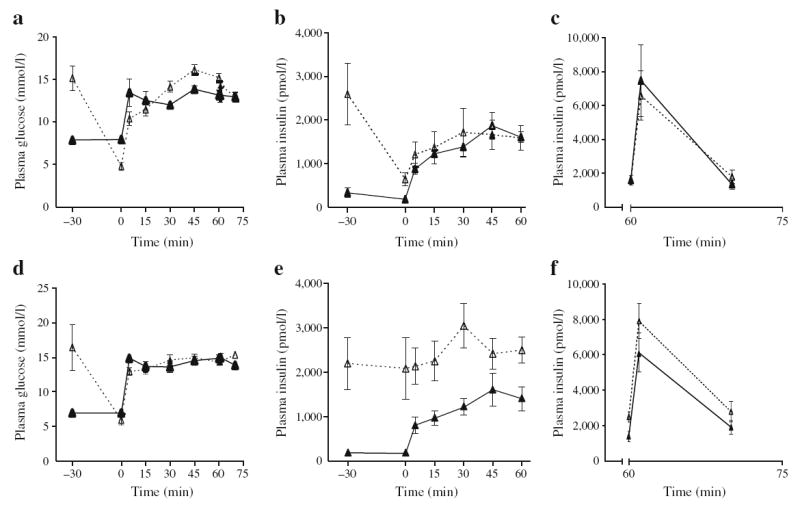
Insulin secretion in vivo under hyperglycaemic clamps following 72 h infusions with glucose and IF (dotted lines, white triangles) or saline (continuous lines, black triangles) in 2- (a–c) and 6-month-old (d–f) Wistar rats. Graphs show plasma glucose levels (a, d), and plasma insulin levels during the glucose clamp (b, e) and after injection of an arginine bolus (c, f). Data are mean ± SEM of four saline-infused and nine glucose + IF-infused 2-month-old rats, and of eight saline-infused and eight glucose + IF-infused 6-month-old rats
In the 6-month-old group, circulating insulin levels were elevated at the end of the glucose + IF infusion (Fig. 2e) and, in contrast to 2-month-old rats, did not decrease during the 30 min period post-infusion and before the clamp was initiated (Fig. 2e vs Fig. 2b), although glucose levels returned to basal values (Fig. 2d). Insulin levels remained elevated throughout the steady-state period of the clamp compared with the saline group (Table 1). Insulin secretion in response to glucose during the initial phase of the clamp was markedly lower than in the saline group (Fig. 2e). In contrast, arginine potentiation of glucose-induced insulin secretion was of a similar magnitude in glucose + IF- and saline-infused animals (Fig. 2f). Despite higher circulating insulin levels during the clamp, the glucose infusion rate was not different in the two infusion groups, such that the M/I index was significantly lower in the glucose + IF-infused animals, indicative of insulin resistance (Table 1). Plasma C-peptide levels were not elevated in the glucose + IF group during the clamp; as a result the DI was significantly lower (Table 1), suggesting impaired insulin secretion. In addition, the C-peptide/insulin ratio was significantly lower in the glucose + IF than in the saline group (Table 1), suggesting reduced insulin clearance. Taken together, these data indicate that glucose + IF infusions induced insulin resistance and impaired insulin clearance in 6-month-old rats, these changes being associated with hyperinsulinaemia, but defective glucosestimulated insulin release.
Infusion of glucose + IF in 6-month-old rats impairs second-phase insulin secretion in response to glucose, glucose-stimulated proinsulin biosynthesis and beta cell gene expression
To further characterise the insulin secretory defect observed in vivo in 6-month-old rats infused for 72 h with glucose + IF (Fig. 2e), islets were isolated at the end of the infusion and dynamic insulin secretion was assessed ex vivo by perifusion. In islets from saline-infused rats, we observed a rapid first phase of insulin secretion in response to glucose, lasting approximately 10 min, followed by a sustained second phase, as previously observed in rat islets (Fig. 3a; [17]). Arginine elicited a further increase in insulin release (Fig. 3b). Islets from glucose + IF-infused rats responded to the glucose challenge with a first-phase release of similar amplitude to that of saline-infused animals, but the amplitude of the second phase of insulin secretion was markedly diminished (Fig. 3b, c). Consistent with the hyperglycaemic clamp results (Fig. 2f), the incremental secretory response to arginine was not significantly different between islets from glucose + IF- and those from saline-infused animals (Fig. 3b, c).
Fig. 3.
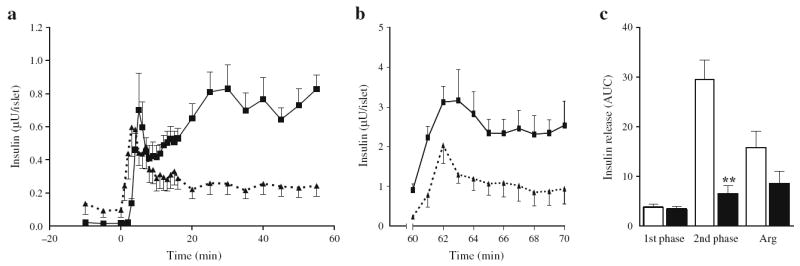
Insulin secretion ex vivo in perifused islets from 6-month-old Wistar rats following 72 h infusions with glucose + IF or saline. a Insulin secretion from islets isolated from glucose + IF- (dotted lines, black triangles) and saline-infused (continuous lines, black squares) animals in the presence of 2.8 (−10 to 0 min) and 16.7 mmol/l glucose (0 to 60 min). b Insulin secretion in response to 10 mmol/l arginine and 16.7 mmol/l glucose (60 to 70 min). c AUC for insulin secretion in islets from saline-infused (white bars) and glucose + IF-infused (black bars) animals during the first (0 to 10 min) and second (10 to 60 min) phase of insulin secretion in response to glucose, and in response to arginine (Arg) in the presence of 16.7 mmol/l glucose. Data are mean ± SEM of seven (a, c) and four (b) animals in each group. **p<0.01 vs respective saline group
Intracellular insulin content was markedly lower in islets from glucose + IF-infused animals (Fig. 4a). To examine whether this was due to impaired glucose-regulated proinsulin biosynthesis, islets isolated from 6-month-old rats were subjected to metabolic pulse-radiolabelling using [3H]leucine as a tracer in the presence of 2.8 or 16.7 mmol/l glucose. In islets from saline-infused animals, an increase in [3H]leucine incorporation into immunoprecipitated proinsulin was observed in response to glucose (Fig. 4b). This increase was no longer significant in islets from glucose + IF-infused animals. In contrast, incorporation of the tracer into total proteins was significantly increased by glucose in both groups, although the magnitude of this increase was greater in islets from glucose + IF-infused rats (Fig. 4c). To correct for the effect of glucose on global protein synthesis, proinsulin biosynthesis was normalised by total protein biosynthesis. Normalised proinsulin biosynthesis was significantly increased in response to glucose in islets from saline-infused rats, but not in the glucose + IF-infused group (Fig. 4d).
Fig. 4.
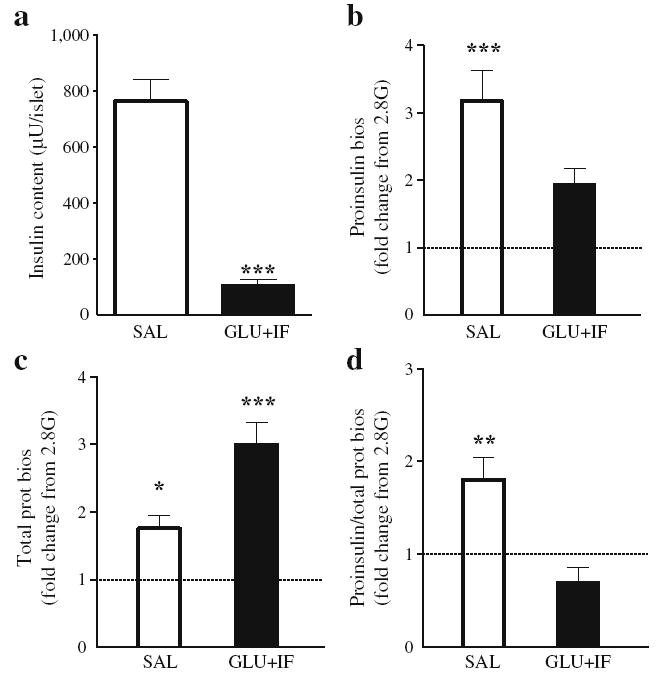
Insulin content and proinsulin biosynthesis in islets from 6-month-oldWistar rats following 72 h infusions with glucose (GLU) + IF or saline (SAL). a Islet insulin content measured at the end of the perifusion (n=9). b–d Islets were incubated in the presence of [3H] leucine and 2.8 or 16.7 mmol/l glucose for 30 min. Data are expressed as fold changes from the 2.8 mmol/l glucose condition (2.8G, n=4). b Incorporation of the tracer into immunoprecipitated proinsulin, (c) into total proteins and (d) into immunoprecipitated proinsulin normalised by the incorporation into total proteins. *p<0.05, **p< 0.01, ***p<0.001 vs saline group. prot bios, protein biosynthesis
Using a regimen consisting of alternate infusions of glucose and IF in 2-month-old rats, we had previously observed that insulin mRNA expression decreased prior to any change in insulin secretion [12]. To examine insulin gene expression in the present model, we measured mature mRNA and pre-mRNA for insulin in islets from glucose + IF- and saline-infused 6-month-old rats (Fig. 5a). Consistent with our previous observations [12], both mature and pre-mRNAs for insulin were significantly reduced in islets from glucose + IF-infused 6-month-old rats. In addition, expression of pancreas-duodenum homeobox-1 (Pdx1), its target genes Glut2 (also known as Slc2a2) and glucokinase [18], and its upstream regulator early growth response-1 was significantly reduced, as was expression of specific beta cell genes such as the transcription factor Mafa and the fatty-acid receptor Gpr40 (also known as Ffar1). Expression of the insulin- and insulin-like growth factor-1-receptors was also reduced. Finally, expression of (1) PAS kinase, which we recently showed to be implicated in the signalling mechanisms of glucolipotoxicity in isolated islets [19], and (2) C/ebpβ (also known as Cebpb), a transcription factor implicated in glucose toxicity [20], was significantly reduced in islets from glucose + IF-infused rats. No significant changes were detected in expression of: (1) the cell-cycle regulators cyclin D1, D2 or D3; (2) the cyclin-dependent kinase inhibitor p16 (also known as Cdkn2a); or (3) the markers of pancreatic endocrine progenitors Hes1 and Sox9 (Fig. 5b).
Fig. 5.
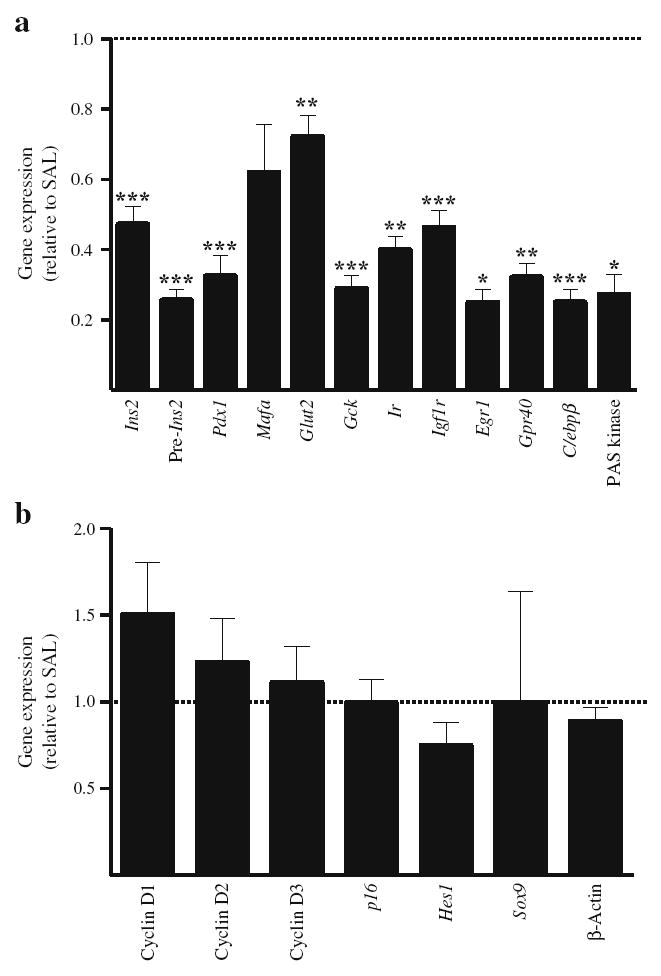
Gene expression in islets after 72 h infusions with glucose + IF or saline (SAL) in 6-month-old Wistar rats. mRNA levels for beta cell-specific genes (a) and cell cycle-related genes (b) were measured by RT-PCR and normalised to cyclophilin mRNA levels. Results are expressed as fold increase of the ratio of gene/cyclophilin mRNA in glucose + IF group (black bars) over the corresponding saline control value (dotted line), and are mean ± SEM of 6 to 13 animals. *p<0.05, **p<0.01, ***p<0.001 vs saline group
Infusion of glucose + IF increases pancreatic beta cell mass and beta cell proliferation in 6-month-old rats
To investigate whether the insulin secretory defect observed in glucose + IF-infused 6-month-old rats was associated with changes in islet mass, we measured beta cell mass by morphometric analysis of pancreatic sections removed at the end of infusion (Fig. 6). In 2-month-old rats, the glucose + IF infusion did not affect beta cell mass (Fig. 6a) or islet size distribution (Fig. 6b). In contrast, in 6-month-old rats, glucose + IF infusions increased beta cell mass by almost two fold as compared with the saline group (Fig. 6a). This was associated with an overall increase in the number of beta cell clusters in all size classes (Fig. 6c). Beta cells positive for the proliferation marker Ki67 were readily detected in islets from glucose + IF-infused 6-month-old rats (Fig. 6e, f), but were rare in saline-infused islets (Fig. 6d, f). No significant effect of the infusion regiment on the percentage of Ki67-positive cells in 2-month-old rats was observed (Fig. 6f). Pancreatic weight was reduced by ~25% after glucose + IF infusion in both age groups (Table 2). TUNEL-positive beta cells were extremely rare in islets from either group (data not shown).
Fig. 6.
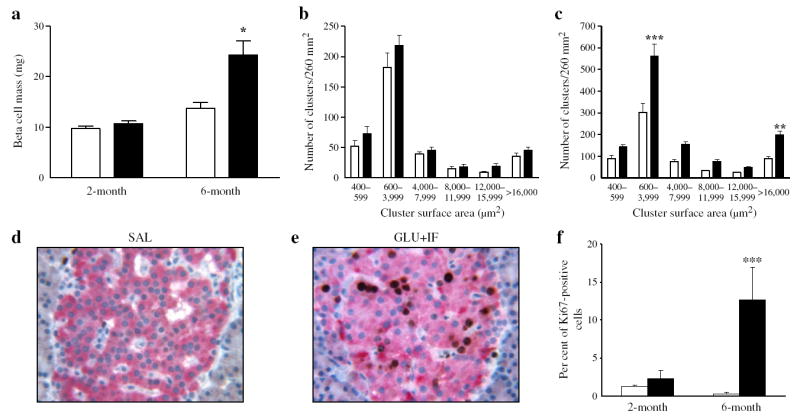
Beta cell mass and proliferation following 72 h infusions with glucose + IF (black bars) or saline (white bars) in 2- and 6-month-old Wistar rats. Beta cell mass (a) and size cluster distribution of islets (b, c) in 2-month-old (a, b) and 6-month-old (a, c) rats. d Representative image of Ki67 staining in pancreatic sections from 6-month-old rats after saline or (e) glucose + IF infusion. f Percentage of Ki67-positive cells out of ~1,000 cells examined for each group as indicated. Data are expressed as mean ± SEM of four animals in each group. *p<0.05, **p<0.01, ***p<0.001 vs respective saline group
Discussion
This study aimed to ascertain whether glucolipotoxicity in vivo in rats is due to a genuine defect in beta cell function, a loss of beta cell mass or both, and whether it is more pronounced in older animals. We report that continuous and combined infusions of glucose and IF for 72 h caused insulin resistance and impaired beta cell function, despite a marked increase in beta cell mass in 6-, but not in 2-month-old Wistar rats. The functional defect observed under these glucolipotoxic conditions involves coordinated inhibition of glucose-induced insulin secretion, proinsulin biosynthesis and insulin gene expression.
We have previously reported that 72 h of cyclical and alternating infusions of glucose and IF did not impair insulin secretion in 2-month-old Wistar rats [12]. Our current results show that infusing the same overall amount of glucose and IF in a simultaneous and continuous fashion also failed to impair insulin secretion in young animals. Overall, these findings indicate that young Wistar rats are resistant to glucolipotoxicity, irrespective of the pattern of administration. These findings contrast with previous reports using glucose [11, 21-25] or IF [6, 7, 9-11], which showed enhanced [10, 11, 24, 25] or reduced [6, 7, 9, 21, 23] insulin secretion. We hypothesise that the lack of inhibition of insulin secretion by IF in young rats in this study, even in the concomitant presence of elevated glucose, is due to differences in strain, sex, age or infusion rates, as suggested by several studies [6, 7, 11].
Ageing is an independent risk factor for beta cell failure in humans [13], but the mechanisms by which age-related changes limit the beta cell’s ability to mount a compensatory response remain to be identified. In contrast to the lack of effect of the glucose + IF infusion in young rats, 6-month-old Wistar rats infused with glucose + IF exhibited reduced glucose-induced insulin secretion in vivo in hyperglycaemic clamps and ex vivo in perifused islets. The lack of susceptibility of young rats to glucolipotoxic conditions suggests that investigations pertaining to beta cell failure in rodents should be conducted in older animals, which more closely resemble the typical setting of type 2 diabetes in humans. Most studies examining the effects of prolonged fatty acid exposure on insulin secretion in humans have shown that in young, healthy individuals, infusion of fatty acids induces an adequate compensatory increase in insulin secretion [26-28], whereas this response is impaired in individuals who are obese [29] or have a family history of type 2 diabetes [28].
There are interesting similarities between the results of the present study and those of previous reports in humans. First, as observed here, impairment of insulin secretion resulting from prolonged lipid infusions in humans is specific to the response to glucose, as the response to arginine remains relatively normal [30]. Second, the increase in DI observed in non-diabetic participants in response to a 24 h glucose infusion did not occur if lipids were infused simultaneously with glucose [31]. Third, a recent study by Carpentier et al. [32] demonstrates a strong association between fasting plasma glucose and the susceptibility to lipid-induced beta cell dysfunction in humans. Therefore, the rat infusion protocol used in this study appears to represent a valuable model for studying the mechanisms of glucolipotoxicity, because it reproduces important features of this phenomenon in humans, i.e. a lack of detrimental effects in young, healthy individuals, but a decrease in DI in response to concomitant elevations of glucose and fatty acid levels in individuals susceptible to the effects of glucolipotoxicity because of age, genetic predisposition or pre-existing beta cell defects. It is important to note that the term glucolipotoxicity is used here in its broader sense, i.e. to describe the deleterious effects of simultaneously elevated glucose and fatty acids on beta cell function or mass. In fact, the functional defects in our model were not associated with significant cell death, which contrasts with previous in vitro studies [33-38]. These differences may be due, in part, to the fact that the IF used (Intralipid) mainly contains unsaturated fatty acids, which have been shown to be protective against saturated fatty acid-induced apoptosis [33, 36].
To our knowledge, our results provide for the first time evidence that glucolipotoxicity in vivo affects three major aspects of glucose-regulated beta cell function, i.e. insulin gene expression, proinsulin biosynthesis and insulin secretion. The observed decrease in insulin gene expression in glucose + IF-infused 6-month-old rats is consistent with our previous observations using alternate infusions [12] and confirms our previous in vitro findings [39-42] that glucolipotoxicity affects the insulin gene. In addition, our results show that glucose + IF infusion in 6-month-old rats impairs the ability of glucose to stimulate proinsulin biosynthesis, resulting in a marked decrease in insulin content. These observations are consistent with the inhibitory effect of oleate on proinsulin biosynthesis in isolated islets [15]. It is important to acknowledge that these results do not necessarily indicate a defect in translation as such, but rather an altered response to the glucose signal. Because insulin secretion to a combined stimulation with arginine and glucose is considered in humans to be a measure of the total beta cell secretory reserve [43], the unaltered response to the arginine bolus at the end of the glucose clamp in glucose + IF-infused 6-month-old rats suggests that, despite a considerable reduction in insulin stores, the total secretory capacity remained intact in these animals.
Beta cell dysfunction in glucose + IF-infused 6-month-old rats occurred despite a doubling of beta cell mass. This was associated with a high percentage of proliferating beta cells in the absence of detectable apoptosis. Thus, the reported reduced beta cell proliferative capacity in older rodents [44, 45] does not appear to have played a role in this setting. Strikingly, however, the marked increase in beta cell mass was insufficient to provide adequate functional compensation. There are several examples in the literature of an apparent disconnect between increased beta cell mass and impaired beta cell function [22, 46, 47], and our observations further emphasise the concept that functional, rather than anatomical mass, is the physiologically relevant variable for insulin secretion [47]. It is tempting to speculate that the rapid expansion in beta cell mass following experimental ablation [46, 48] or in response to increased metabolic demand (this study) produces functionally immature beta cells. This possibility is supported by the decreased expression of beta cell-specific genes (e.g. insulin, Pdx1, Glut2, glucokinase, Gpr40). Interestingly, similar decreases in expression of beta cell genes were observed in islets from Zucker fatty rats subjected to a 60% pancreatectomy [48]. The marked increase in beta cell proliferation in the face of Pdx1 deficiency seems contradictory to previous studies showing the role of pancreas-duodenum homeobox-1 in beta cell replication [49], but is consistent with a recent report demonstrating that Pdx1 haploinsufficiency does not affect the beta cell proliferative capacity [50].
In conclusion, beta cell dysfunction in this model of glucolipotoxicity is characterised by a coordinated decrease in insulin gene expression and glucose-regulated proinsulin biosynthesis, leading to a dramatic reduction in insulin stores and a specific loss of second-phase insulin secretion in response to glucose, despite a marked increase in beta cell proliferation andmass, which occurs only in older animals. Our data support the notion that glucolipotoxicity, as defined by chronic excess of circulating glucose and fatty acids, can lead to functional beta cell failure in vivo without detectable cytotoxicity, providing an example of dysfunctional beta cell mass.
Supplementary Material
Acknowledgments
These studies were supported by: (1) the U.S. National Institutes of Health (R01DK58096 toV. Poitout; R01DK068329 to T. L. Jetton; R01DK50610 to C. J. Rhodes; and Ruth L. Kirschstein National Research Service Award to D. K. Hagman); (2) the Canadian Institutes of Health Research (MOP 77686 to V. Poitout andMOP 12653 to M. Prentki); and (3) the Canadian Diabetes Association (post-doctoral fellowship to G. Fontés and operating grant toM. Prentki). B. Zarrouki is supported by the Montreal Diabetes Research Center/Merck Frosst postdoctoral fellowship. V. Poitout holds the Canada Research Chair in Diabetes and Pancreatic Beta cell Function. M. Prentki holds the Canada Research Chair in Diabetes and Metabolism. We are grateful to G. Fergusson and M. Éthier (CRCHUM), and K. Herzer and J. Lausier (University of Vermont) for valuable technical assistance, and to S. Bonner-Weir (Joslin Diabetes Center) and É. Joly (CRCHUM) for fruitful discussions.
Abbreviations
- DI
Disposition index
- IF
Intravenous fat emulsion
Footnotes
Electronic supplementary material The online version of this article (doi:10.1007/s00125-010-1850-5) contains supplementary material, which is available to authorised users.
Duality of interest The authors declare that there is no duality of interest associated with this manuscript.
Contributor Information
G. Fontés, Montreal Diabetes Research Center, University of Montreal, Montreal, QC, Canada CRCHUM–Technopole Angus, 2901 Rachel Est, Montréal, QC, Canada H1W 4A4; Department of Medicine, University of Montreal, Montreal, QC, Canada.
B. Zarrouki, Montreal Diabetes Research Center, University of Montreal, Montreal, QC, Canada CRCHUM–Technopole Angus, 2901 Rachel Est, Montréal, QC, Canada H1W 4A4; Department of Medicine, University of Montreal, Montreal, QC, Canada.
D. K. Hagman, Montreal Diabetes Research Center, University of Montreal, Montreal, QC, Canada CRCHUM–Technopole Angus, 2901 Rachel Est, Montréal, QC, Canada H1W 4A4; Department of Medicine, University of Montreal, Montreal, QC, Canada.
M. G. Latour, Montreal Diabetes Research Center, University of Montreal, Montreal, QC, Canada CRCHUM–Technopole Angus, 2901 Rachel Est, Montréal, QC, Canada H1W 4A4.
M. Semache, Montreal Diabetes Research Center, University of Montreal, Montreal, QC, Canada CRCHUM–Technopole Angus, 2901 Rachel Est, Montréal, QC, Canada H1W 4A4; Department of Biochemistry, University of Montreal, Montreal, QC, Canada.
V. Roskens, Division of Endocrinology, Diabetes and Metabolism, University of Vermont College of Medicine, Burlington, VT, USA
P. C. Moore, Kovler Diabetes Center, University of Chicago, Chicago, IL, USA
M. Prentki, Montreal Diabetes Research Center, University of Montreal, Montreal, QC, Canada CRCHUM–Technopole Angus, 2901 Rachel Est, Montréal, QC, Canada H1W 4A4; Department of Nutrition, University of Montreal, Montreal, QC, Canada; Department of Biochemistry, University of Montreal, Montreal, QC, Canada.
C. J. Rhodes, Kovler Diabetes Center, University of Chicago, Chicago, IL, USA
T. L. Jetton, Division of Endocrinology, Diabetes and Metabolism, University of Vermont College of Medicine, Burlington, VT, USA
V. Poitout, Montreal Diabetes Research Center, University of Montreal, Montreal, QC, Canada CRCHUM–Technopole Angus, 2901 Rachel Est, Montréal, QC, Canada H1W 4A4, vincent.poitout@umontreal.ca; Department of Medicine, University of Montreal, Montreal, QC, Canada; Department of Nutrition, University of Montreal, Montreal, QC, Canada; Department of Biochemistry, University of Montreal, Montreal, QC, Canada.
References
- 1.Prentki M, Nolan CJ. Islet beta cell failure in type 2 diabetes. J Clin Invest. 2006;116:1802–1812. doi: 10.1172/JCI29103. [DOI] [PMC free article] [PubMed] [Google Scholar]
- 2.Robertson RP. Chronic oxidative stress as a central mechanism for glucose toxicity in pancreatic islet beta cells in diabetes. J Biol Chem. 2004;279:42351–42354. doi: 10.1074/jbc.R400019200. [DOI] [PubMed] [Google Scholar]
- 3.Unger RH. Lipotoxicity in the pathogenesis of obesity-dependent NIDDM. Genetic and clinical implications. Diabetes. 1995;44:863–870. doi: 10.2337/diab.44.8.863. [DOI] [PubMed] [Google Scholar]
- 4.Prentki M, Corkey BE. Are the ß-cell signaling molecules malonyl-CoA and cytosolic long-chain acyl-CoA implicated in multiple tissue defects of obesity and NIDDM? Diabetes. 1996;45:273–283. doi: 10.2337/diab.45.3.273. [DOI] [PubMed] [Google Scholar]
- 5.Poitout V, Robertson RP. Minireview: secondary beta-cell failure in type 2 diabetes—a convergence of glucotoxicity and lipotoxicity. Endocrinology. 2002;143:339–342. doi: 10.1210/endo.143.2.8623. [DOI] [PubMed] [Google Scholar]
- 6.Mason TM, Goh T, Tchipashvili V, et al. Prolonged elevation of plasma free fatty acids desensitizes the insulin secretory response to glucose in vivo in rats. Diabetes. 1999;48:524–530. doi: 10.2337/diabetes.48.3.524. [DOI] [PubMed] [Google Scholar]
- 7.Goh TT, Mason TM, Gupta N, et al. Lipid-induced beta-cell dysfunction in vivo in models of progressive beta-cell failure. Am J Physiol Endocrinol Metab. 2007;292:E549–E560. doi: 10.1152/ajpendo.00255.2006. [DOI] [PubMed] [Google Scholar]
- 8.Oprescu AI, Bikopoulos G, Naassan A, et al. Free fatty acid-induced reduction in glucose-stimulated insulin secretion: evidence for a role of oxidative stress in vitro and in vivo. Diabetes. 2007;56:2927–2937. doi: 10.2337/db07-0075. [DOI] [PubMed] [Google Scholar]
- 9.Sako Y, Grill VE. A 48-hour lipid infusion in the rat time-dependently inhibits glucose-induced insulin secretion and ß-cell oxidation through a process likely coupled to fatty acid oxidation. Endocrinology. 1990;127:1580–1589. doi: 10.1210/endo-127-4-1580. [DOI] [PubMed] [Google Scholar]
- 10.Magnan C, Collins S, Berthault MF, et al. Lipid infusion lowers sympathetic nervous activity and leads to increased beta-cell responsiveness to glucose. J Clin Invest. 1999;103:413–419. doi: 10.1172/JCI3883. [DOI] [PMC free article] [PubMed] [Google Scholar]
- 11.Steil GM, Trivedi N, Jonas JC, et al. Adaptation of beta-cell mass to substrate oversupply: enhanced function with normal gene expression. Am J Physiol Endocrinol Metab. 2001;280:E788–E796. doi: 10.1152/ajpendo.2001.280.5.E788. [DOI] [PubMed] [Google Scholar]
- 12.Hagman DK, Latour MG, Chakrabarti SK, et al. Cyclical and alternating infusions of glucose and intralipid in rats inhibit insulin gene expression and Pdx-1 binding in islets. Diabetes. 2008;57:424–431. doi: 10.2337/db07-1285. [DOI] [PMC free article] [PubMed] [Google Scholar]
- 13.Utzschneider KM, Carr DB, Hull RL, et al. Impact of intra-abdominal fat and age on insulin sensitivity and ß-cell function. Diabetes. 2004;53:2867–2872. doi: 10.2337/diabetes.53.11.2867. [DOI] [PubMed] [Google Scholar]
- 14.Kelpe CL, Johnson LM, Poitout V. Increasing triglyceride synthesis inhibits glucose-induced insulin secretion in isolated rat islets of Langerhans. A study using adenoviral expression of diacylglycerol acyltransferase. Endocrinology. 2002;143:3326–3332. doi: 10.1210/en.2002-220402. [DOI] [PubMed] [Google Scholar]
- 15.Bollheimer LC, Skelly RH, Chester MW, McGarry JD, Rhodes CJ. Chronic exposure to free fatty acid reduces pancreatic beta cell insulin content by increasing basal insulin secretion that is not compensated for by a corresponding increase in proinsulin biosynthesis translation. J Clin Invest. 1998;101:1094–1101. doi: 10.1172/JCI420. [DOI] [PMC free article] [PubMed] [Google Scholar]
- 16.Jetton TL, Lausier J, LaRock K, et al. Mechanisms of compensatory beta-cell growth in insulin-resistant rats: roles of Akt kinase. Diabetes. 2005;54:2294–2304. doi: 10.2337/diabetes.54.8.2294. [DOI] [PubMed] [Google Scholar]
- 17.Zawalich WS, Yamazaki H, Zawalich KC. Biphasic insulin secretion from freshly isolated or cultured, perifused rodent islets: comparative studies with rats and mice. Metabolism. 2008;57:30–39. doi: 10.1016/j.metabol.2007.07.020. [DOI] [PMC free article] [PubMed] [Google Scholar]
- 18.Lottmann H, Vanselow J, Hessabi B, Walther R. The Tet-On system in transgenic mice: inhibition of the mouse pdx-1 gene activity by antisense RNA expression in pancreatic beta-cells. J Mol Med. 2001;79:321–328. doi: 10.1007/s001090100229. [DOI] [PubMed] [Google Scholar]
- 19.Fontes G, Semache M, Hagman DK, et al. Involvement of Per-Arnt-Sim kinase and extracellular-regulated kinases-1/2 in palmitate inhibition of insulin gene expression in pancreatic beta-cells. Diabetes. 2009;58:2048–2058. doi: 10.2337/db08-0579. [DOI] [PMC free article] [PubMed] [Google Scholar]
- 20.Lawrence MC, McGlynn K, Park BH, Cobb MH. ERK1/2-dependent activation of transcription factors required for acute and chronic effects of glucose on the insulin gene promoter. J Biol Chem. 2005;280:26751–26759. doi: 10.1074/jbc.M503158200. [DOI] [PubMed] [Google Scholar]
- 21.Sako Y, Grill VE. Coupling of ß-cell desensitization by hyperglycemia to excessive stimulation and circulating insulin in glucose-infused rats. Diabetes. 1990;39:1580–1583. doi: 10.2337/diab.39.12.1580. [DOI] [PubMed] [Google Scholar]
- 22.Bernard C, Thibault C, Berthault MF, et al. Pancreatic betacell regeneration after 48-h glucose infusion in mildly diabetic rats is not correlated with functional improvement. Diabetes. 1998;47:1058–1065. doi: 10.2337/diabetes.47.7.1058. [DOI] [PubMed] [Google Scholar]
- 23.de Souza CJ, Capotorto JV, Cornell-Kennon S, et al. Beta-cell dysfunction in 48-hour glucose-infused rats is not a consequence of elevated plasma lipid or islet triglyceride levels. Metabolism. 2000;49:755–759. doi: 10.1053/meta.2000.6240. [DOI] [PubMed] [Google Scholar]
- 24.Paris M, Bernard-Kargar C, Berthault MF, Bouwens L, Ktorza A. Specific and combined effects of insulin and glucose on functional pancreatic beta-cell mass in vivo in adult rats. Endocrinology. 2003;144:2717–2727. doi: 10.1210/en.2002-221112. [DOI] [PubMed] [Google Scholar]
- 25.Topp BG, McArthur MD, Finegood DT. Metabolic adaptations to chronic glucose infusion in rats. Diabetologia. 2004;47:1602–1610. doi: 10.1007/s00125-004-1493-5. [DOI] [PubMed] [Google Scholar]
- 26.Boden G, Chen X, Rosner J, Barton M. Effects of a 48 h fat infusion on insulin secretion and glucose utilization. Diabetes. 1995;44:1239–1242. doi: 10.2337/diab.44.10.1239. [DOI] [PubMed] [Google Scholar]
- 27.Jensen CB, Storgaard H, Holst JJ, Dela F, Madsbad S, Vaag AA. Insulin secretion and cellular glucose metabolism after prolonged low-grade intralipid infusion in young men. J Clin Endocrinol Metab. 2003;88:2775–2783. doi: 10.1210/jc.2002-021430. [DOI] [PubMed] [Google Scholar]
- 28.Kashyap S, Belfort R, Gastaldelli A, et al. A sustained increase in plasma free fatty acids impairs insulin secretion in nondiabetic subjects genetically predisposed to develop type 2 diabetes. Diabetes. 2003;52:2461–2474. doi: 10.2337/diabetes.52.10.2461. [DOI] [PubMed] [Google Scholar]
- 29.Carpentier A, Mittelman SD, Bergman RN, Giacca A, Lewis GF. Prolonged elevation of plasma free fatty acids impairs pancreatic beta-cell function in obese nondiabetic humans but not in individuals with type 2 diabetes. Diabetes. 2000;49:399–408. doi: 10.2337/diabetes.49.3.399. [DOI] [PubMed] [Google Scholar]
- 30.Carpentier A, Giacca A, Lewis GF. Effect of increased plasma non-esterified fatty acids (NEFAs) on arginine-stimulated insulin secretion in obese humans. Diabetologia. 2001;44:1989–1997. doi: 10.1007/s001250100002. [DOI] [PubMed] [Google Scholar]
- 31.Leung N, Sakaue T, Carpentier A, Uffelman K, Giacca A, Lewis GF. Prolonged increase of plasma non-esterified fatty acids fully abolishes the stimulatory effect of 24 hours of moderate hyperglycaemia on insulin sensitivity and pancreatic beta-cell function in obese men. Diabetologia. 2004;47:204–213. doi: 10.1007/s00125-003-1301-7. [DOI] [PubMed] [Google Scholar]
- 32.Carpentier AC, Bourbonnais A, Frisch F, Giacca A, Lewis GF. Plasma nonesterified fatty acid intolerance and hyperglycemia are associated with intravenous lipid-induced impairment of insulin sensitivity and disposition index. J Clin Endocrinol Metab. 2010;95:1256–1264. doi: 10.1210/jc.2009-1932. [DOI] [PubMed] [Google Scholar]
- 33.Maedler K, Spinas GA, Dyntar D, Moritz W, Kaiser N, Donath MY. Distinct effects of saturated and monounsaturated fatty acids on beta-cell turnover and function. Diabetes. 2001;50:69–76. doi: 10.2337/diabetes.50.1.69. [DOI] [PubMed] [Google Scholar]
- 34.Lupi R, Dotta F, Marselli L, et al. Prolonged exposure to free fatty acids has cytostatic and pro-apoptotic effects on human pancreatic islets: evidence that beta-cell death is caspase mediated, partially dependent on ceramide pathway, and Bcl-2 regulated. Diabetes. 2002;51:1437–1442. doi: 10.2337/diabetes.51.5.1437. [DOI] [PubMed] [Google Scholar]
- 35.Piro S, Anello M, Di Pietro C, et al. Chronic exposure to free fatty acids or high glucose induces apoptosis in rat pancreatic islets: possible role of oxidative stress. Metabolism. 2002;51:1340–1347. doi: 10.1053/meta.2002.35200. [DOI] [PubMed] [Google Scholar]
- 36.El-Assaad W, Buteau J, Peyot ML, et al. Saturated fatty acids synergize with elevated glucose to cause pancreatic beta-cell death. Endocrinology. 2003;144:4154–4163. doi: 10.1210/en.2003-0410. [DOI] [PubMed] [Google Scholar]
- 37.Kharroubi I, Ladriere L, Cardozo AK, Dogusan Z, Cnop M, Eizirik DL. Free fatty acids and cytokines induce pancreatic beta-cell apoptosis by different mechanisms: role of nuclear factor-kappaB and endoplasmic reticulum stress. Endocrinology. 2004;145:5087–5096. doi: 10.1210/en.2004-0478. [DOI] [PubMed] [Google Scholar]
- 38.Laybutt DR, Preston AM, Akerfeldt MC, et al. Endoplasmic reticulum stress contributes to beta cell apoptosis in type 2 diabetes. Diabetologia. 2007;50:752–763. doi: 10.1007/s00125-006-0590-z. [DOI] [PubMed] [Google Scholar]
- 39.Jacqueminet S, Briaud I, Rouault C, Reach G, Poitout V. Inhibition of insulin gene expression by long-term exposure of pancreatic beta-cells to palmitate is dependent upon the presence of a stimulatory glucose concentration. Metabolism. 2000;49:532–536. doi: 10.1016/s0026-0495(00)80021-9. [DOI] [PubMed] [Google Scholar]
- 40.Briaud I, Harmon JS, Kelpe CL, Segu VB, Poitout V. Lipotoxicity of the pancreatic beta-cell is associated with glucosedependent esterification of fatty acids into neutral lipids. Diabetes. 2001;50:315–321. doi: 10.2337/diabetes.50.2.315. [DOI] [PMC free article] [PubMed] [Google Scholar]
- 41.Kelpe CL, Moore PC, Parazzoli SD, Wicksteed B, Rhodes CJ, Poitout V. Palmitate inhibition of insulin gene expression is mediated at the transcriptional level via ceramide synthesis. J Biol Chem. 2003;278:30015–30021. doi: 10.1074/jbc.M302548200. [DOI] [PubMed] [Google Scholar]
- 42.Hagman DK, Hays LB, Parazzoli SD, Poitout V. Palmitate inhibits insulin gene expression by altering PDX-1 nuclear localization and reducing MafA expression in isolated rat islets of Langerhans. J Biol Chem. 2005;280:32413–32418. doi: 10.1074/jbc.M506000200. [DOI] [PMC free article] [PubMed] [Google Scholar]
- 43.Seaquist ER, Robertson RP. Effects of hemipancreatectomy on pancreatic alpha and beta cell function in healthy human donors. J Clin Invest. 1992;89:1761–1766. doi: 10.1172/JCI115779. [DOI] [PMC free article] [PubMed] [Google Scholar]
- 44.Rankin MM, Kushner JA. Adaptive beta-cell proliferation is severely restricted with advanced age. Diabetes. 2009;58:1365–1372. doi: 10.2337/db08-1198. [DOI] [PMC free article] [PubMed] [Google Scholar]
- 45.Tschen SI, Dhawan S, Gurlo T, Bhushan A. Age-dependent decline in beta-cell proliferation restricts the capacity of beta-cell regeneration in mice. Diabetes. 2009;58:1312–1320. doi: 10.2337/db08-1651. [DOI] [PMC free article] [PubMed] [Google Scholar]
- 46.Wang ZV, Mu J, Schraw TD, et al. PANIC-ATTAC: a mouse model for inducible and reversible beta-cell ablation. Diabetes. 2008;57:2137–2148. doi: 10.2337/db07-1631. [DOI] [PMC free article] [PubMed] [Google Scholar]
- 47.Kargar C, Ktorza A. Anatomical vs functional beta-cell mass in experimental diabetes. Diabetes Obes Metab. 2008;10(Suppl 4):43–53. doi: 10.1111/j.1463-1326.2008.00940.x. [DOI] [PubMed] [Google Scholar]
- 48.Delghingaro-Augusto V, Nolan CJ, Gupta D, et al. Islet beta cell failure in the 60% pancreatectomised obese hyperlipidaemic Zucker fatty rat: severe dysfunction with altered glycerolipid metabolism without steatosis or a falling beta cell mass. Diabetologia. 2009;52:1122–1132. doi: 10.1007/s00125-009-1317-8. [DOI] [PubMed] [Google Scholar]
- 49.Kulkarni RN, Jhala US, Winnay JN, Krajewski S, Montminy M, Kahn CR. PDX-1 haploinsufficiency limits the compensatory islet hyperplasia that occurs in response to insulin resistance. J Clin Invest. 2004;114:828–836. doi: 10.1172/JCI21845. [DOI] [PMC free article] [PubMed] [Google Scholar]
- 50.Sachdeva MM, Claiborn KC, Khoo C, et al. Pdx1 (MODY4) regulates pancreatic beta cell susceptibility to ER stress. Proc Natl Acad Sci U S A. 2009;106:19090–19095. doi: 10.1073/pnas.0904849106. [DOI] [PMC free article] [PubMed] [Google Scholar]
Associated Data
This section collects any data citations, data availability statements, or supplementary materials included in this article.