

Abstract
Humans have systematic sex differences in brain-related behavior, cognition, and pattern of mental illness risk. Many of these differences emerge during adolescence, a developmental period of intense neurostructural and endocrine change. Here, by creating “movies” of sexually dimorphic brain development using longitudinal in vivo structural neuroimaging, we show regionally specific sex differences in development of the cerebral cortex during adolescence. Within cortical subsystems known to underpin domains of cognitive behavioral sex difference, structural change is faster in the sex that tends to perform less well within the domain in question. By stratifying participants through molecular analysis of the androgen receptor gene, we show that possession of an allele conferring more efficient functioning of this sex steroid receptor is associated with “masculinization” of adolescent cortical maturation. Our findings extend models first established in rodents, and suggest that in humans too, sex and sex steroids shape brain development in a spatiotemporally specific manner, within neural systems known to underpin sexually dimorphic behaviors.
Keywords: sex differences, brain, cortex, development, androgen receptor
With the onset and progression of puberty in humans, there is a rapid and disproportionately male increase in accidental deaths, suicide, substance abuse, and violent offenses (1), alongside a disproportionately female increase in mood, anxiety, and eating disorders (2). Although not without controversy (3), robust sex difference in cognition have also been documented during childhood and adolescence—language tasks tend to favor females (4) and visuospatial tasks tend to favor males (5)—which may contribute to sex differences in related scholastic aptitude tests (6). Understanding the mechanisms of cognitive and behavioral sex differences is therefore not only of theoretical importance in the neuroscientific study of psychopathology and cognitive variation, but may also have practical implication for our public health, criminal justice, and educational systems.
Social, psychological, and biological factors all play a role in human cognitive and behavioral sex differences. The fundamental contribution of biological mechanisms is pointed toward by the stereotyped ontogeny of human cognitive behavioral sex differences, the pattern of their disruption in medical syndromes of abnormal sex chromosome complement or sex steroid signaling (7), and longstanding recognition of the primacy of biological influences in shaping behavioral sex differences throughout the rest of animal kingdom (8). Many behavioral sex differences in vertebrates are known to be dependent on sexually dimorphic structural development of underlying neural systems as a result of the “masculinizing” effects of pubertal and adolescent surges in androgen signaling on the developing brain (9).
Behavioral masculinization in the macaque has been experimentally shown to rely on activation of the androgen receptor during fetal development (10). The androgen receptor is expressed in multiple regions of the primate brain including cerebral cortex, amygdala, and hypothalamus (11), and has the capacity to alter neuronal structure (12) and function (13). The best evidence that androgen receptor activation may also be important for somatic and behavioral masculinization in humans comes from the physical and psychosexual phenotypes seen in genetically male individuals born with rare mutations rendering the androgen receptor nonfunctional [complete androgen insensitivity syndrome (CAIS)]. Physical feminization in CAIS is so marked that diagnosis is usually not made until female pubertal menarche fails to take place (7). Furthermore, persons with CAIS usually have a female gender identity [although exceptions have been reported (14)] and heterosexual female sexual orientation (15). Studies examining how individuals with CAIS perform on cognitive tasks known to show sex differences are scarce, although there is some evidence for impaired visuospatial cognition in CAIS (16). This finding suggests that androgen receptor activation may contribute to the differences in visuospatial cognition that have been documented between males and females (5).
The relative inaccessibility of the human brain has long frustrated proper description of biological processes that might underlie cognitive and behavioral sex differences, and ethical considerations limit experimental manipulation of candidate genetic and hormonal mechanisms for these differences. As a result, several basic questions about sexually dimorphic neurobiology in humans remain unanswered. First, although it is well established that many sexually dimorphic behaviors in other species are underpinned by highly localized patterns of sexually dimorphic structural brain development (9), there has never been a spatially detailed longitudinal description of how the brains of human males and females grow differently. The cerebral cortex is of particular interest in this regard as it undergoes its most dynamic structural change in adolescence (17) when many cognitive behavioral sex differences in humans emerge, shows sexually dimorphic structural maturation at the gross lobar scale (18), and is known to subserve several sexually dimorphic aspects of cognition and behavior (Table S1). Second, as far as we are aware, no one has ever longitudinally tested the hypothesis that nonhuman vertebrate models of androgen receptor–dependent structural masculinization of sexually dimorphic brain regions subserving sexually dimorphic behavior (12) also apply to humans. We do not know, for example, if increased androgen receptor signaling masculinizes cortical maturation in humans. This lack of knowledge is partly a result of the absence of any spatially detailed longitudinal characterization of what constitutes “masculinization” of cortical maturation in humans, but also reflects the challenges of accurately (19) and repeatedly measuring serum androgens in large longitudinal cohorts—especially during adolescence, when surging androgen levels make the question of androgen receptor–mediated influences on brain development highly relevant. The few studies that have attempted to relate circulating androgens to brain anatomy in humans are cross-sectional in design, and have generated mixed results (20–22), although the largest of these studies report that possession of a genetic variant conferring more efficient androgen receptor functioning strengthens the relationship between peripheral measures of testosterone and brain anatomy (23, 24).
We therefore conducted a two-part study that first longitudinally characterized sex differences in human cortical maturation, and then—using these sex differences as a framework—tested the hypothesis that genetic variation conferring increased androgen receptor efficiency would be associated with masculinization of cortical maturation in regions known to subserve domains of human cognitive behavioral sex difference. Both components of our study were conducted within a longitudinally scanned cohort of 284 healthy individuals (153 males) providing a total of 641 structural MRI (sMRI) brain scans spanning the age range of 9 to 22 y (Table S2 shows participant characteristics). In vivo measures of cortical thickness were derived at approximately 40,000 points on each cortical hemisphere surface with submillimeter resolution using a validated and automated technique (25, 26). (Advantageous properties of cortical thickness as an anatomical metric of interest are detailed in SI Text S1.)
In the first part of our study, we hypothesized that rates of cortical thickness change over adolescence would differ between male and female subjects, but that contrasting patterns of sexually dimorphic maturation would be seen in regions subserving those behavioral and cognitive domains in which females are “advantaged” relative to males compared with regions subserving domains that favor males. The former include anterior cingulate (AntCC), ventromedial prefrontal cortex (vmPFC), orbitofrontal (OFC), ventrolateral prefrontal (vlPFC), inferior frontal gyrus (IFG), and dorsolateral prefrontal (DLPFC) regions that are engaged during tasks in which female subjects typically show strengths relative to male subjects, such as language and regulation of sensation-seeking, risk taking, aggression, and impulsivity. The latter include the intraparietal sulcus (IPS) and inferior parietal lobule (IPL), which are crucial for visuospatial tasks in which male subjects typically show strengths relative to female subjects. The relevance of these regions to domains of cognitive behavioral sex difference is supported by numerous functional neuroimaging studies in healthy individuals (Table S1). We tested our hypothesis using mixed models to estimate group-average cortical thickness trajectories for male and female subjects, at each cortical point between ages 9 and 22 y. Sex differences in cortical thickness were then fine-mapped at successive age points to create time-lapse sequences (Movies S1 and S2) of how these sex differences change during adolescence. We used these same statistical models to create a cortical map for the difference between male and female subjects in the rate of cortical thickness change during adolescence (Fig. S1).
In the second part of our study, we asked if enhanced androgen receptor signaling efficiency confers a more “masculine” pattern of cortical change within each sex by stratifying participants based on the length of a functional polymorphic trinucleotide (CAG)n repeat within exon 1 the X-linked gene encoding the androgen receptor. Whereas extreme CAG lengths (>40 repeats) cause spinal muscular atrophy (i.e., Kennedy disease), a higher number of repeats within the normal range (>90% alleles have between 16 and 29 CAG repeats) have been associated with lower androgen receptor transactivational capacity in numerous in vitro studies (27–31), and with androgenic phenotypes in transgenic mice (32). In humans, shorter CAG lengths have been associated with accentuation of several sexually differentiated somatic phenotypes in males (33) and with the presence of hyperandrogenic syndromes in females (34) (although negative studies also exist e.g., ref. 35). Some studies have also linked CAG length to risk for sexually differentiated psychiatric conditions (36). We classified alleles as high functioning (AR-H) “short” alleles (<23 CAG repeats), and low functioning (AR-L) “long” alleles (≥23 CAG repeats) using a median-split approach. Because the androgen receptor gene is X-linked, males are hemizygous. In contrast, females carry two alleles, of which only one is expressed in any cell because of the phenomenon of “Lyonization” through which one X-chromosome is randomly inactivated in nongermline cells (37). Therefore, categorizing individuals based on whether they expressed an AR-L or AR-H allele resulted in two males groups (AR-H, AR-L) and three females groups, with heterozygous females (designated AR-M for “medium”) hypothesized as having an androgen receptor CAG influence between that of obligate AR-L and AR-H expressing homozygous females (assuming that at the group-level X inactivation in females is random with respect to AR CAG length). We related androgen-receptor genotype to cortical maturation within each sex separately. Within female subjects, we were able to test for evidence of a “dosage effect” linking the three hypothesized levels of androgen receptor functioning to masculinization of cortical maturation. In this context, “masculinization” is used to refer to instances in which, for a given cortical region, the difference between AR-H and AR-L groups in rate of cortical thickness change follows the same “direction” (e.g., faster loss in AR-H than AR-L) as the difference in rate of cortical thickness change seen between male and female subjects (e.g., faster loss in males as a group than females as a group). The size of each genotype group was as follows: male, AR-H (n = 83, 192 scans), AR-L (n = 70, 171 scans); female, AR-H (n = 31, 66 scans), AR-M (n = 69, 152 scans), AR-L (n = 31, 60 scans). A categorical rather than continuous approach was adopted to modeling variations in CAG length because a categorical model (i) facilitates comparison between our study and all previous work relating CAG length of measures of brain structure and function in humans (23, 24) and (ii) allows a similar approach to be adopted for male and female subjects when relating CAG length to cortical maturation.
Results
Our time-lapse sequences of cortical maturation in male and female subjects revealed that sex differences in cortical thickness change across adolescence in a highly complex and spatially heterogenous manner (Movies S1 and S2 and still-frame images in Fig. 1).
Fig. 1.

Still-frame images from Movies S1 and S2 show how group differences in estimated mean cortical thickness between male and female subjects change between 9 and 22 y. The cortical surface is shown from right oblique, left oblique, posterior, and inferior and medial views (columns) for the four ages indicated (rows). Colored regions indicate those where estimated group-average cortical thickness in males is greater than that in females, as per the color bar provided. For clarity, regions where cortical thickness is greater in females than males are not color-graded. Markers A–D refer to regions indicated in cortical maps, and illustrate cortical thickness change with age for males and females. At age 9 y, cortical thickness is greater in males than females over most of the cortex with the exception of small regions in bilateral supplementary motor (SMG)/SFG and inferior temporal (ITG) gyri, and right DLPFC. Then, as adolescence advances, thickness differences are lost in a wave that starts in SFG and spreads downward across both frontal lobes. This phenomenon is driven by the predominantly frontal phenomenon of cortical thinning with age in both male and female subjects, but more rapidly so in males (Fig. S1). The only frontal exception was right lateral OFC, where a greater rate of adolescent cortical thinning in females than in males resulted in the magnitude of cortical thickness sex differences becoming greater across adolescence. Beyond the frontal lobes, a faster rate of cortical thinning in males compared with females was seen only in bilateral precuneus, superiodorsal parietal, and fusiform cortices (Fig. S1).
At age 9 y, mean cortical thickness in males was greater than that in females throughout most of the cortical sheet. By age 22 y, however, this difference became diminished or inverted in some cortical subregions, but accentuated in others. Diminution and inversion of sex differences in cortical thickness throughout adolescence was strongly localized to the frontal lobes, but occurred at a different tempo in different frontal subregions. Both male and female subjects showed cortical thinning between ages 9 and 22 y throughout almost all of the frontal lobes. As a result of faster frontal cortical thinning in male than female subjects, the presence of greater frontal cortical thickness in male relative to female subjects evident at age 9 y was lost over the course of adolescence in a bilaterally synchronous “wave” that swept across frontal regions. Frontal subregions were traversed by this wave in a sequence that recapitulated the order in which we have previously shown frontal subregions to structurally mature relative to each other (17, 26). That is, both the previously described maturational wave, and the one with which cortical thickness in males was seen to “catch-up” with that in females within the present study, began in superior frontal gyri (SFG) and ran toward the frontal poles while spreading down the lateral and medial aspects of both frontal lobes. Anterior cingulate, vmPFC, OFC, and DLPFC—where frontal gray matter is known to mature latest in typical development—were also those where, despite a greater rate of loss between ages 9 and 22 y, frontal cortical thickness in males was still greater than that in females at age 22 y. In addition to these striking features of frontal cortical thickness change during adolescence in male and female subjects, statistically significant acceleration of cortical thinning in males relative to females was seen in left frontopolar region extending from the medial frontal to lateral inferior frontal gyrus (Fig. S1).
In almost all nonfrontal cortices, sex differences in cortical thickness persisted or accentuated over adolescence, although this was not driven by the same process in all cortical subregions. In a confluent inferior parietal, posterior temporal, and occipital region bilaterally, the magnitude of sex differences in cortical thickness became greater during adolescence because thickness loss was more rapid in female than male subjects (Fig. 1 and posterior cortical views in Fig. S1). However, a different pattern of sexually dimorphic maturation was seen in anterior temporal cortices, whereby the magnitude of sex differences in cortical thickness became greater during adolescence because thickness increased with age in both sexes, but at a greater rate in males than females.
Because some have argued that sex differences in cortical thickness are largely driven by sex-differences in brain size (38), and it is conceivable that absolute cortical thickness loss between two time points is positively correlated with cortical thickness at time one, we recalculated the rate of cortical thickness loss at each vertex as a proportion of cortical thickness at age 9 y separately for each sex. Maps of sex differences in proportional cortical thickness loss were identical to those for sex differences in the absolute rate of cortical thickness loss (Fig. S1).
Mapping the diverse patterns of cortical thickness change with age that represented “masculinization” of adolescent cortical development allowed us to then test the hypothesis that enhanced androgen receptor signaling efficiency confers a more masculinized pattern of cortical change within male and female subjects (Fig. 2, Left and Right, respectively). AR-H males had a statistically significant attenuation of the rate of cortical thickness loss relative to AR-L males in bilateral IPL and IPS, right STG, left temporo-occipital junction, and left middle frontal gyrus (MFG), but showed a relative acceleration of cortical thickness increase in the right temporal pole (where cortical thinning in males as a group was slower than that in females). In females, there was a statistically significant stepwise increase in the rate of cortical thickness loss moving from AR-L, to A-M, to AR-H groups in left IFG (where cortical thinning in males as a group was faster than that in females).
Fig. 2.

Vertex map indicates where the rate of cortical thickness change with age in males (Upper) and females (Lower) showed statistically significant differences between AR-CAG groups. Colors represent t statistic magnitude for the interacting fixed effects of age and AR-CAG genotype group in predicting cortical thickness. As indicated, “warmer” colors represent a more statistically significant difference in the rate of cortical thickness change with age between AR-CAG groups (vertex maps are corrected for multiple comparisons using a false discovery rate threshold of q = 0.1). (Insets) Examples of estimated average cortical thickness change with age for each AR-CAG genotype group. In males, other than a region in the left middle frontal gyrus, cortical differences in cortical thickness change with age in AR-H and AR-L groups qualitatively recapitulated differences in cortical thickness change with age between male and female subjects (Fig. S1). In females, within the IFG, a significant stepwise increase in the rate of age-related cortical thinning moving from lowest (AR-L), to intermediate (AR-M), to highest (AR-H) androgen receptor transductive capacity as inferred from AR-CAG genotype. As a result, AR-L females have borderline significantly thinner cortex than AR-H at age 9 y (P = 0.06), but significantly thicker cortex than AR-H by age 22 y (P = 0.004). In this same IFG region, the group-average rate of cortical thinning in males is greater than that in females (Fig. S1).
Discussion
Sex Differences in Cortical Structure Vary by Cortical Region and Developmental Stage.
The spatially heterogenous pattern of sexually dimorphic cortical maturation revealed by our study provides a neurodevelopmental framework for considering sex differences in cognition and behavior. Rates of completed suicide, accidental death, aggression, and antisocial behavior peak during adolescence for both male and female subjects, but this developmental surge is much more pronounced in males (1). It has been proposed that the increase in risky and impulsive behaviors during adolescence may be a consequence of late maturation of frontal subregions involved in impulse control, planning, and decision making—such as AntCC, vmPFC, OFC, vlPFC, DLPFC, and medial SFG—relative to maturation of limbic regions involved in reward-related and aggressive behavior (39, 40). We now show that these same frontal subregions are those where cortical thickness in males is last to approximate that in females, despite an accelerated rate of adolescent cortical thinning in males compared with females. Therefore, a focally accentuated delay of frontal maturation in males compared with females within basal and dorsolateral subregions crucial for self-regulation may partially account for why males are much more prone to impulsive and risk-taking behaviors during adolescence than females. Regionally protracted cortical maturation in males could also lead to a regionally specific broadening of the temporal windows through which detrimental genetic and environmental influences are accrued. In line with this, maleness is an especially potent risk factor for antisocial disorder and psychopathy in adulthood, which show strong associations with aberrant structure and function in AntCC, vmPFC, OFC, vlPFC, DLPFC, and medial SFG regions (41).
In contrast to the female advantage in prefrontally dependant domains of cognition and behavior, a robust male advantage is seen for parietally dependant visuospatial tasks (5). This advantage is best demonstrated for tests of mental rotation, which consistently recruit the IPS and surrounding regions (42), and for which a male advantage becomes more marked through puberty (5). Our findings reveal that the opposing pattern of behavioral sex bias for frontally versus parietally dependent tasks, is accompanied by an opposing pattern of sexually dimorphic maturation within frontal versus parietal cortices. Specifically, whereas frontal cortical thickness loss is faster in male than female subjects during adolescence, IPL and IPS cortical thickness loss is accelerated in female compared with male subjects. Our interpretation of an accelerated rate of cortical thickness loss in frontal and parietal regions as being indicative of delayed cortical maturation is supported by available descriptions of the more complex nonlinear trajectories of cortical thickness change that apply beyond adolescence in frontoparietal cortices (26). In a larger combined sample of male and female subjects spanning the age range from 3 to 35 y, we have previously shown that, across the age range of our current study, frontal-parietal cortical thickness is in the downward phase of a cubic trajectory, approaching its second inflection at decreasing velocity (26). Therefore, “earlier” segments of this trajectory would yield a faster linear rate of cortical thinning than “later” segments. Furthermore, our interpretation is in line with findings of the largest available developmental functional neuroimaging study of sex differences, in which task-related activations in females were found to coincide with maturation-related activations in frontal cortices (especially in IFG), whereas this overlap occurred in parietal cortices for males (especially in IPL) (43). Sex differences in the linear rate of adolescent cortical thickness change in middle and anterior temporal regions are likely to have distinct developmental implications because, in contrast to frontoparietal cortices, cortical thickness in middle and anterior temporal cortices is still increasing toward peak values (at decreasing velocity) during adolescence, and does not robustly enter the phase of thickness loss with age until late in the third decade of life (26). We speculate therefore that our finding of accelerated cortical thickness gain with age in males compared with females within temporal poles is consistent with delayed maturation in males. Such an interpretation is supported by our earlier report that peak temporal lobe cortical volume (which is partly determined by cortical thickness) reaches peak values later in female than male subjects (18).
An important methodological implication of our findings is that developmental factors are likely to be a major source of heterogeneity among the findings of all existing studies of regional sex differences in cortical anatomy that are exclusively cross-sectional in nature (44). The findings of these cross-sectional studies also vary depending on if and how sex differences in overall brain size are accounted for when assessing sex differences in cortical anatomy, whereas we now show this is not the case for sex differences in the rate of cortical thickness loss during adolescence. Therefore, using longitudinal approaches to dynamically map sex differences in cortical change over time may capture a fundamental neurobiological difference between male and female subjects that is more robust to methodological variation than cross-sectional between-sex comparisons of cortical anatomy at any one time point.
Our time-lapse movie sequences charting how sex differences in cortical thickness change over adolescence are not restricted to those frontopolar regions where sex differences in the rate of cortical thickness change with age reach statistical significance. Rather, our movies cover the entire cortical sheet to reveal how subtle regional variations in the timing of male cortical change relative to female cortical change give rise to a highly organized and largely symmetrical “wave-front” (denoting equality of cortical thickness between both sexes) that sweeps across the cortex as adolescence progresses, and recapitulates the sequential order with which cortical regions mature relative to each other. Despite these striking features, differences in rate of cortical change between male and female subjects do not reach statistical significance within many of the cortical regions traversed by this wave. This may represent power limitations despite the present study being one of the largest to describe sex differences in human brain anatomy.
Genetic Variation Conferring Enhanced Androgen Receptor Efficiency Modulates Cortical Maturation Within Both Sexes in a Regionally Specific Manner.
Taken together, findings of the first part of our study indicate that, in humans, there may be a relationship between the direction of sex bias in the cognitive behavioral domain subserved by a given cortical region, and the direction of sex difference in maturational tempo within that cortical region. Studies in nonhuman vertebrates show that morphometric variation in sexually dimorphic brain regions that subserve sexually dimorphic behavior is partly dependent on androgen receptor activation, which serves to masculinize anatomy (12). To date, attempts to relate testosterone signaling to brain anatomy in humans have relied on interindividual differences in serum testosterone levels (that are hard to acquire with high reliability; ref. 19), and used cross-sectional study designs that have factored out the effects of age (20, 22) and/or sex (21). Therefore, our focus on genetically determined variation in androgen receptor functioning within a longitudinal study of adolescent cortical thickness change provides some of the strongest evidence to date that androgen signaling has the capacity to influence neurodevelopmental processes in humans. Furthermore, greater androgen receptor efficiency in males was specifically associated with a more “masculine” pattern of cortical maturation in bilateral IPL regions known to subserve visuospatial tasks that favor males, whereas greater androgen receptor efficiency in females was specifically associated with a more masculine pattern of cortical maturation in left IFG regions implicated in language and impulse-control domains, which favor females (Table S1). The finding of a “dosage effect” in females serves as further validation for the role of androgen receptor signaling human cortical development. The sex-specific nature of relationships between androgen receptor functioning and cortical maturation raises the possibility that other hormonal, genetic, or experiential differences between males and females act to modify androgen receptor expression (45) or the relationship between androgen receptor signaling and cortical development. However, regardless of sex, possession of a genetic variant conferring increased androgen receptor efficiency was associated with a masculinization of the rate of cortical thickness change, implying that males and females with greater levels of cerebral androgen receptor signaling show a more masculine pattern of adolescent cortical maturation than their same-sex peers. This strongly supports the notion that the presence of several-fold greater levels of circulating androgens in males compared with females during prenatal and adolescent development (46, 47) is likely to contribute to between-sex differences in human cortical anatomy.
Although our study represents the only spatially detailed longitudinal assessment of sexually dimorphic brain development in humans—and, as far as we are aware, the only longitudinal examination of how variation in androgen receptor signaling efficiency relates to variation in the tempo of brain maturation—it does have certain limitations. Most importantly, (i) we cannot comment on the cellular phenomena driving reported differences in cortical thickness maturation; (ii) our dataset did not allow us to directly relate sex differences in cortical thickness maturation to sex differences in behavior or cognition, and (iii) the links we forge between sex and androgen receptor genotype, and cortical maturation are correlative and do not specify the causal mechanisms through which such links might arise. Nevertheless, our study unveils a map of how the brains of boys and girls grow differently as they negotiate the sensitive developmental transition into adulthood, and suggests that androgen receptor activation plays a role in the drafting of this map.
Methods
Subjects.
Participants were recruited through local advertisement. The absence of neurological or psychiatric illness was established through completion of a screening questionnaire (Childhood Behavior Checklist) and a structured diagnostic interview administered by a child psychiatrist (48). Participants were of mixed handedness (handedness established using Physical and Neurological Examination of Soft Signs). All participants had a full-scale intelligence quotient (IQ) of greater than 80 estimated by using age-appropriate Wechsler Intelligence Scales (49). Socioeconomic status was quantified by using Hollingshead scales (50). The institutional review board of the National Institutes of Health approved the research protocol used in this study and written informed consent and assent to participate in the study were obtained from parents and children, respectively.
Neuroimaging.
Of all 284 participants with at least one brain sMRI scan, 60% had two or more scans and 40% had three or more. Scans were acquired at intervals of approximately 2 y. All sMRI scans were T1-weighted images with contiguous 1.5-mm axial slices and 2.0-mm coronal slices, obtained on the same 1.5-T Signa scanner (General Electric) with a 3D spoiled gradient recalled echo sequence. Native MRI scans were submitted to the CIVET pipeline (version 1.1.8; http://wiki.bic.mni.mcgill.ca/index.php/CIVET) to generate separate cortical models for each hemisphere. This automated set of algorithms begins with linear transformation, correction of nonuniformity artifacts, and segmentation of each image into white matter, gray matter, and CSF (51). Next, each image is fitted with two deformable mesh models to extract the white/gray and pial surfaces. These surface representations are then used to calculate cortical thickness at approximately 40,000 vertices per hemisphere (52). A 30-mm-bandwidth blurring kernel was applied, the size of which was selected to maximize statistical power while minimizing false positives, as determined by population simulation (25).
Genetics.
For each participant, DNA was extracted from previously prepared lymphoblastoid cell lines using standard methods (Qiagen). Lymphoblastoid cell lines were grown in culture for approximately 2 mo before DNA extraction. Genotyping of AR-CAG length was performed by Prevention Genetics by using a slightly modified Marshfield set (13) (http://research.marshfieldclinic.org/genetics/GeneticResearch/sets/Set%2013.xls). A more detailed description of genetic methodology can be found in SI Text.
Statistics.
To describe sexually dimorphic cortical maturation, we modeled—at each vertex—the fixed effects of sex, age, and the interaction between these two terms (Eq. 1). Age effects on cortical thickness were modeled using a linear (rather than nonlinear) age term because analyses in larger samples spanning wider age ranges have shown that linear cortical thickness change with age is the predominant age effect in all cortical areas during the adolescent age range we wished to study (26). Furthermore, preliminary analyses within the current dataset empirically confirmed that the highest-order age term that described cortical thickness change with age in the smallest of our androgen receptor genotype groups was a linear term. Therefore using an linear age term in this study maximized biological validity while protecting against the risk of finding genotype group differences in nonlinear cortical thickness change that are driven by differences in statistical power to describe nonlinear cortical thickness change arising from differences in genotype group size.
Mixed-model regression was used to model cortical thickness change because it can accommodate multiple measurements per person at different ages, missing data, and irregular intervals between measurements, thereby increasing statistical power (53). We included a nested random-effects term that modeled within-family and within-person dependence of observations. At each vertex, cortical thickness (CT) for ith family's jth individual's kth time point was modeled as follows:
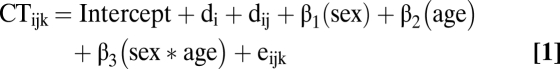 |
This model was run repeatedly, with the age term recentered at successive ages. The β1 coefficients from each run (representing the estimated difference in group average cortical thickness for male and female subjects at each successive age) were projected onto a standard brain template to create time-lapse sequences (Movies S1 and S2) of how the sex difference in CT changed with age. Still images from these time-lapse sequences are shown in Fig. 1. The magnitude of the β3 coefficient (interaction between sex and age) at each vertex, and vertices where the t statistic associated with this term survived correction for multiple comparisons, are illustrated in Fig. S1.
The neuromaturational correlates of androgen receptor genotype cortical thickness (CT) for ith family's jth individual's kth time point was modeled as follows:
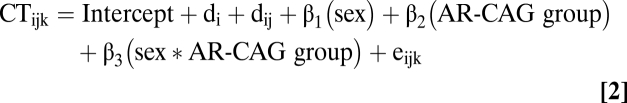 |
Where AR-CAG group was a binary variable with levels AR-L and AR-H in males and an ordinal categorical variable with three levels (AR-L, AR-M, and AR-H) in females.
Supplementary Material
Acknowledgments
We thank the participants who took part in this study. This study was funded through the National Institutes of Health and National Institute of Health Intramural Research and by United Kingdom Medical Research Council Clinical Research Training Fellowship G0701370 (to A.R.).
Footnotes
The authors declare no conflict of interest.
This article is a PNAS Direct Submission.
This article contains supporting information online at www.pnas.org/lookup/suppl/doi:10.1073/pnas.1006025107/-/DCSupplemental.
References
- 1.Forum on Child and Family Statistics. America's Children: Key National Indicators of Well-Being. Washington, DC: US Government Printing Office; 2009. [Google Scholar]
- 2.Green HM, Meltzer A, Ford H, Goodman TR. Mental Health of Children and Young People in Great Britain, 2004. Baskingstoke, UK: Palgrave Macmillan; 2004. [Google Scholar]
- 3.Halpern DF. Sex Differences in Cognitive Abilities. 3rd Ed. Mahwah, NJ: Lawrence Erlbaum; 2000. [Google Scholar]
- 4.Stokes SF, Klee T. Factors that influence vocabulary development in two-year-old children. J Child Psychol Psychiatry. 2009;50:498–505. doi: 10.1111/j.1469-7610.2008.01991.x. [DOI] [PubMed] [Google Scholar]
- 5.Voyer D, Voyer S, Bryden MP. Magnitude of sex differences in spatial abilities: A meta-analysis and consideration of critical variables. Psychol Bull. 1995;117:250–270. doi: 10.1037/0033-2909.117.2.250. [DOI] [PubMed] [Google Scholar]
- 6.Machin S, Pekkarinen T. Assessment. Global sex differences in test score variability. Science. 2008;322:1331–1332. doi: 10.1126/science.1162573. [DOI] [PubMed] [Google Scholar]
- 7.Hines M. Early androgen influences on human neural and behavioural development. Early Hum Dev. 2008;84:805–807. doi: 10.1016/j.earlhumdev.2008.09.006. [DOI] [PMC free article] [PubMed] [Google Scholar]
- 8.Aristotle . History of Animals trans Cresswell R. London: Henry G Bohn; 1862. [Google Scholar]
- 9.Morris JA, Jordan CL, Breedlove SM. Sexual differentiation of the vertebrate nervous system. Nat Neurosci. 2004;7:1034–1039. doi: 10.1038/nn1325. [DOI] [PubMed] [Google Scholar]
- 10.Wallen K. Hormonal influences on sexually differentiated behavior in nonhuman primates. Front Neuroendocrinol. 2005;26:7–26. doi: 10.1016/j.yfrne.2005.02.001. [DOI] [PubMed] [Google Scholar]
- 11.Clark AS, MacLusky NJ, Goldman-Rakic PS. Androgen binding and metabolism in the cerebral cortex of the developing rhesus monkey. Endocrinology. 1988;123:932–940. doi: 10.1210/endo-123-2-932. [DOI] [PubMed] [Google Scholar]
- 12.Zuloaga DG, Puts DA, Jordan CL, Breedlove SM. The role of androgen receptors in the masculinization of brain and behavior: What we've learned from the testicular feminization mutation. Horm Behav. 2008;53:613–626. doi: 10.1016/j.yhbeh.2008.01.013. [DOI] [PMC free article] [PubMed] [Google Scholar]
- 13.van Wingen G, Mattern C, Verkes RJ, Buitelaar J, Fernández G. Testosterone reduces amygdala-orbitofrontal cortex coupling. Psychoneuroendocrinology. 2010;35:105–113. doi: 10.1016/j.psyneuen.2009.09.007. [DOI] [PubMed] [Google Scholar]
- 14.T'Sjoen G, et al. Male gender identity in complete androgen insensitivity syndrome. Arch Sex Behav. 2010 doi: 10.1007/s10508-010-9624-1. 10.1007/s10508-010-9624-1. [DOI] [PubMed] [Google Scholar]
- 15.Wisniewski AB, et al. Complete androgen insensitivity syndrome: Long-term medical, surgical, and psychosexual outcome. J Clin Endocrinol Metab. 2000;85:2664–2669. doi: 10.1210/jcem.85.8.6742. [DOI] [PubMed] [Google Scholar]
- 16.Imperato-McGinley J, Pichardo M, Gautier T, Voyer D, Bryden MP. Cognitive abilities in androgen-insensitive subjects: Comparison with control males and females from the same kindred. Clin Endocrinol (Oxf) 1991;34:341–347. doi: 10.1111/j.1365-2265.1991.tb00303.x. [DOI] [PubMed] [Google Scholar]
- 17.Gogtay N, et al. Dynamic mapping of human cortical development during childhood through early adulthood. Proc Natl Acad Sci USA. 2004;101:8174–8179. doi: 10.1073/pnas.0402680101. [DOI] [PMC free article] [PubMed] [Google Scholar]
- 18.Lenroot RK, et al. Sexual dimorphism of brain developmental trajectories during childhood and adolescence. Neuroimage. 2007;36:1065–1073. doi: 10.1016/j.neuroimage.2007.03.053. [DOI] [PMC free article] [PubMed] [Google Scholar]
- 19.Brambilla DJ, O'Donnell AB, Matsumoto AM, McKinlay JB. Intraindividual variation in levels of serum testosterone and other reproductive and adrenal hormones in men. Clin Endocrinol (Oxf) 2007;67:853–862. doi: 10.1111/j.1365-2265.2007.02976.x. [DOI] [PubMed] [Google Scholar]
- 20.Neufang S, et al. Sex differences and the impact of steroid hormones on the developing human brain. Cereb Cortex. 2009;19:464–473. doi: 10.1093/cercor/bhn100. [DOI] [PubMed] [Google Scholar]
- 21.Witte AV, Savli M, Holik A, Kasper S, Lanzenberger R. Regional sex differences in grey matter volume are associated with sex hormones in the young adult human brain. Neuroimage. 2010;49:1205–1212. doi: 10.1016/j.neuroimage.2009.09.046. [DOI] [PubMed] [Google Scholar]
- 22.Peper JS, et al. Sex steroids and brain structure in pubertal boys and girls. Psychoneuroendocrinology. 2009;34:332–342. doi: 10.1016/j.psyneuen.2008.09.012. [DOI] [PubMed] [Google Scholar]
- 23.Perrin JS, et al. Growth of white matter in the adolescent brain: Role of testosterone and androgen receptor. J Neurosci. 2008;28:9519–9524. doi: 10.1523/JNEUROSCI.1212-08.2008. [DOI] [PMC free article] [PubMed] [Google Scholar]
- 24.Paus T, et al. Sexual dimorphism in the adolescent brain: Role of testosterone and androgen receptor in global and local volumes of grey and white matter. Horm Behav. 2010;57:63–75. doi: 10.1016/j.yhbeh.2009.08.004. [DOI] [PubMed] [Google Scholar]
- 25.Lerch JP, Evans AC. Cortical thickness analysis examined through power analysis and a population simulation. Neuroimage. 2005;24:163–173. doi: 10.1016/j.neuroimage.2004.07.045. [DOI] [PubMed] [Google Scholar]
- 26.Shaw P, et al. Neurodevelopmental trajectories of the human cerebral cortex. J Neurosci. 2008;28:3586–3594. doi: 10.1523/JNEUROSCI.5309-07.2008. [DOI] [PMC free article] [PubMed] [Google Scholar]
- 27.Buchanan G, et al. Structural and functional consequences of glutamine tract variation in the androgen receptor. Hum Mol Genet. 2004;13:1677–1692. doi: 10.1093/hmg/ddh181. [DOI] [PubMed] [Google Scholar]
- 28.Chamberlain NL, Driver ED, Miesfeld RL. The length and location of CAG trinucleotide repeats in the androgen receptor N-terminal domain affect transactivation function. Nucleic Acids Res. 1994;22:3181–3186. doi: 10.1093/nar/22.15.3181. [DOI] [PMC free article] [PubMed] [Google Scholar]
- 29.Irvine RA, et al. Inhibition of p160-mediated coactivation with increasing androgen receptor polyglutamine length. Hum Mol Genet. 2000;9:267–274. doi: 10.1093/hmg/9.2.267. [DOI] [PubMed] [Google Scholar]
- 30.Tut TG, Ghadessy FJ, Trifiro MA, Pinsky L, Yong EL. Long polyglutamine tracts in the androgen receptor are associated with reduced trans-activation, impaired sperm production, and male infertility. J Clin Endocrinol Metab. 1997;82:3777–3782. doi: 10.1210/jcem.82.11.4385. [DOI] [PubMed] [Google Scholar]
- 31.Kazemi-Esfarjani P, Trifiro MA, Pinsky L. Evidence for a repressive function of the long polyglutamine tract in the human androgen receptor: possible pathogenetic relevance for the (CAG)n-expanded neuronopathies. Hum Mol Genet. 1995;4:523–527. doi: 10.1093/hmg/4.4.523. [DOI] [PubMed] [Google Scholar]
- 32.Albertelli MA, Scheller A, Brogley M, Robins DM. Replacing the mouse androgen receptor with human alleles demonstrates glutamine tract length-dependent effects on physiology and tumorigenesis in mice. Mol Endocrinol. 2006;20:1248–1260. doi: 10.1210/me.2006-0021. [DOI] [PubMed] [Google Scholar]
- 33.Zitzmann M. The role of the CAG repeat androgen receptor polymorphism in andrology. Front Horm Res. 2009;37:52–61. doi: 10.1159/000175843. [DOI] [PubMed] [Google Scholar]
- 34.Van Nieuwerburgh F, et al. Shorter CAG repeats in the androgen receptor gene may enhance hyperandrogenicity in polycystic ovary syndrome. Gynecol Endocrinol. 2008;24:669–673. doi: 10.1080/09513590802342841. [DOI] [PubMed] [Google Scholar]
- 35.Ferk P, Perme MP, Teran N, Gersak K. Androgen receptor gene (CAG)n polymorphism in patients with polycystic ovary syndrome. Fertil Steril. 2008;90:860–863. doi: 10.1016/j.fertnstert.2007.07.1291. [DOI] [PubMed] [Google Scholar]
- 36.Westberg L, Eriksson E. Sex steroid-related candidate genes in psychiatric disorders. J Psychiatry Neurosci. 2008;33:319–330. [PMC free article] [PubMed] [Google Scholar]
- 37.Lyon MF. Gene action in the X-chromosome of the mouse (Mus musculus L.) Nature. 1961;190:372–373. doi: 10.1038/190372a0. [DOI] [PubMed] [Google Scholar]
- 38.Im K, et al. Brain size and cortical structure in the adult human brain. Cereb Cortex. 2008;18:2181–2191. doi: 10.1093/cercor/bhm244. [DOI] [PubMed] [Google Scholar]
- 39.Galvan A, et al. Earlier development of the accumbens relative to orbitofrontal cortex might underlie risk-taking behavior in adolescents. J Neurosci. 2006;26:6885–6892. doi: 10.1523/JNEUROSCI.1062-06.2006. [DOI] [PMC free article] [PubMed] [Google Scholar]
- 40.Steinberg L. Cognitive and affective development in adolescence. Trends Cogn Sci. 2005;9:69–75. doi: 10.1016/j.tics.2004.12.005. [DOI] [PubMed] [Google Scholar]
- 41.Yang Y, Raine A. Prefrontal structural and functional brain imaging findings in antisocial, violent, and psychopathic individuals: A meta-analysis. Psychiatry Res. 2009;174:81–88. doi: 10.1016/j.pscychresns.2009.03.012. [DOI] [PMC free article] [PubMed] [Google Scholar]
- 42.Zacks JM. Neuroimaging studies of mental rotation: A meta-analysis and review. J Cogn Neurosci. 2008;20:1–19. doi: 10.1162/jocn.2008.20013. [DOI] [PubMed] [Google Scholar]
- 43.Christakou A, et al. Sex-dependent age modulation of frontostriatal and temporo-parietal activation during cognitive control. Neuroimage. 2009;48:223–236. doi: 10.1016/j.neuroimage.2009.06.070. [DOI] [PubMed] [Google Scholar]
- 44.Lenroot RK, Giedd JN. Sex differences in the adolescent brain. Brain Cogn. 2010;72:46–55. doi: 10.1016/j.bandc.2009.10.008. [DOI] [PMC free article] [PubMed] [Google Scholar]
- 45.Fernández-Guasti A, Kruijver FP, Fodor M, Swaab DF. Sex differences in the distribution of androgen receptors in the human hypothalamus. J Comp Neurol. 2000;425:422–435. doi: 10.1002/1096-9861(20000925)425:3<422::aid-cne7>3.0.co;2-h. [DOI] [PubMed] [Google Scholar]
- 46.Garcés C, et al. Hormone levels in 12- to 15-year-old boys and girls in Spain and their relationship with anthropometric variables. Clin Biochem. 2008;41:621–624. doi: 10.1016/j.clinbiochem.2008.01.003. [DOI] [PubMed] [Google Scholar]
- 47.Garagorri JM, et al. Reference levels for 17-hydroxyprogesterone, 11-desoxycortisol, cortisol, testosterone, dehydroepiandrosterone sulfate and androstenedione in infants from birth to six months of age. Eur J Pediatr. 2008;167:647–653. doi: 10.1007/s00431-007-0565-1. [DOI] [PubMed] [Google Scholar]
- 48.Giedd JN, et al. Brain development during childhood and adolescence: A longitudinal MRI study. Nat Neurosci. 1999;2:861–863. doi: 10.1038/13158. [DOI] [PubMed] [Google Scholar]
- 49.Shaw P, et al. Intellectual ability and cortical development in children and adolescents. Nature. 2006;440:676–679. doi: 10.1038/nature04513. [DOI] [PubMed] [Google Scholar]
- 50.Hollingshead AB. Four-Factor Index for Social Status. New Haven, CT: Yale Univ Press; 1975. [Google Scholar]
- 51.Zijdenbos AP, Forghani R, Evans AC. Automatic “pipeline” analysis of 3-D MRI data for clinical trials: Application to multiple sclerosis. IEEE Trans Med Imaging. 2002;21:1280–1291. doi: 10.1109/TMI.2002.806283. [DOI] [PubMed] [Google Scholar]
- 52.MacDonald D, Kabani N, Avis D, Evans AC. Automated 3-D extraction of inner and outer surfaces of cerebral cortex from MRI. Neuroimage. 2000;12:340–356. doi: 10.1006/nimg.1999.0534. [DOI] [PubMed] [Google Scholar]
- 53.Pinheiro J, Bates DM. Mixed-effects models in S and S-PLUS. New York: Springer; 2000. [Google Scholar]
Associated Data
This section collects any data citations, data availability statements, or supplementary materials included in this article.