

Abstract
Background
Neonatal gene therapy is a promising strategy for treating diseases diagnosed before or shortly after birth. Early and long-term expression of therapeutic proteins may limit the consequences of genetic mutations and result in a potential ‘cure’. Adeno-associated viral vectors have shown promise in many areas of adult gene therapy but their properties have not been systematically investigated in the neonate.
Methods
In these studies using a constitutive promoter expressing luciferase, animals were administered one of ten serotypes of AAV on the second day of life. Examination of expression, organ growth and vector distribution, maintenance of expression and copy number were examined.
Results
All serotypes demonstrated expression and, in general, transduction of all organs within 3 days, albeit with different biodistribution patterns and expression levels. Highest expression was detected with AAVrh10 while lowest was with AAV4. Expression and genomes declined with growth over the first 10 weeks of life; thereafter, to day 100, expression and genomes remained relatively stable. With the highest expressing vectors, whole animal expression at 100 days declined to ~10% of that detected on the fifth day. AAVrh10 maintained the highest expression level and copy number throughout these studies.
Conclusion
The impact of tissue and organ growth on the stability of AAV expression will be important if neonatal gene transfer is to be considered as a modality for human gene therapy. While all vectors did demonstrate expression, rh10 holds the greater promise of the vectors tested to maintain copy number in both mitotic and post-mitotic tissues.
Keywords: Adeno-associated virus, gene therapy, neonatal, serotype rh10
Introduction
Correction of genetic diseases during the neonatal period may be achieved by targeting gene replacement strategies to expanding stem cell populations and to developing organ systems. Neonatal gene therapy is a promising strategy for treating a number of congenital diseases that can be diagnosed either prenatally or shortly after birth. Early gene transfer and long-term expression of therapeutic proteins during early postnatal life may limit or abrogate the pathologic consequences of genetic mutations.
Recombinant adeno-associated viral (AAV) vectors are capable of achieving persistent gene transfer in a number of tissues in adult animals and have shown significant promise as a method for gene therapy in multiple inherited genetic or acquired abnormalities.1-6 Few studies have examined the efficacy of therapy directed at the neonate and its organs. This area is particularly challenging due to rapid cellular proliferation and growth of organs and the organism which may affect the efficiency of and potentially compromise the persistence of expression of episomally located vector genomes. While many diseases could potentially be treated early in the neonatal period if diagnosed at the time of or shortly after birth, the influence that organ growth has on AAV-mediated transduction requires examination if such therapy is to be considered in the future.
Examination of novel AAV serotypes (7, 8, 9, and rh10) has not been performed in the neonate. In addition, a systematic comparison of the more common serotypes of AAV (1, 2, 3, 4, 5, and 6) administered in the neonatal period has not been previously described. Differences in biodistribution, level of, and persistence of expression will be critically important to the outcome of a neonatal gene transfer approach. In this study, we sought to examine the AAV serotype and intravenous route of administration, both clinically relevant, in an examination of the level and persistence of expression of a transgene product in the neonatal and young mouse tissues to 100 days of life. During the first 8 weeks, the mouse undergoes a 16-fold increase in body weight from ~1.5 grams at birth to ~25 grams as an adult. We demonstrate that early expression is detected with all 10 serotypes, some (9 and rh10) with improved vector properties including higher transduction efficiencies, and that persistent levels of gene expression can be achieved after a single dose of AAV in the neonatal period. However, the level of expression of the transgene is dependent on the serotype of AAV and that a natural tropism exists for certain tissues by AAV serotypes as has been previously described in the adult mouse.7-9 The serotype and cell cycle of the tissue of interest may determine whether persistent expression can be obtained as cells and tissues grow and divide in this period of rapid cellular proliferation. While these data demonstrate that AAV gene therapy in the neonate can be performed, it also demonstrates the challenges that rapid cellular proliferation adds to treatment initiated early in life with episomally-located vector genomes. Some vectors, particularly rh10, may be better suited in such applications.
Materials and Methods
Construction of Reporter Plasmids
A diagram of the vector construct is shown in Figure 1. Recombinant AAV vectors expressing firefly luciferase driven by the cytomegalovirus-enhanced chicken β-actin promoter (AAV.CB.LUC) were packaged with viral capsids AAV 1, 2, 3, 4, 5, 6, 7, 8, 9, and rh10 by pseudotyping in this study. The vector plasmid was constructed using the pAAV-hrGFP plasmid (Stratagene, La Jolla, CA). The CMV enhancer/chick β-actin-luciferase plasmid was derived by first excising the hCMV promoter at MluI and SacII from pAAV-hrGFP. The CB promoter was excised at AccI and ApaI from pturboCre (provided by M. Jiang, UCLA). The CB promoter was inserted and ligated by blunt-blunt cloning procedures to create the intermediate plasmid CB-hrGFP. The GFP cDNA was then excised at XhoI and EcoRI; the luciferase cDNA was subcloned into position by blunt-blunt methods. All restriction enzymes used were purchased from New England Biolabs (Ipswich, MA).
Figure 1.
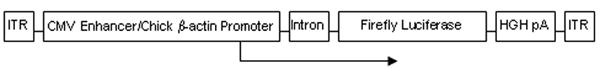
Diagram of recombinant adeno-associated viral vector (AAV.CB.Luciferase). AAV2 inverted terminal repeats (ITR) were used with pseudotyping to the respective capsid protein. The firefly luciferase cDNA is expressed under control of the cytomegalovirus (CMV) enhancer with chick β-actin promoter, β-globin intron, and with the human growth hormone (HGH) polyadenylation signal. The size of the AAV vector genome is 3.9 kb. The transgene was packaged with serotypes 1-rh10. Mice were injected intravenously on the second day of life with 2 × 10¹⁰ genome copies each.
Production of Recombinant AAV
The transgene plasmid pAAV2.CB.LUC.HGHpA (Fig. 1) is a serotype 2 adeno-associated viral vector containing the firefly luciferase (luc) reporter gene. This plasmid was used with the serotype-specific plasmid and pXX6 plasmid (provided by R. J. Samulski, University of North Carolina) to prepare rAAV stocks, as described.10 Briefly, HEK 293 cells were maintained at 37°C with 5% CO2 in Dulbecco’s modified Eagle’s medium supplemented with 10% fetal bovine serum. The AAV serotype specific helper plasmids pXR1-6 and 8 (R.J. Samulski, University of North Carolina) and 7, 9, and rh10 (Julie Johnston PhD/James Wilson MD PhD, University of Pennsylvania) contain their respective serotypes capsid genes, AAV2 replication genes and inverted terminal repeats. The plasmid pXX6, containing the genes necessary for adenovirus helper function in AAV replication, has been described elsewhere.11 Seventy-two hours after transfection of HEK 293 cells, cells were harvested, freeze/thawed 4 times, and centrifuged for 36 hours at 274,000 × g in a SW41 rotor (Beckman, Fullerton, CA). Fractions were examined by real-time PCR using sequences in the luciferase cDNA: forward primer 5 ’ CCAGGGATTTCAGTCGATGT3 ’; reverse primer 5’CGCAGTATCCGGAATGATTT3’. Cycling conditions were 35 cycles of 15 sec at 95 C, 45 sec at 60 C, and 30 sec at 70 C using platinum SYBR green (Invitrogen, Carlsbad, CA). Amplicon size was 235 bp. Genome copy number was determined by generating a standard line using standard dilutions with plasmid pEF1α-luciferase.12 Viral fractions with the highest viral titer were dialyzed against PBS with 5% glycerol, concentrated, and stored at -80 C until ready for use. Genome titer (genome copy/ml) of AAV vectors was similarly determined as described above. All serotypes were prepared as a single concentrated preparation used for the duration of the studies.
Animal Procedures
All handling of animals was performed in accordance with the University of California, Los Angeles (UCLA) Chancellor’s Committee for Animal Research guidelines. Eight to 12 week old FVB mice were purchased from Charles River Breeding Laboratory (Wilmington, MA) and used for breeding to generate neonatal mice for injection. All mice received a single superficial temporal vein injection of 2×10¹⁰ genomes of rAAV on the second day of life using a tuberculin syringe with a 28 gauge needle (20 mice per serotype). Control mice received pharmaceutical grade saline. Injection volume was 50 μl. All of the mice were housed under pathogen-free and defined flora conditions and food and water were provided ad libitum.
Mouse Experiments
A subset of five rAAV-injected mice was euthanized by isoflurane overdose on 5, 35, 70, and 100 days following vector administration for evaluation of tissue luciferase expression and vector biodistribution studies. Liver histology and ALT analysis were performed on mice euthanized on day 35.
Assays for Luciferase Activity
Tissues were removed and placed in flat bottom 2.0 ml small capped tubes (USA Scientific, Ocala, FL) with luciferase lysis buffer (Promega, Madison, WI) and placed on ice. Tissues were homogenized with a hand-held homogenizer (Omni International, Marietta, GA). Specimens were centrifuged at 13,200 rpm for 5 minutes and then placed at 4°C. A Sirius luminometer (Berthold Detection Systems, Oak Ridge, TN) was used to measure total light emission according to the manufacturer’s instructions. All samples were measured for 10 seconds after a five second delay. Luciferase levels were determined in duplicate by luminometry and recorded as relative light units (RLU). A recombinant luciferase standard (Promega, Madison, WI) was used to quantify luciferase expression and convert RLU to femtograms.
Protein assay
Samples were centrifuged at 13,200 rpm for 5 minutes and dilutions prepared in 96-well plates. A Lowry-based protein assay was performed in duplicate (Bio-Rad, Hercules, CA) and specimens were analyzed on a microplate reader (BioTek, Winooski, VT) at 750 nm. Samples were performed in duplicate and compared with protein standards. Mean and standard error of the mean was calculated. Luciferase levels by luminometry were normalized after protein concentrations of the liver samples were determined. Calculation of luciferase was performed by calculating a standard line using purified recombinant luciferase (Promega, Madison, WI) to generate luciferase standards beginning at 1.32 femtograms.
Bioluminescent Imaging (BLI)
Seventy-two hours, 20, 35, 70, and 100 days after AAV injection, mice were placed on a warming table and administered luciferase substrate (D-luciferin, Caliper Life Sciences, Mountain View, CA, 150 mg/kg IP). Five minutes later the isoflurane anesthetized mice were imaged using the bioluminescence optical imager (IVIS 200; Xenogen, Alameda, CA). Mice were immediately placed in a light-tight chamber and baseline gray-scale body-surface images were taken. Afterwards, photons emitted from the firefly luciferase reaction within the animal were acquired to demonstrate the photon diffusion pattern. Maximal luciferase signals were semiquantified using Living Image 2.5 (Xenogen) and IGOR (Wavemetrics, Lake Oswego, OR) image analysis softwares. Visual output represents the number of photons emitted/second/cm2 as a pseudocolor image where the maximum is red and the minimum is blue. At each time-point a region of interest was generated surrounding each animal (excluding the tail) in order to quantify the total photons emitted by luciferase activity. For each serotype, the mean flux was determined for all the animals at each time-point.
Determination of serum alanine aminotransferase (ALT)
Blood was collected from mice at 35 days of life and analyzed as described (IDEXX Veterinary Services Inc., West Sacramento, CA). The results were pooled and mean and SD calculated.
Vector Biodistribution Analysis
Tissue DNA was extracted using the DNAEasy Kit (Qiagen, Valencia, CA) and quantitated by nanodrop (ND-1000 spectrophotometer, NanoDrop Technologies, Wilmington, DE). SYBR green detection and quantification of vector genomes in DNA was determined in duplicate by performing real-time PCR (MyIQ2, Bio-Rad Laboratories, Hercules, CA) in 96-well plates (plates and TempPlate RT Optical film, both from USA Scientific) as described above using 3 μl of DNA per reaction as template (reaction volume 25 μl; final primer concentration was 125 nM). The efficiency of this PCR reaction is 85.4 to 105.5%. A value of 150 genome copies per 1 ng was used for vector copy number determination. Liver tissue from saline-injected mice (n=3) at each time point was used for non-template controls and demonstrated no amplification.
Statistics
Data was reported as mean ± standard deviation (SD) or mean ± standard error of the mean (SEM) where indicated. Statistical evaluation was performed using the two-tailed t-test. Differences were considered significant at p < 0.05.
There are no financial or personal relationships that exist as potential conflicts of interest with this work.
Results
This study compares 10 natural serotypes of AAV-mediated transgene expression in neonatal mice for the first 100 days of life. Serotypes were assessed according to 1) biodistribution to organs, 2) individual tissue transduction efficiency, 3) vector persistence, and 4) level of and stability of transgene expression in tissues with cellular division and animal growth. The systemic route was chosen to assess serotype tropism and vector biodistribution in neonatal tissues from the constitutive and ubiquitously-expressing CMV enhancer/chicken β-actin (CB) promoter (Fig. 1) with 2 × 10¹⁰ genome copies/mouse. The luciferase transgene was chosen to visualize vector biodistribution in real-time and to examine areas of vector persistence. Using luciferase as a reporter transgene, the transgene-encoded protein was sequentially evaluated allowing for longitudinal data from individual animals.10, 13
Animal growth is rapid in the first 5 weeks of postnatal life
We sought to examine the rate of animal growth in the early postnatal period and into adulthood. We similarly sought to examine the growth of organs that are important targets for the correction of disease. Mice grow at a rapid rate to day 35; after this time the rate of growth slows substantially (Fig. 2). At injection on the 2nd day of life, neonates typically weigh 1.6 grams (g) reaching an average weight of 1.97±0.26g by the fifth day of life. The juvenile mouse at weaning (day 20) weighs 7.0±1.2g, an increase in weight of 4.4 times. At 5 weeks, mice have nearly reached their adult size and have a lean weight of 16.6±3.1g, an increase of 2.4 times. By 70 days of life, adult mice weigh 22.6±3.7g with little increase to 100 days (25.9±4.6g). From birth to 3 ½ months, mice undergo a 16-fold increase in weight.
Figure 2.

Growth of mice after birth. Mice grow most rapidly during the first 5 weeks of life after which the rate of weight gain slows. During this period mouse weight increases 4-fold. Control, saline-injected mice of both genders were compared with AAV-injected mice for evidence of alteration or slower growth rates. (Data is expressed at mean ± SD. n=5 animals at each time point.)
Individual organs also increase greatly over the same time (Fig. 3). In general, organs reach their mature weight by about the end of the 5th week. The brain on the 5th day of life weighs 0.14±0.02g with weights reaching 0.46±0.01g on day 35, 0.48±0.04g at day 70, and 0.47±0.02g at day 100. The GI organs on day 5 (liver 0.05±0.01g, GI tract 0.14±0.03g, pancreas 0.003±0.001g) grow to nearly final adult mass by day 35 (liver 1.06±0.04g, GI tract 2.33±0.16g, pancreas 0.100±0.016g) with little increase to day 70 (liver 1.18±0.07g, GI tract 2.52±0.36g, pancreas 0.163±0.020g) or to day 100 (liver 1.19±0.15g, GI tract 2.59 ± 0.13g, pancreas 0.143± 0.015g).
Figure 3.

Growth of selected organs during the first 100 days of life. A=brain; B=heart, lung; C=GI tract, liver, pancreas; D=kidney (n=5 animals at each time point). (Mean ± SD is presented.)
Thoracic organs demonstrate a similar pattern of growth. On day 5, hearts weigh 0.02±0.01g growing to 0.12±0.02g at day 35, 0.13±0.03g at day 70, and 0.13±0.02 at day 100. The pulmonary parenchyma grows rapidly from day 5 (0.05±0.01g) to day 35 (0.16± 0.01) with little increase in weight from day 70 (0.18±0.06g) to day 100 (0.18±0.03g). While the kidney grows rapidly from day 5 (0.013±0.003) to day 35 (0.144±0.017g), there is continued growth to day 70 (0.178±0.035g) and little thereafter to day 100 (0.180± 0.029g).
AAV is well-tolerated in neonatal mice
All 10 serotypes was well-tolerated by neonatal mice. Six of 226 (2.7%) mice died before they were studied. Three were saline-injected and the other three were AAV-injected (p=ns). One of each of 3 different serotypes died (5, 9, and rh10). Animal development and weight gain over the first 100 days of life demonstrated no differences (p=ns) (Fig. 2).
Absence of vector toxicity with neonatal AAV injection
Alanine aminotransferase (ALT) was examined from plasma of AAV-injected mice on day 35 of life to determine if cellular injury was present and to compare with saline-injected controls. Average ALT values of 30.2±5.8 IU/L (n=5) for AAV-injected mice and 25.2±4.4 IU/L for saline-injected controls (n=5) (reference range 0-82 IU/L) (p=0.16). No evidence of hepatic histological infiltrates or injury was detected at the same time point (data not shown). In addition, no AAV-injected mice upon necropsy demonstrated any evidence of tumors, malignancy, or any other gross pathology (n=220).
In vivo evaluation demonstrates early and widespread expression
A time course plot was generated allowing for analysis of the level of expression in animals injected with each of the 10 serotypes (Fig. 4). The total number of photons/second as total flux was determined at each time point. Mice were imaged from the ventral surface with imaging beginning 72 hours after vector administration (5th day of life) and photon diffusion patterns were acquired. Subsequent images were obtained on day 20, 35, 70 and 100. For all serotypes, expression was detected at the earliest time point and in general, this was the peak as detected by BLI for all serotypes tested in the course of these studies. Highest expression by pseudocolor scale was detected in the liver (Fig. 5 A, B, C, top row [day of life 5]).
Figure 4.
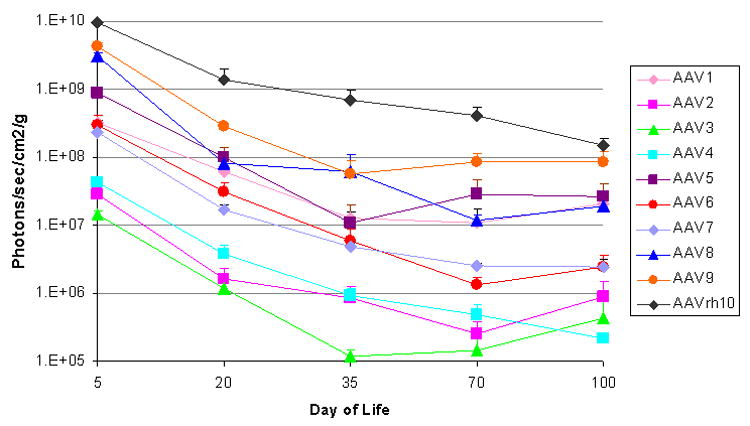
Dynamics of luciferase expression by bioluminescent imaging with animal growth. For each AAV serotype tested the mean total flux was calculated by averaging multiple animals at each time point (n=3-7 per time point). Mean ± SD of total flux emitted from the ventral surface was plotted.)
Figure 5.

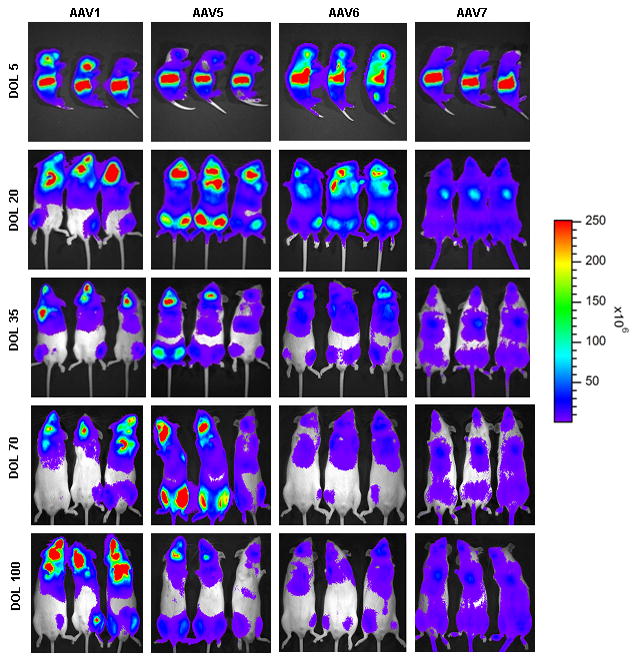
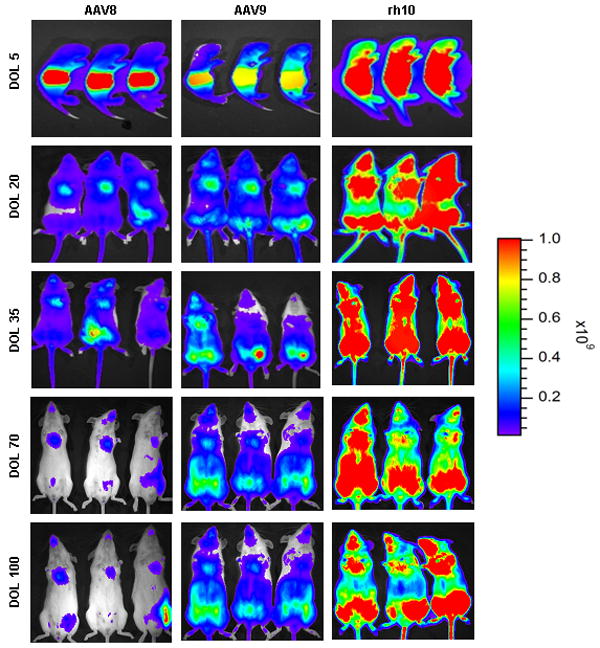
In vivo imaging of firefly luciferase after intravenous injection of AAV on the 2nd day of life demonstrates photon diffusion patterns. The images are shown at 5 days (72 hours after injection), 20 days, 35 days, 70 days, and 100 days of life. (A) Low-expressing group: Serotypes 2, 3, and 4 were classified as low-expressing in comparison to the other serotypes evaluated. Total flux in photons/second was acquired. (B) Medium-expressing group: Serotypes 1, 5, 6, 7 were classified as medium-expressing in comparison to other serotypes evaluated. (C) High-expressing group: Serotypes 8, 9, and rh10 were classified as high-expressing when compared with other serotypes. For all groups, images were acquired with the mice in the ventral position. Images within each group set with the same references such that side-by-side comparison can be made. Note changes in the legend of the pseudocolor scale per group. (n=3-7 animals per group at each time point.)
The photonic emission from the groups of mice of different serotypes was in a broad range over 3 logs allowing for categorization of the serotypes based on whole animal BLI (photon total flux [TF]) on the 5th day of life into 3 groups: high-, medium-, or low-expressing The high-expressing group was AAV8, AAV9, and rh10 (peak expression: 9.97×10⁹ ± 1.41×10⁹ TF, 1.35×10¹⁰ ± 2.22×10⁹ TF, and 3.09×10¹⁰ ± 1.30×10⁹, respectively). The medium-expressing group was AAV1, AAV5, AAV6, and AAV7 (peak expression: 1.03×10⁹ ± 1.04×10⁸ TF, 2.79×10⁹ ± 5.80×10⁸ TF, 9.62×10⁸ ± 3.24×10⁸ TF, and 7.43×10⁸ ± 1.52×10⁸ TF). The low-expressing group was AAV2, AAV3, and AAV4 (peak expression: 9.15×10⁷ ± 4.01×10⁷ TF, 4.68×10⁷ ± 4.21×10⁶ TF, and 1.35×10⁸ ± 1.84×10⁷ TF, respectively). In comparison to AAV2, the order of expression from greatest to lowest was: rh10 (337.7x), AAV9 (147.5x), AAV8 (109.0x), AAV5 (30.5x), AAV1 (11.3x), AAV6 (10.5x), AAV7 (8.1x), AAV4 (1.5x), and AAV3 (0.5x). While expression was detected by BLI on the 5th day of life, it is likely that there was expression that began prior to 72 hours; earlier time points were not examined. No vectors demonstrated any lag or delay in the development of expression post injection. The rh10 vector demonstrated the highest and most widespread expression.
Early expression is followed by a rapid decline in bioluminescence and luminometry
Time courses (Fig. 4) demonstrate that the greatest period of decline in expression occurs over the first 5 weeks; this is the period of rapid growth with a 16-fold increase in weight by the end of the fifth week (Fig. 2). This decline is substantial (graphical data demonstrates a negative slope and images show a substantive loss of red and yellow [higher intensity] areas and more predominant appearance of blue and purple [lower intensity] or areas of no expression); however, afterwards to day 100 whole animal BLI time course demonstrates that the decline in expression is less than what occurs over the first 5 weeks of postnatal life. During these first 100 days, though, the high expressing group declined by 11.5-fold, the medium expressing group by 8.3-fold, and the low expressing group by 10.6-fold (Table 1). In comparison to AAV2, the residual expression at 100 days from greatest to lowest was: rh10 (169.9x), AAV9 (94.8x), AAV5 (29.7x), AAV1 (22.9x), AAV8 (21.5x), AAV7 (2.8x), AAV6 (2.7x), AAV3 (0.5x), and AAV4 (0.2x). With AAV2 and AAV3, the largest amount of residual expression persisted in the heart. AAV4, with minimal expression, had persistent luciferase expression in the liver and heart. AAV1 had residual expression most prominent in the lung, heart, and brain, while with AAV5 expression persisted in the kidney, heart, and brain. Residual expression remained in the skeletal muscle and heart with AAV6 and AAV7 while with AAV8, AAV9, and AAV rh10, the greatest residual expression remained in the skeletal muscle, heart, lung, and liver. (Data of serotypes and magnitude of residual expression in different tissues using serotype 2 as the reference serotype is summarized in Table 2.)
Table 1.
Decline in bioluminescent imaging from day 5 to day 100 with each AAV serotype.
| AAV1 | 2.0 |
| AAV2 | 4.0 |
| AAV3 | 4.2 |
| AAV4 | 23.8 |
| AAV5 | 4.1 |
| AAV6 | 15.2 |
| AAV7 | 11.8 |
| AAV8 | 20.4 |
| AAV9 | 6.2 |
| AAVrh10 | 7.9 |
(Numbers represent fold-decline from maximum on the 5th day of life.)
Table 2.
Comparison of residual expression at 100 days of the ten serotypes of AAV studied using AAV2 as the reference serotype.
| 100 days | AAV2/1 | AAV2/2 | AAV2/3 | AAV2/4 | AAV2/5 | AAV2/6 | AAV2/7 | AAV2/8 | AAV2/9 | 2/rh10 |
|---|---|---|---|---|---|---|---|---|---|---|
| Brain | 0.5 | 1.0 | 0.3 | 3.5 | 0.3 | 0.3 | 5.0 | 30.5 | 27.0 | 1667.8 |
| Heart | 35.2 | 1.0 | 0.0 | 2.9 | 1.0 | 11.6 | 43.1 | 282.4 | 102.7 | 547.4 |
| Intestine | 3327.3 | 1.0 | 49.2 | 407.3 | 116.7 | 464.5 | 5400.1 | 16704.7 | 1343.0 | 49069.0 |
| Kidney | 3.2 | 1.0 | 0.0 | 1.2 | 0.5 | 1.0 | 13.3 | 44.1 | 148.3 | 209.9 |
| Liver | 0.2 | 1.0 | 0.1 | 0.3 | 1.2 | 0.6 | 1.2 | 18.0 | 18.5 | 147.1 |
| Lung | 64.9 | 1.0 | 0.3 | 13.7 | 10.8 | 51.1 | 64.1 | 595.3 | 495.1 | 8336.8 |
| Skeletal Muscle | 32.9 | 1.0 | 0.0 | 3.7 | 2.5 | 39.8 | 131.6 | 1893.8 | 4000.1 | 12918.8 |
| Pancreas | 3.6 | 1.0 | 0.2 | 40.5 | 5.9 | 9.2 | 34.9 | 221.9 | 125.7 | 2021.8 |
While tissue luminometric studies involve different animals at each time point (unlike longitudinal studies with BLI), examination of tissues demonstrated a general decline in transgene protein expression. The pattern of this decline segregated tissues: 1) those with a rapid decline from day 5 to 35 with subsequent slowing to day 100 (liver, lung, intestine, pancreas, and kidney) and 2) those with a minimal decline from day 5 to 100 (brain, skeletal muscle, and heart) with some stability thereafter; these tissues were postmitotic at birth. (All units per μg protein.)
Brain
At day 5, the highest expression was rh10 with 4.23±1.01 pg luciferase, followed by AAV8 (0.206±0.072 pg), and AAV9 (0.149±0.078 pg). The lowest was with AAV5 (1.11 fg luciferase). Serotypes 1, 4, and 6 demonstrated substantial declines in transgene protein to day 100, while serotypes 2, 3, 7, 8, 9, and rh10 demonstrated relatively stable expression (Fig. 6A).
Figure 6.
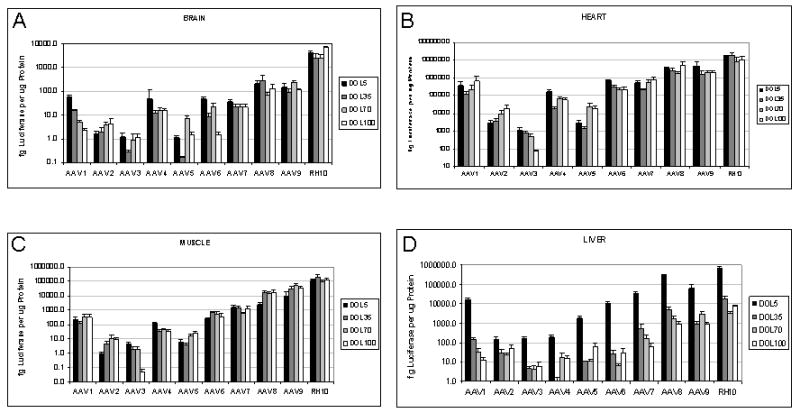

Luciferase expression profile in selected tissues over time from the panel of AAV serotypes (A=brain, B=heart, C=skeletal muscle, D=liver, E=intestine, F=pancreas, G=lung, H=kidney). The levels of luciferase protein in femtograms per microgram total protein were determined from mouse tissues after intravenous injection of AAV on the 2nd through 100 days of life. (Mean ± SEM is presented. N=5 animals at each time point.)
Cardiac and Skeletal Muscle
Muscle demonstrated relatively stable transgene expression from day 5 to 100 regardless of serotype or cellular origin with the exception of AAV3 where decline was present in both tissues at day 100. While AAV6 is often reported to have a tropism for skeletal muscle, the highest expression at 100 days was with AAV8 (17.2±8.4 pg), AAV9 (36.2±6.3 pg), and rh10 (117.1±46.6 pg); AAV6 was 0.36±0.20 pg. Highest expression at 100 days in hearts was demonstrated with AAV8 (546.0±258.5 pg), AAV9 (198.6±60.3 pg), and rh10 (1,058.5±512.3 pg). AAV3 demonstrated the lowest expression in both tissues (0.046±0.026 fg [skeletal muscle], 8.03±0.99 fg [cardiac]) at day 100 (Fig. 6 B and C).
Liver
The liver demonstrated expression ranging from 151.8±37.8 fg with AAV2 to 697.3±1.0 pg with rh10. Unlike brain and muscle, expression over the following 5 weeks declined substantially; at day 35, luciferase from AAV2 transduction was 27.2±17.0 fg while rh10 had declined to 17.9±5.5 pg. In general expression declined but at a slower rate from day 35 to 100. Serotypes 8, 9, and rh10 demonstrated the highest expression at all time points while 3 and 4 had the lowest residual expression (Fig. 6D).
GI Tract and Pancreas
The digestive organs demonstrated a similar pattern of decline as hepatocytes. In both, expression was highest on the fifth day of life with rh10 (intestine 20.2±9.4 pg, pancreas 239.0±23.5 pg) and declined substantially to day 35 (intestine 0.047±0.029 pg, pancreas 0.254±0.110 pg). Similar to the liver, continued decline persisted albeit at a much slower rate from day 35 to 100 (intestine 0.016±0.004 pg, pancreas 0.113±0.065 pg) (Fig. 6E and F).
Lung
The lung shows a pattern of higher expression at day 5 with, in general, a decline in expression with growth. Similar to other organs, serotype rh10 produced the greatest expression early (5th day of life, 90.6±16.0 pg), followed by AAV9 (4.3±2.4 pg) and AAV8 (3.7±0.8 pg); these serotypes had the highest expression at later time points (Fig. 6G).
Kidney
Similar to hepatocytes, GI tract, and pancreas, the kidney demonstrates highest expression at day 5, a rapid decline to day 35, followed by a much slower decline to day 100. Highest expression at day 5 was with rh10 (9.26±1.62) pg, AAV8 (1.62±0.22 pg), and AAV4 (0.50±0.15 pg). Highest expression at day 100 was with rh10 (0.055±0.007 pg), AAV9 (0.039±0.013 pg), and AAV8 (0.011±0.002 pg) (Fig. 6H).
Vector copy number in tissues decreases with organ growth
We examined two tissues for vector stability (Table 3). Liver was chosen as a mitotically active tissue and skeletal muscle as it is post-mitotic at birth with growth occurring by an increase in cellular size without cytokinesis. While both tissues demonstrated efficient transduction early after neonatal administration with loss of vector genomes with animal growth, the loss of vector genomes from hepatocytes was substantially greater than muscle. Analysis demonstrated that the highest expressing vectors had in general the highest number of genome copies per hepatocyte at day 5 (AAV8, AAV9, and AAVrh10). In muscle, rh10 demonstrated the greatest expression of luciferase on the 5th day of life and had the highest copy number per cell.
Table 3.
Copy number of vector DNA in tissues over time following intravenous administration of 2 × 10¹⁰ genome copies of AAV.CB.Luciferase.
| Liver | AAV2/1 | AAV2/2 | AAV2/3 | AAV2/4 | AAV2/5 | AAV2/6 | AAV2/7 | AAV2/8 | AAV2/9 | 2/rh10 |
|---|---|---|---|---|---|---|---|---|---|---|
| DOL 5 | 37.101±9.391 | 18.725±2.007 | 73.741±34.883 | 2.254±1.644 | 28.004±8.597 | 4.014±1.528 | 22.722±10.777 | 56.782±25.790 | 48.977±23.577 | 292.126±95.629 |
| DOL70 | 0.031±0.006 | 0.013±0.000 | 0.035±0.004 | 0.007±0.004 | 0.014±0.006 | 0.014±0.006 | 0.012±0.003 | 0.124±0.042 | 0.114±0.044 | 1.699±0.950 |
| DOL100 | 0.012±0.006 | 0.003±0.001 | 0.005±0.001 | < 1 in 1000 | 0.009±0.003 | 0.002±0.000 | 0.014±0.007 | 0.071±0.024 | 0.095±0.032 | 0.512±0.116 |
| Muscle | AAV2/1 | AAV2/2 | AAV2/3 | AAV2/4 | AAV2/5 | AAV2/6 | AAV2/7 | AAV2/8 | AAV2/9 | 2/rh10 |
| DOL 5 | 4.542±2.770 | 1.331±0.135 | 3.403±2.314 | 2.502±0.459 | 0.542±0.257 | 0.446±0.081 | 3.832±1.253 | 0.732±0.258 | 3.148±1.461 | 19.810±4.169 |
| DOL70 | 0.050±0.007 | 0.065±0.026 | 0.041±0.003 | <1 in 1000 | 0.033±0.009 | 0.072±0.028 | 0.261±0.159 | 0.040±0.015 | 0.240±0.061 | 1.092±0.212 |
| DOL100 | 0.131±0.008 | 0.159±0.017 | 0.148±0.124 | 0.044±0.034 | 0.028±0.028 | 0.063±0.037 | 0.341±0.111 | 0.146±0.119 | 0.140±0.005 | 1.196±0.211 |
Abbreviations: AAV, adeno-associated virus; DOL, day of life.
Determined by quantitative PCR of transgene firefly luciferase, according to standards generated with pEF1α-luciferase12. The mean ± SD (n=3) are shown for each vector in each tissue.
Liver demonstrated a decline in genome copy number with growth and with cellular division, demonstrating a substantial decline from day 5 to day 70 (Table 3); copy number declined more than 2 logs with each serotype (to a range of ~0.01 to 1.7 copy per cell). With all serotypes, luciferase expression demonstrated a concomitant decline (Fig. 6) from day 5 of life to day 35. While some variation was present, hepatic luciferase expression and copy per hepatocyte remained relatively stable from day 70 to day 100 of life (Fig. 6D and Table 3).
Stability of copy number in skeletal muscle was different. While initial transduction was less than that of hepatocytes, the decline in copy number per myocyte was generally between 1 and 2 logs from day 5 to 70, unlike hepatocytes where the decline was greater than 2 logs. With most serotypes, luciferase expression remained relatively stable after the early growth period unlike hepatocytes (Fig. 6B). There were no differences in copy number related to gender (data not shown).
Discussion
The current study examined 10 natural serotypes of AAV in the neonatal mouse, the transduction efficiency and biodistribution, level of expression in multiple tissues, and the stability of expression as neonatal mice grow and enter early adult life. The main finding is that rh10 was superior to the other serotypes in transduction of tissues, level of expression, and maintenance of expression and copy number in both mitotically active and postmitotic tissues in neonates with vector administration shortly after birth. In addition, these studies demonstrate that 1) high-levels of transduction are possible with AAV for neonatal gene transfer; 2) multiple tissues are transduced including the brain; 3) no untoward effects are detected and mice tolerate the injection when administered in early postnatal life; and 4) there is a rapid decline in vector number and gene expression during the first 5 weeks after administration, greater with mitotically active than with post-mitotic tissues; while there is some decline from day 70 to day 100, copy number and expression are generally much more stable after the initial rapid growth in the neonatal period.
A number of reports suggest that there are advantages to initiating gene therapy in the neonate.14-19 These include: 1) gene expression may avoid the development of irreversible pathology; 2) the earlier vector is administered, the greater the vector to cell ratio allowing for less vector administration; 3) stem and progenitor cells, likely less accessible later in life, may be more easily transduced; and 4) immune responses may be reduced or absent.18 A number of animal models have been treated in the neonatal period with encouraging results, including Crigler-Najjar syndrome20, mucopolysaccharidosis type VII21-23, Pompe’s Disease24, the hemophilias, 15, 25-27 and spinal muscular atrophy.6, 15, 25-27
Many diseases that potentially could be treated by gene-based therapies would require in utero or early postnatal administration to have maximum efficacy at preventing long-term sequelae. Few studies have examined the administration and persistence of viral gene therapy vectors in the context of in vivo cellular proliferation associated with growth and maturation of tissues;14 however, it has been demonstrated that in adult mice, loss of episomal genomes, the primary source of rAAV-mediated gene expression28, does occur with cell division29-30 and proliferation after hepatic resection.28, 31-32 While adult animals have relatively low rates of cellular turnover, the rapid proliferation in the early neonatal period make the potential for therapeutic gene replacement strategies with episomal vectors more challenging. For example, the average human newborn infant weighs 3.4 kg33-34 at birth (95% weighing between 2.5 kg and 4.6 kg34) and will generally double its birth weight by five months and triple it by one year.35 Over the first 8 to 9 months of life the human liver doubles in mass and over the subsequent 3 to 4 years a second doubling occurs.14, 36 While integrating vectors may be able to overcome limitations of vector loss that are likely to occur in humans as detected in mice, concerns of oncogenesis and insertional mutagenesis remain.37-38 Vectors based on AAV are capable of achieving both persistent and high-level gene transfer in multiple adult tissues7, 39 and have shown promise in treating a number of genetic diseases in adult animal models.
In this study gene transfer into neonatal mice by all serotypes was efficient, well-tolerated, without evidence of pathology, and while gene expression was persistent at some level in many tissues, loss of genomes and transgene expression corresponded to both tissue and animal growth. We detect differences in the persistence with different serotypes, and differences in which organs maintain persistence of expression with rh10 having the highest level of expression at all time points. One explanation for the differences in vector persistence may have to do differences in initial transduction and differences in the efficiency of or kinetics of viral uncoating; serotype DNA that uncoats in the perinuclear region or in the nucleus itself may persist longer than serotypes that uncoat in the cytoplasm.15
Intravenous administration demonstrated early onset of expression with all ten serotypes, unlike the lag in expression reported when serotypes are administered to adult mice.7, 40-43 These vectors are pseudotyped with the same inverted terminal repeats and thus it is unlikely that differences in second strand synthesis themselves is the cause; rather it likely involves the efficiency and rate of viral uncoating,43 which is seemingly serotype-and cell-specific in this environment of rapidly proliferating and growing cells. The increase in transduction observed by some serotypes is presumptively attributable to capsid ligands that display a strong affinity for a number of tissues leading to internalization and nuclear uncoating, both key determinants to transduction.44
A number of studies have examined comparative tropism of AAV serotypes in adult tissues. AAV7, 8, 9, and rh10 transduce neurons in the cortex, striatum, hippocampus, and thalamus.45 AAV7 and 8 demonstrate transgene expression at least 2 logs higher than that of AAV2 in the liver.46-47 AAV7 has been found to be equivalent to AAV1 for muscle gene expression48 while AAV6 was demonstrated to transduce skeletal muscle with a 500-fold higher transduction efficiency than AAV2.49 AAV9 has been determined to be superior to serotypes 1, 6, 7, and 8 in cardiac transduction.50 However, few if any studies have examined comparative tropism in the neonate.
In these studies in neonates the serotypes segregated into three groups based on expression: low, 2, 3, and 4; medium, 1, 5, 6, and 7; and high, 8, 9, and rh10. AAV rh10 provided the greatest level of expression of all serotypes; AAV3 and AAV4 demonstrated the lowest. Vector loss in mitotically active (i.e. liver) and post-mitotic (i.e. skeletal muscle) tissues was assessed by real time PCR analysis. Abundance of vector of all serotypes was higher in the liver compared to muscle. Both tissues demonstrated a rapid decline in copy number to day 70 with greater than a 2 log loss in liver; copy number in both tissues demonstrated greater stability afterwards. These results demonstrate that developing, mitotically-active tissues and organs where initial transgene expression may be high lose episomally-located genomes during this period resulting in a rapid decline in expression despite efficient initial transduction.
While a study in adult mice with intravenous administration of serotypes 1 through 9 found that the most common organ transduced was the liver,7 in the studies conducted herein the heart was the most commonly transduced. Highest overall levels were achieved by rh10, followed by AAV9 and 8, and then 1, 6, and 7 which were somewhat lower. Other studies with AAV expressing β-galactosidase in neonatal mice also demonstrated the superiority of AAV9 and 8 when compared with AAV2.17 In adult mice by tail vein injection, the highest expression was detected with AAV9 followed by 6, 8, and 4.7 In adult rats with direct cardiac muscle injection of AAV-LacZ, the expression pattern was very similar with AAV8 demonstrating the greatest expression followed by AAV 6, 1, and 7; these latter studies did not include AAV9 or rh10.
The liver was also highly transduced in neonatal mice. Serotypes 1, 7, 8, 9, and rh10 demonstrated the highest levels of expression by day 5 with serotypes 8, 9, and rh10 maintaining the highest level of expression at day 100. In adult intravenous administration7, AAV9 and 7, followed by AAV6, had the highest expression in the liver. AAV2, while low-expressing, had its greatest expression in the liver, about 30 times that of the heart. AAV5 expression overall was very low throughout tissues with its highest expression in the liver.
In the adult mouse, hepatocytes are replaced slowly: once every 180-400 days.51-52 This allows for long-term AAV-mediated transgene expression that results in stable persistence of transcriptional active vector genomes that remain episomal or are in an integrated form.28, 53 Kay and colleagues28 and Song and others54 performed a partial hepatectomy in mice that had undergone portal vein administration of AAV to quantify the extent of vector integration under conditions of cellular division in vivo. These studies, where the liver will have undergone one doubling in the processs of regeneration, suggest that only 10% or less of AAV genomes have integrated and that under conditions of rapid cellular division the majority of vector genomes remaining in extrachromosomal forms are lost. In the neonatal liver, where hepatocytes are mitotically active, vector copy number for all serotypes declined by greater than 2 logs when the liver increased in mass from 0.05g to 1.18g during the first 10 weeks of life. It is likely that initial expression after neonatal AAV administration is from both integrated and episomal vector genomes and that with cellular division a very large percentage of episomal genomes are lost and that the expression in the slowly replicating or stable cells when adult size is reached is ultimately from integrated forms of AAV.
While some decline can be accounted for by simple dilution in mitotically active tissues, the significance of the decline suggests that this may be more than dilution itself; while the exact cause and mechanism are not known, this does suggest that active degradation14 or loss with cellular division is occurring during the rapid proliferative phase and slows substantially thereafter. This decline due to cell growth and loss of episomes over time is additive with vector dilution resulting in increased loss in mitotically active tissues. The decline in genomes in postmitotic tissues is less and suggests that the process that leads to vector loss may be less active. While the administration of vector in adult animals where the majority of vector genomes, and thus the origin of transgene expression, results from stable extrachromosomal forms28, the neonate is likely very different where these extrachromosomal forms are lost early with animal growth. While this area has not been extensively explored, one study suggests that integration in neonatal liver may be as high as 2.5%.14 Our data suggest that after the rapid decline in genome copy number in the neonatal period, stable AAV copies are approximately 3-11% in skeletal muscle and may be as low as 0.2% in the liver.
There are limitations to the current investigation. In order to determine the expression of luciferase in individual tissues, we euthanized mice at each time point. For whole animal quantitative studies, bioluminescent imaging (BLI) was performed and these were longitudinal: the same animals were imaged over the length of the investigation. While in aggregate this should result in data that is comparable between whole animal and individual tissue expression, it is possible that if there is substantial variability in individual tissues between animals this may not result in complete correlation. In addition, growth of animals affects light emission by BLI. Five-day-old mice are hairless with thin skin and minimal extravisceral fat resulting in efficient tissue penetration by light. With development and hair growth, some photonic emission may not escape to reach the camera. Thus, there may be some loss in ability to detect expression in its entirety when obscured by overlying developed tissues and calcified skeleton. Thus, we employed both BLI and tissue luminometry to attempt to overcome these limitations.
The skeletal muscle studies demonstrate some interesting findings. Luminometry in all serotypes, except AAV3, reveal relative stability of expression while the copy number declines from day 5 to day 70 with animal growth; copy number is generally stable thereafter. Expression in skeletal muscle with some serotypes is exceedingly low (at day 100, <10 fg luciferase per μg total protein for AAV2 and 3, and <100 fg luciferase per μg total protein for AAV4 and 5) but with all ten expression persists for the duration of these studies. The precise etiology of the lack of correlation of luminometric expression in skeletal muscle with a decline in genome copy numbers in this tissue is not known. This may have to do with potentially different rates of uncoating in different tissues as skeletal myocytes, unlike hepatocytes and many other tissues, are multinucleated with a large cytoplasm to nucleus ratio. A larger loss of vector before uncoating might explain this. The analysis in these studies begins on the 5th day of life, only 72 hours after injection when it is likely that many virions have yet to uncoat and be functional in luciferase expression. Studies have demonstrated in adult animals that AAV transgene expression is characterized by a lag phase in part due to a delay in uncoating and conversion of single-stranded vector genomes by second strand synthesis; this can be up to 5 weeks with AAV2.43, 53 The rate of uncoating in neonates and in different neonatal tissues undergoing rapid growth has not been determined.
The findings and challenges to establishing high-level transgene expression described in these studies are important if neonatal gene therapy is to be considered for humans. While the results suggest that long-term expression and gene persistence is possible, both genome copy number and subsequent transgene expression decrease with time and cellular division, greatest in the neonatal period. Of the serotypes examined, rh10 provided the highest expression and greatest stability of expression, and while copy number did decline substantially with animal growth, maintained the greatest copy of vector genomes in both mitotic and post-mitotic tissues. While the rate of cellular doubling and organ growth may not be the same in humans, the concept of treating an individual while a neonate before reaching the size of an adult is no different; both undergo organ growth and cellular proliferation.
If data from mice can be extrapolated to humans, we could expect a significant decline in genome copy number and expression during the first year of life if episomal gene replacement strategies are initiated in the neonate. While many genetic diseases that could be treated beginning in the neonatal period will likely require high-level persistent expression for sustained therapeutic benefit, the episomal genome copy loss with growth and development may lead to failure of therapy and re-emergence of the original phenotype as has been seen in at least one animal model treated with a helper-dependent (non-integrating) adenoviral vector.55 Thus, in order to maintain gene expression at an appropriate level for treating genetic disease, it may be necessary to augment expression with subsequent vector administration(s) later in life. While this is an area of active investigation, this may be possible if immunologic tolerance has been established to the transgene encoded protein which has been suggested by our laboratory55 and other investigators.23
Acknowledgments
This work was supported by grants from the National Institutes of Health (5K08HD057555-03 and 3KO8HD057555-03S1) and from the Stein-Oppenheimer Foundation to G.S.L. The authors thank Joseph Springer, Robin Rosenblatt, and Fides Lay for their expert technical assistance.
References
- 1.Grimm D, Zhou S, Nakai H, Thomas CE, Storm TA, Fuess S, et al. Preclinical in vivo evaluation of pseudotyped adeno-associated virus vectors for liver gene therapy. Blood. 2003;102(7):2412–9. doi: 10.1182/blood-2003-02-0495. [DOI] [PubMed] [Google Scholar]
- 2.Song Y, Lou HH, Boyer JL, Limberis MP, Vandenberghe LH, Hackett NR, et al. Functional cystic fibrosis transmembrane conductance regulator expression in cystic fibrosis airway epithelial cells by AAV6.2-mediated segmental trans-splicing. Hum Gene Ther. 2009;20(3):267–81. doi: 10.1089/hum.2008.173. [DOI] [PMC free article] [PubMed] [Google Scholar]
- 3.Katakura S, Jennings K, Watanabe S, Adachi E, Thornton S, Gao GP, et al. Recombinant adeno-associated virus preferentially transduces human, compared to mouse, synovium: implications for arthritis therapy. Mod Rheumatol. 2004;14(1):18–24. doi: 10.1007/s10165-003-0260-7. [DOI] [PubMed] [Google Scholar]
- 4.Simonelli F, Maguire AM, Testa F, Pierce EA, Mingozzi F, Bennicelli JL, et al. Gene therapy for Leber’s congenital amaurosis is safe and effective through 1.5 years after vector administration. Mol Ther. 2010;18(3):643–50. doi: 10.1038/mt.2009.277. [DOI] [PMC free article] [PubMed] [Google Scholar]
- 5.Arruda VR, Stedman HH, Haurigot V, Buchlis G, Baila S, Favaro P, et al. Peripheral transvenular delivery of adeno-associated viral vectors to skeletal muscle as a novel therapy for hemophilia B. Blood. 2010 doi: 10.1182/blood-2009-12-261156. [DOI] [PMC free article] [PubMed] [Google Scholar]
- 6.Foust KD, Wang X, McGovern VL, Braun L, Bevan AK, Haidet AM, et al. Rescue of the spinal muscular atrophy phenotype in a mouse model by early postnatal delivery of SMN. Nat Biotechnol. 2010;28(3):271–4. doi: 10.1038/nbt.1610. [DOI] [PMC free article] [PubMed] [Google Scholar] [Retracted]
- 7.Zincarelli C, Soltys S, Rengo G, Rabinowitz JE. Analysis of AAV serotypes 1-9 mediated gene expression and tropism in mice after systemic injection. Mol Ther. 2008;16(6):1073–80. doi: 10.1038/mt.2008.76. [DOI] [PubMed] [Google Scholar]
- 8.Cearley CN, Vandenberghe LH, Parente MK, Carnish ER, Wilson JM, Wolfe JH. Expanded repertoire of AAV vector serotypes mediate unique patterns of transduction in mouse brain. Mol Ther. 2008;16(10):1710–8. doi: 10.1038/mt.2008.166. [DOI] [PMC free article] [PubMed] [Google Scholar]
- 9.Palomeque J, Chemaly ER, Colosi P, Wellman JA, Zhou S, Del Monte F, et al. Efficiency of eight different AAV serotypes in transducing rat myocardium in vivo. Gene Ther. 2007;14(13):989–97. doi: 10.1038/sj.gt.3302895. [DOI] [PubMed] [Google Scholar]
- 10.Lipshutz GS, Gruber CA, Cao Y, Hardy J, Contag CH, Gaensler KM. In utero delivery of adeno-associated viral vectors: intraperitoneal gene transfer produces long-term expression. Mol Ther. 2001;3(3):284–92. doi: 10.1006/mthe.2001.0267. [DOI] [PubMed] [Google Scholar]
- 11.Xiao X, Li J, Samulski RJ. Production of high-titer recombinant adeno-associated virus vectors in the absence of helper adenovirus. J Virol. 1998;72(3):2224–32. doi: 10.1128/jvi.72.3.2224-2232.1998. [DOI] [PMC free article] [PubMed] [Google Scholar]
- 12.Nguyen AT, Dow AC, Kupiec-Weglinski J, Busuttil RW, Lipshutz GS. Evaluation of gene promoters for liver expression by hydrodynamic gene transfer. J Surg Res. 2008;148(1):60–6. doi: 10.1016/j.jss.2008.02.016. [DOI] [PMC free article] [PubMed] [Google Scholar]
- 13.Wu JC, Sundaresan G, Iyer M, Gambhir SS. Noninvasive optical imaging of firefly luciferase reporter gene expression in skeletal muscles of living mice. Mol Ther. 2001;4(4):297–306. doi: 10.1006/mthe.2001.0460. [DOI] [PubMed] [Google Scholar]
- 14.Cunningham SC, Dane AP, Spinoulas A, Logan GJ, Alexander IE. Gene delivery to the juvenile mouse liver using AAV2/8 vectors. Mol Ther. 2008;16(6):1081–8. doi: 10.1038/mt.2008.72. [DOI] [PubMed] [Google Scholar]
- 15.Sabatino DE, Mackenzie TC, Peranteau W, Edmonson S, Campagnoli C, Liu YL, et al. Persistent expression of hF.IX After tolerance induction by in utero or neonatal administration of AAV-1-F.IX in hemophilia B mice. Mol Ther. 2007;15(9):1677–85. doi: 10.1038/sj.mt.6300219. [DOI] [PubMed] [Google Scholar]
- 16.Kyosen SO, Iizuka S, Kobayashi H, Kimura T, Fukuda T, Shen J, et al. Neonatal gene transfer using lentiviral vector for murine Pompe disease: long-term expression and glycogen reduction. Gene Ther. 2010;17(4):521–30. doi: 10.1038/gt.2009.160. [DOI] [PubMed] [Google Scholar]
- 17.Pacak CA, Mah CS, Thattaliyath BD, Conlon TJ, Lewis MA, Cloutier DE, et al. Recombinant adeno-associated virus serotype 9 leads to preferential cardiac transduction in vivo. Circ Res. 2006;99(4):e3–9. doi: 10.1161/01.RES.0000237661.18885.f6. [DOI] [PubMed] [Google Scholar]
- 18.Waddington SN, Kennea NL, Buckley SM, Gregory LG, Themis M, Coutelle C. Fetal and neonatal gene therapy: benefits and pitfalls. Gene Ther. 2004;11(Suppl 1):S92–7. doi: 10.1038/sj.gt.3302375. [DOI] [PubMed] [Google Scholar]
- 19.Ponder KP. Immunology of neonatal gene transfer. Curr Gene Ther. 2007;7(5):403–10. doi: 10.2174/156652307782151434. [DOI] [PubMed] [Google Scholar]
- 20.Takahashi M, Ilan Y, Chowdhury NR, Guida J, Horwitz M, Chowdhury JR. Long term correction of bilirubin-UDP-glucuronosyltransferase deficiency in Gunn rats by administration of a recombinant adenovirus during the neonatal period. J Biol Chem. 1996;271(43):26536–42. doi: 10.1074/jbc.271.43.26536. [DOI] [PubMed] [Google Scholar]
- 21.Xu L, Haskins ME, Melniczek JR, Gao C, Weil MA, O’Malley TM, et al. Transduction of hepatocytes after neonatal delivery of a Moloney murine leukemia virus based retroviral vector results in long-term expression of beta-glucuronidase in mucopolysaccharidosis VII dogs. Mol Ther. 2002;5(2):141–53. doi: 10.1006/mthe.2002.0527. [DOI] [PubMed] [Google Scholar]
- 22.Xu L, Mango RL, Sands MS, Haskins ME, Ellinwood NM, Ponder KP. Evaluation of pathological manifestations of disease in mucopolysaccharidosis VII mice after neonatal hepatic gene therapy. Mol Ther. 2002;6(6):745–58. doi: 10.1006/mthe.2002.0809. [DOI] [PubMed] [Google Scholar]
- 23.Ponder KP, Melniczek JR, Xu L, Weil MA, O’Malley TM, O’Donnell PA, et al. Therapeutic neonatal hepatic gene therapy in mucopolysaccharidosis VII dogs. Proc Natl Acad Sci U S A. 2002;99(20):13102–7. doi: 10.1073/pnas.192353499. [DOI] [PMC free article] [PubMed] [Google Scholar]
- 24.Mah C, Cresawn KO, Fraites TJ, Jr, Pacak CA, Lewis MA, Zolotukhin I, et al. Sustained correction of glycogen storage disease type II using adeno-associated virus serotype 1 vectors. Gene Ther. 2005;12(18):1405–9. doi: 10.1038/sj.gt.3302550. [DOI] [PubMed] [Google Scholar]
- 25.VandenDriessche T, Vanslembrouck V, Goovaerts I, Zwinnen H, Vanderhaeghen ML, Collen D, et al. Long-term expression of human coagulation factor VIII and correction of hemophilia A after in vivo retroviral gene transfer in factor VIII-deficient mice. Proc Natl Acad Sci U S A. 1999;96(18):10379–84. doi: 10.1073/pnas.96.18.10379. [DOI] [PMC free article] [PubMed] [Google Scholar]
- 26.Xu L, Gao C, Sands MS, Cai SR, Nichols TC, Bellinger DA, et al. Neonatal or hepatocyte growth factor-potentiated adult gene therapy with a retroviral vector results in therapeutic levels of canine factor IX for hemophilia B. Blood. 2003;101(10):3924–32. doi: 10.1182/blood-2002-10-3050. [DOI] [PubMed] [Google Scholar]
- 27.Zhang J, Xu L, Haskins ME, Parker Ponder K. Neonatal gene transfer with a retroviral vector results in tolerance to human factor IX in mice and dogs. Blood. 2004;103(1):143–51. doi: 10.1182/blood-2003-06-2181. [DOI] [PubMed] [Google Scholar]
- 28.Nakai H, Yant SR, Storm TA, Fuess S, Meuse L, Kay MA. Extrachromosomal recombinant adeno-associated virus vector genomes are primarily responsible for stable liver transduction in vivo. J Virol. 2001;75(15):6969–76. doi: 10.1128/JVI.75.15.6969-6976.2001. [DOI] [PMC free article] [PubMed] [Google Scholar]
- 29.Malik P, McQuiston SA, Yu XJ, Pepper KA, Krall WJ, Podsakoff GM, et al. Recombinant adeno-associated virus mediates a high level of gene transfer but less efficient integration in the K562 human hematopoietic cell line. J Virol. 1997;71(3):1776–83. doi: 10.1128/jvi.71.3.1776-1783.1997. [DOI] [PMC free article] [PubMed] [Google Scholar]
- 30.Flotte TR. Adeno-associated virus-based gene therapy for inherited disorders. Pediatr Res. 2005;58(6):1143–7. doi: 10.1203/01.pdr.0000189226.03684.fe. [DOI] [PubMed] [Google Scholar]
- 31.Grimm D, Pandey K, Nakai H, Storm TA, Kay MA. Liver transduction with recombinant adeno-associated virus is primarily restricted by capsid serotype not vector genotype. J Virol. 2006;80(1):426–39. doi: 10.1128/JVI.80.1.426-439.2006. [DOI] [PMC free article] [PubMed] [Google Scholar]
- 32.Conlon TJ, Cossette T, Erger K, Choi YK, Clarke T, Scott-Jorgensen M, et al. Efficient hepatic delivery and expression from a recombinant adeno-associated virus 8 pseudotyped alpha1-antitrypsin vector. Mol Ther. 2005;12(5):867–75. doi: 10.1016/j.ymthe.2005.05.016. [DOI] [PubMed] [Google Scholar]
- 33.Parsons TJ, Power C, Manor O. Fetal and early life growth and body mass index from birth to early adulthood in 1958 British cohort: longitudinal study. BMJ. 2001;323(7325):1331–5. doi: 10.1136/bmj.323.7325.1331. [DOI] [PMC free article] [PubMed] [Google Scholar]
- 34.Nelson WE. Growth and Development in the Infant and Child. In: Nelson WE, editor. Textbook of Pediatrics. 8. W.B Saunders Company; Philadelphia: 1964. p. 21. [Google Scholar]
- 35.Nelson WE. Growth and Development in the Infant and the Child. In: Nelson WE, editor. Textbook of Pediatrics. W.B Saunders Company; Philadelphia: 1964. p. 24. [Google Scholar]
- 36.Stocker JT, Dehner LP. Pediatric Pathology. Lippincott, Williams and Wilkins; Philadephia: 2002. [Google Scholar]
- 37.Hacein-Bey-Abina S, Garrigue A, Wang GP, Soulier J, Lim A, Morillon E, et al. Insertional oncogenesis in 4 patients after retrovirus-mediated gene therapy of SCID-X1. J Clin Invest. 2008;118(9):3132–42. doi: 10.1172/JCI35700. [DOI] [PMC free article] [PubMed] [Google Scholar]
- 38.Hacein-Bey-Abina S, Von Kalle C, Schmidt M, McCormack MP, Wulffraat N, Leboulch P, et al. LMO2-associated clonal T cell proliferation in two patients after gene therapy for SCID-X1. Science. 2003;302(5644):415–9. doi: 10.1126/science.1088547. [DOI] [PubMed] [Google Scholar]
- 39.Wang L, Wang H, Bell P, McCarter RJ, He J, Calcedo R, et al. Systematic evaluation of AAV vectors for liver directed gene transfer in murine models. Mol Ther. 2010;18(1):118–25. doi: 10.1038/mt.2009.246. [DOI] [PMC free article] [PubMed] [Google Scholar]
- 40.Snyder RO, Miao CH, Patijn GA, Spratt SK, Danos O, Nagy D, et al. Persistent and therapeutic concentrations of human factor IX in mice after hepatic gene transfer of recombinant AAV vectors. Nat Genet. 1997;16(3):270–6. doi: 10.1038/ng0797-270. [DOI] [PubMed] [Google Scholar]
- 41.Snyder RO, Spratt SK, Lagarde C, Bohl D, Kaspar B, Sloan B, et al. Efficient and stable adeno-associated virus-mediated transduction in the skeletal muscle of adult immunocompetent mice. Hum Gene Ther. 1997;8(16):1891–900. doi: 10.1089/hum.1997.8.16-1891. [DOI] [PubMed] [Google Scholar]
- 42.Kessler PD, Podsakoff GM, Chen X, McQuiston SA, Colosi PC, Matelis LA, et al. Gene delivery to skeletal muscle results in sustained expression and systemic delivery of a therapeutic protein. Proc Natl Acad Sci U S A. 1996;93(24):14082–7. doi: 10.1073/pnas.93.24.14082. [DOI] [PMC free article] [PubMed] [Google Scholar]
- 43.Thomas CE, Storm TA, Huang Z, Kay MA. Rapid uncoating of vector genomes is the key to efficient liver transduction with pseudotyped adeno-associated virus vectors. J Virol. 2004;78(6):3110–22. doi: 10.1128/JVI.78.6.3110-3122.2004. [DOI] [PMC free article] [PubMed] [Google Scholar]
- 44.Sipo I, Fechner H, Pinkert S, Suckau L, Wang X, Weger S, et al. Differential internalization and nuclear uncoating of self-complementary adeno-associated virus pseudotype vectors as determinants of cardiac cell transduction. Gene Ther. 2007;14(18):1319–29. doi: 10.1038/sj.gt.3302987. [DOI] [PubMed] [Google Scholar]
- 45.Cearley CN, Wolfe JH. Transduction characteristics of adeno-associated virus vectors expressing cap serotypes 7, 8, 9, and Rh10 in the mouse brain. Mol Ther. 2006;13(3):528–37. doi: 10.1016/j.ymthe.2005.11.015. [DOI] [PubMed] [Google Scholar]
- 46.Lebherz C, Gao G, Louboutin JP, Millar J, Rader D, Wilson JM. Gene therapy with novel adeno-associated virus vectors substantially diminishes atherosclerosis in a murine model of familial hypercholesterolemia. J Gene Med. 2004;6(6):663–72. doi: 10.1002/jgm.554. [DOI] [PubMed] [Google Scholar]
- 47.Gao GP, Lu Y, Sun X, Johnston J, Calcedo R, Grant R, et al. High-level transgene expression in nonhuman primate liver with novel adeno-associated virus serotypes containing self-complementary genomes. J Virol. 2006;80(12):6192–4. doi: 10.1128/JVI.00526-06. [DOI] [PMC free article] [PubMed] [Google Scholar]
- 48.Gao GP, Alvira MR, Wang L, Calcedo R, Johnston J, Wilson JM. Novel adeno-associated viruses from rhesus monkeys as vectors for human gene therapy. Proc Natl Acad Sci U S A. 2002;99(18):11854–9. doi: 10.1073/pnas.182412299. [DOI] [PMC free article] [PubMed] [Google Scholar]
- 49.Blankinship MJ, Gregorevic P, Allen JM, Harper SQ, Harper H, Halbert CL, et al. Efficient transduction of skeletal muscle using vectors based on adeno-associated virus serotype 6. Mol Ther. 2004;10(4):671–8. doi: 10.1016/j.ymthe.2004.07.016. [DOI] [PubMed] [Google Scholar]
- 50.Bish LT, Morine K, Sleeper MM, Sanmiguel J, Wu D, Gao G, et al. Adeno-associated virus (AAV) serotype 9 provides global cardiac gene transfer superior to AAV1, AAV6, AAV7, and AAV8 in the mouse and rat. Hum Gene Ther. 2008;19(12):1359–68. doi: 10.1089/hum.2008.123. [DOI] [PMC free article] [PubMed] [Google Scholar]
- 51.Fausto N, Campbell JS. The role of hepatocytes and oval cells in liver regeneration and repopulation. Mech Dev. 2003;120(1):117–30. doi: 10.1016/s0925-4773(02)00338-6. [DOI] [PubMed] [Google Scholar]
- 52.Magami Y, Azuma T, Inokuchi H, Kokuno S, Moriyasu F, Kawai K, et al. Cell proliferation and renewal of normal hepatocytes and bile duct cells in adult mouse liver. Liver. 2002;22(5):419–25. doi: 10.1034/j.1600-0676.2002.01702.x. [DOI] [PubMed] [Google Scholar]
- 53.Miao CH, Snyder RO, Schowalter DB, Patijn GA, Donahue B, Winther B, et al. The kinetics of rAAV integration in the liver. Nat Genet. 1998;19(1):13–5. doi: 10.1038/ng0598-13. [DOI] [PubMed] [Google Scholar]
- 54.Song S, Lu Y, Choi YK, Han Y, Tang Q, Zhao G, et al. DNA-dependent PK inhibits adeno-associated virus DNA integration. Proc Natl Acad Sci U S A. 2004;101(7):2112–6. doi: 10.1073/pnas.0307833100. [DOI] [PMC free article] [PubMed] [Google Scholar]
- 55.Gau CL, Rosenblatt RA, Cerullo V, Lay FD, Dow AC, Livesay J, et al. Short-term correction of arginase deficiency in a neonatal murine model with a helper-dependent adenoviral vector. Mol Ther. 2009;17(7):1155–63. doi: 10.1038/mt.2009.65. [DOI] [PMC free article] [PubMed] [Google Scholar]