

Abstract
Background
Alcohol intoxication suppresses both the innate and adaptive immunities. Dendritic cells (DCs) are the major cell type bridging the innate and acquired immune responses. At the present time, the effects of alcohol on DC development in hematopoietic tissues and the functional activities of DCs are incompletely elucidated. This study investigated the impact of chronic alcohol exposure on the alteration of hematopoietic precursor cell and DC populations in the bone marrow and peripheral blood of rhesus macaques.
Methods
Rhesus macaques were administered EtOH or isocaloric sucrose daily for a period of three months through surgically-implanted gastric catheters. Peripheral blood mononuclear cells (PBMCs) and bone marrow cells (BMCs) were isolated for flow cytometric analysis after three months. Monocytes were cultured with human IL-4 (10 ng/ml) and GM-CSF (50 ng/ml) in the absence and presence of alcohol (50 mM). On day 6 of the culture, a cocktail of stimulants including IL-1β (18 ng), IL-6 (1800 U), TNF-α (18 ng), PGE2 (1.8 µg) were added to the designated wells for transformation of immature dendritic cells (iDCs) to mature myeloid DCs. The cells were analyzed on day 8 by flow cytometry for expression of DC costimulatory molecule expression.
Results
EtOH-treated animals had significantly lower numbers of myeloid DCs (lineage−HLA−DR+CD11c+CD123−) in both the PBMCs and BMCs compared to controls (5,654±1,273/106 vs. 2,353±660/106 PBMCs and 503±34 vs. 195±44/106 BMCs). Under culture conditions, the number of lineage−HLA−DR+CD83+ cells was low in control wells (0.38±0.08%). Alcohol inhibited the increase in the number of lineage−HLA−DR+CD83+ cells in iDC wells (2.30±0.79% vs. 5.73±1.40%). Alcohol also inhibited the increase in the number of lineage−HLA−DR+CD83+ cells in mature DC wells (1.23±0.15% vs. 4.13±0.62%).
Conclusions
Chronic EtOH decreases the bone marrow and circulating pools of myeloid DCs. Additionally, EtOH suppresses costimulatory molecule CD83 expression during DC transformation, which may attenuate the ability of DCs to initiate T cell expansion.
Keywords: Ethanol, Rhesus, Dendritic Cells, Costimulatory Molecule
Introduction
Dendritic cells (DCs) are professional antigen presenting cells that play an important role in antibacterial and antiviral immune responses (Chung et al, 2005; Loof et al, 2008; Teleshova et al, 2004). Myeloid DCs predominantly arise from the granulocyte-monocyte progenitor cells in the bone marrow (Karsunky et al, 2005; Olweus et al, 1997; Shigematsu et al, 2004; Traver et al, 2000). These cells exit the bone marrow as immature DCs (iDCs), lacking costimulatory molecule expression, and circulate through peripheral tissues to monitor exogenous pathogen invasion. Immature DCs capture antigen (Ag) molecules via phagocytosis, macropinocytosis, and receptor-mediated endocytosis. Upon Ag stimulation, these cells express costimulatory molecules, including CD25, CD80, CD83, and CD86, and process the captured antigens onto class II major histocompatibility complex (MHC II) molecules for presentation to naïve and memory T lymphocytes (Banchereau and Steinman, 1998). Final maturation occurs after myeloid DCs interact with lymphocyte targets. This highly efficient process initiates an antigen-specific immune reaction that is severely inhibited when DCs are ablated (Banchereau and Steinman, 1998).
Myeloid DCs are primarily responsible for surveillance of tissues, and migrate to the lymph nodes upon encountering Ag (Yoneyama et al, 2001; Yoneyama et al, 2002). Depending on the level of IL-12 secretion by the myeloid DC, T Helper 1 (TH1) or T Helper 2 (TH2) responses will dominate (Lanzavecchia and Sallusto, 2000). The duration of IL-12 production is typically short-lived in individual DC, requiring a continued influx of mature, Ag-stimulated myeloid DCs to sustain a TH1 response. Additionally, the presence of stimulatory T Helper (TH) or regulatory T (TR) cells within lymph nodes help determine T cell polarization. Plasmacytoid DCs (pDCs) also arise from the bone marrow and rapidly migrate to lymph nodes. This specialized DC subset primarily stimulates a potent interferon-α response when viral Ag or toll-like receptor-9 (TLR-9) agonists are encountered (Lanzavecchia and Sallusto, 2000; Yoneyama et al, 2001; Yoneyama et al, 2002). Both myeloid DCs and pDCs initiate the clonal expansion required for an effective T cell response (Le Bon et al, 2003).
Alcohol is the most frequently abused drug and is known to suppress both innate and acquired immune defenses. Chronic alcohol can cause leukopenia, granulocytopenia, and thrombocytopenia in human subjects (Latvala et al, 2004). Acute alcohol also has been shown to alter function and cytokine production in human monocyte-derived myeloid DCs (Szabo et al, 2004a). Chronic alcohol consumption in humans causes alterations in the immunophenotype of DCs and a decreased production IL-1β and TNF-α (Laso et al, 2007). The effects of chronic alcohol consumption on the in vivo development of DCs in hematopoietic tissue have not been elucidated in human and non-human primates. This study investigated the impact of chronic alcohol exposure on the alteration of hematopoietic precursor cell and DC populations in the bone marrow and peripheral blood of rhesus macaques. The effects of alcohol on the expression of costimulatory molecules by monocyte-derived DCs were also examined.
Materials and Methods
Animals, Gastric Catheter Implantation and Alcohol Administration Protocol
This study was conducted at the Tulane National Primate Research Center (TNPRC) in Covington, Louisiana, on male rhesus monkeys (Macaca mulatta) of Indian origin that were 4–6 years of age. Institutional Animal Care and Use Committees at both TNPRC and LSU Health Sciences Center in New Orleans approved experimental procedures on these animals. Data from a total of 21 animals are included in this report. The animals were housed individually in a Biosafety Level-2 (BSL-2) containment building. Monkeys were fed a commercial primate chow, supplemented with fruit, and provided water ad libitum throughout the study. In addition, animals received ethanol or isocaloric sucrose daily (30% ethanol as a 0.5 h infusion) via a permanently indwelling intragastric catheter (17 gauge, Access Technologies, Skokie, IL) that was attached to a cage mounted swivel via a tether (Lomir Biomedical, Malone, NY) as previously described (Bagby et al, 2003). A blood sample was obtained weekly 2 h after starting ethanol delivery in order to adjust infusion rates so that plasma alcohol concentrations were between 50 to 60 mM. A clinical veterinarian carefully examined the jacket, the catheter, and exit site during weekly physical exams and initiated treatment if appropriate.
Bone Marrow and Peripheral Blood Mononuclear Cell (PBMC) Isolation
Peripheral blood and bone marrow samples were obtained 3 months after the chronic ethanol or sucrose administration. Samples were collected from anesthetized animals following an overnight fast in the absence of alcohol. Bone marrow from the femurs and PBMCs isolated from blood samples of rhesus macaques by standard Ficoll-Paque Plus protocol (GE Healthcare, Piscataway, NJ) were suspended in saline containing 1mM EDTA. Following centrifugation at 400g for 5 min, the bone marrow and PBMCs were incubated with 3 mL and 1 mL respectively of RBC Lysis Solution (Qiagen, Valencia, CA) for 5 min at room temperature (RT). At the end of lysing period, an equal volume of RPMI-1640 plus 10% FCS was added to each tube. After centrifugation at 400 g for 5 min, the cells were washed with RPMI-1640+10% FCS. PBMCs were suspended in 0.5 mL of RPMI-1640 media plus10% FCS to make a cell concentration at 2 × 10⁷ cells/mL. Nucleated BMCs were suspended in 0.5mL of RPMI-1640 media plus10% FCS. The cell suspensions were filtered through a 70 micron nylon mesh. After counting BMCs using a hemocytometer, the volume of bone marrow cell suspension was adjusted to a cell concentration of 2 × 10⁷ cells/mL.
Preparation of PBMCs for In Vitro Induction of Dendritic Cells
PBMCs were suspended at a concentration of 3 × 10⁶ /ml in RPMI-1640 supplemented with 200 mM L-glutamine, 50 µM 2-mercaptoethanol, 10 mM HEPES, penicillin (100 U/ml)/streptomycin (100 µg/ml), 10% FCS. The cell suspension was plated in 12-well tissue culture plates (1 ml/well). The cells were incubated at 37°C in an atmosphere of 5% CO2 for 2 hr. After removing the culture medium containing non-adhered cells, the adhered cells were gently washed one time with fresh medium to remove the remaining non-adhered cells.
In Vitro Induction, Culture and Ethanol Treatment of Dendritic Cells
The adhered cells in each well were treated with 1 ml of RPMI-1640−10% FCS supplemented with pen/strep, human IL-4 (10 ng/ml, R&D Systems, Minneapolis, MN) and GM-CSF (50 ng/ml, R&D Systems, Minneapolis, MN) in the absence and presence of alcohol (50 mM). In control wells, the cells were cultured without IL-4, GM-CSF, or alcohol. Cells in DC wells were treated with the same amount of cytokines (10 ng IL-4 and 50 ng GM-CSF) in 200 µl medium without or with alcohol (50 mM) on day 2, 4, and 6. The control wells were cultured with an equal volume of medium only. On day 6 after feeding cells with the above cytokines, a cocktail of stimulants including IL-1β (18 ng), IL-6 (1800 U), TNF-α (18 ng), PGE2 (1.8 µg, Cayman Chemical, Ann Arbor, MI) in 200 µl of medium without or with alcohol (50 mM) was added into selected wells. This cocktail of stimulants was used to transform immature DCs to mature DCs. The cells were harvested on Day 8.
Flow Cytometric Analysis
Cells isolated from the bone marrow and peripheral blood (2×10⁶ cells/sample) were stained with an antibody cocktail containing 1 µg each of the following fluorescence-conjugated antibodies to analyze all blood cells and stem/progenitor cells: CD3-PerCP, CD14-PerCP-Cy5.5, CD20-PE-Cy7, CD56-Alexa Fluor 700, CD34-PE (all from BD Biosciences, San Jose, CA), CD38-FITC (Stem Cell Technologies, Vancouver, BC, Canada), and CD66-APC (Miltenyi Biotec, Auburn, CA). For analysis of pDCs and myeloid DCs, a second cocktail containing 1 µg each of the following fluorescence-conjugated antibodies was used: CD3-PerCP, CD14-PerCP-Cy5.5, CD20-APC-Cy7, HLA-DR-PE-Cy7, CD11c-PE, CD123-FITC (all from BD Biosciences, San Jose, CA), and CD66-APC (Miltenyi Biotec, Auburn, CA). Additional samples were stained with the appropriate isotype- and fluorescence-matched control antibodies. After incubation on ice in the dark for 30 min, cells were washed with cold PBS and then resuspended in a volume of 250 µL PBS + 1% paraformaldehyde. Phenotypic analysis of cells was performed on a BD LSRII flow cytometer using BD FACSDiva software. Cell phenotypic markers are listed in Table 1.
Table 1. Surface protein expression for cell analysis.
Phenotypic markers for Cell Discrimination.
| Cell Type | Phenotypic Markers |
|---|---|
| Myeloid Dendritic Cell | Lin−HLA−DR+CD11c+CD123− |
| Plasmacytoid Dendritic Cell | Lin−HLA−DR+CD11c−CD123+ |
| T lymphocyte | CD3+ |
| T Lymphoid Precursor | CD3+CD34+ |
| B Lymphocyte | CD20+ |
| B Lymphoid Precursor | CD20+CD34+ |
| Monocyte | CD14+ |
| Myeloid Precursor | CD14+CD34+ |
| Granulocyte | CD66+ |
| Granulocyte Precursor | CD66+CD34+ |
| Hematopoietic Stem Cell | Lin−CD34+ |
Lineage negative = Lin−
In vitro induced dendritic cells were washed with cold PBS, and the cells were stained in the dark for 30 min on ice with 1 µg each of the following fluorescence-conjugated antibodies or isotype- and fluorescence-matched control antibodies: PE-CD3, FITC-CD20, APC-Cy7-CD25, Biotin/Alexa 405-CD80, PE-Cy5-CD83, APC-CD86, and PE-Cy7-HLA-DR (BD Biosciences, San Jose, CA). The cells were then analyzed on a BD FACSAria flow cytometer with BD FACSDiva software.
Statistical Analysis
Data are presented as mean ± SEM. The sample size is indicated in the legend of each figure. Statistical analyses of data were conducted using unpaired Student t test (for comparison between two groups) or one-way analysis of variance followed by Student-Newman-Keuls test (for comparisons among multiple groups). Differences were considered statistically significant at P < 0.05.
Results
Impact of chronic alcohol feeding on Bone Marrow and Peripheral Blood DC Populations
To determine the effects of chronic alcohol on blood cell number and maturation we initially screened blood and bone marrow with panels of antibodies that could distinguish mature blood cells and immature precursor cells. Chronic alcohol administration decreased the total numbers of T lymphocytes (55,356±10,130 vs. 21,004±5,467/106 BMCs, control vs. alcohol), T lymphoid precursor (358±37 vs. 179±24/106 BMCs, control vs. alcohol), B lymphocytes (34,636±2,211 vs. 23,369±842/106 BMCs, control vs. alcohol), and hematopoietic stem cells (42,433±2,239 vs. 30,975±3,090/106 BMCs, control vs. alcohol) in the bone marrow, but did not alter lymphocyte numbers or their precursors in blood (Tables 2 and 3). Additionally, no changes were seen in the pDC population between control and alcohol-treated animals. Total myeloid DCs were significantly decreased in the bone marrow (503±34 vs. 195±44/106 BMCs, control vs. alcohol) as well as the peripheral blood (5,654±1,273 vs. 2,353±660/106 PBMCs, control vs. alcohol) following 3 months of chronic ethanol treatment (Figure 1).
Table 2. Bone marrow cells by phenotype.
Bone Marrow Cell Numbers by Phenotypes.
| Cell Type | Sucrose | Alcohol |
|---|---|---|
| Cells per 106 BMCs (SEM) | Cells per 106 BMCs (SEM) | |
| Myeloid Dendritic Cell | 503 (34) | 195 (44)* |
| Plasmacytoid Dendritic Cell | 4,226 (488) | 3,075 (538) |
| T lymphocyte | 55,356 (10,130) | 21,004 (5,467)* |
| T Lymphoid Precursor | 358 (37) | 179 (24)* |
| B Lymphocyte | 34,636 (2,211) | 23,369 (842)* |
| B Lymphoid Precursor | 159 (10) | 171 (12) |
| Monocyte | 5,758 (309) | 3,617 (1,738) |
| Myeloid Precursor | 24 (7) | 29 (20) |
| Granulocyte | 479,237 (27,979) | 522,276 (27,394) |
| Granulocyte Precursor | 10,812 (1,711) | 9,321 (1,007) |
| Hematopoietic Stem Cell | 42,433 (2,239) | 30,975 (3,090)* |
Total number of cells for each examined phenotype is expressed as mean ± SEM per 106 total bone marrow cells. N=3 for both groups.
Asterisks indicate statistical difference (p < 0.05).
Bone marrow cells = BMCs; Standard error of the mean = SEM
Table 3. Peripheral blood cells by phenotype.
Peripheral Blood Cell Numbers by Phenotypes.
| Cell Type | Sucrose | Alcohol |
|---|---|---|
| Cells per 106 PBMCs (SE) | Cells per 106 PBMCs (SE) | |
| Myeloid Dendritic Cell | 5,654 (1,273) | 2,353 (660)* |
| Plasmacytoid Dendritic Cell | 475 (176) | 625 (167) |
| T lymphocyte | 460,781 (21,881) | 536,227 (29,313) |
| T Lymphoid Precursor | 33 (6) | 33 (8) |
| B Lymphocyte | 294,273 (23,749) | 255,506 (31,029) |
| B Lymphoid Precursor | 45 (7) | 34 (4) |
| Monocyte | 34,600 (5,617) | 30,583 (6,036) |
| Myeloid Precursor | 62 (10) | 55 (11) |
| Granulocyte | 8,330 (1,419) | 7,056 (793) |
| Granulocyte Precursor | 2 (1) | 4 (1) |
| Hematopoietic Stem Cell | 394 (81) | 443(126) |
Total number of cells for each examined phenotype is expressed as mean ± SEM per 106 total peripheral blood cells. N=8 for sucrose and N=7 for alcohol groups.
Asterisks indicate statistical difference (p < 0.05).
Peripheral blood mononuclear cells = PBMCs; Standard error of the mean = SEM
Figure 1.
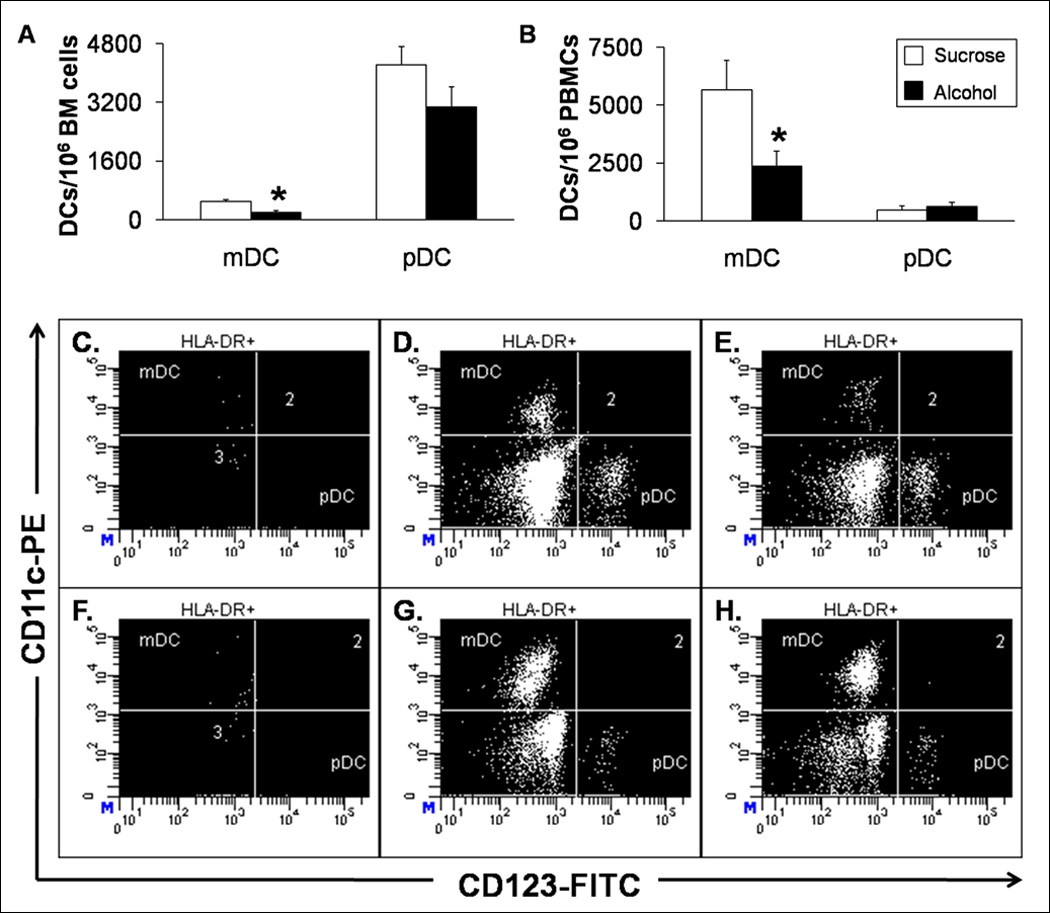
Bone Marrow and Circulating Myeloid DCs and pDCs. Alcohol decreases the absolute number of myeloid DCs in the (A) bone marrow and (B) peripheral blood in macaques. Data are mean ± SEM; N=3 for bone marrow groups; N = 8 in control and N = 7 in alcohol groups for peripheral blood; Asterisks indicate statistical difference (p < 0.05). Representative dot plots from (C–E) bone marrow and (F–H) peripheral blood are shown. The myeloid DCs are clearly diminished by alcohol (E and H) compared to sucrose-fed animals (D and G).
In vitro Alcohol effects on Monocyte-derived DCs and Costimulatory Molecule Expression
Myeloid DCs were the only cell type altered in both blood and bone marrow of rhesus macaques receiving chronic alcohol. To test myeloid DC function, we isolated monocytes from both sucrose- and alcohol-administered macaques to derive DCs for flow cytometric analysis of their costimulatory molecule expression. Monocytes from both sucrose and alcohol treated animals reacted similarly during transformation, therefore only cultures from sucrose animals are discussed. We first examined CD83 as marker of DC maturation and function, since this costimulatory molecule is required for an appropriate acquired immune response. The number of lineage−HLA−DR+CD83+ cells was low in control wells (0.38±0.08%) without stimulation for DC transformation. Exposure to alcohol in vitro inhibited the increase in the number of lineage−HLA−DR+CD83+ cells in iDC wells (5.73±1.40% vs. 2.30±0.79%, control vs. alcohol). Alcohol also inhibited the increase in the number of lineage−HLA−DR+CD83+ cells in mature DC wells (4.13±0.62% vs. 1.23±0.15%, control vs. alcohol) (Figure 2).
Figure 2.
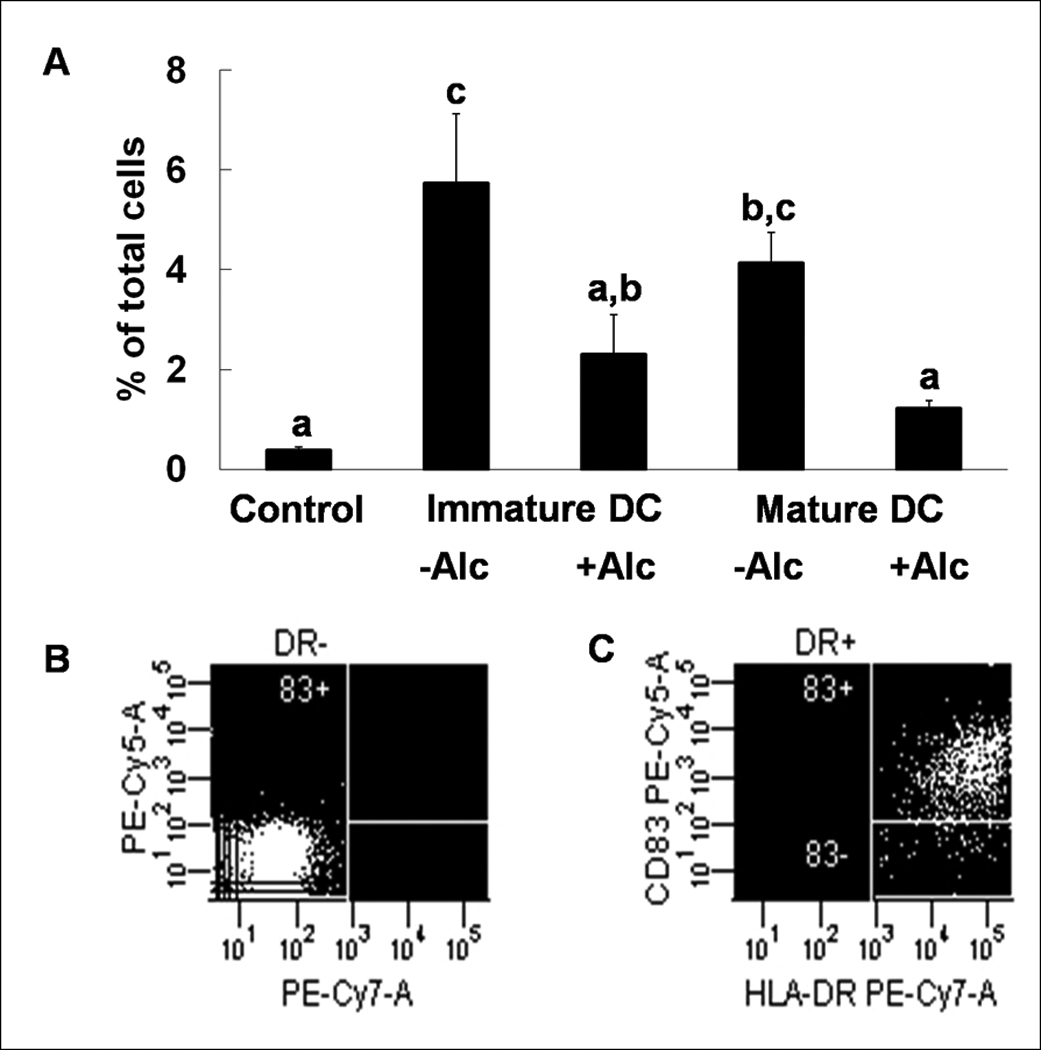
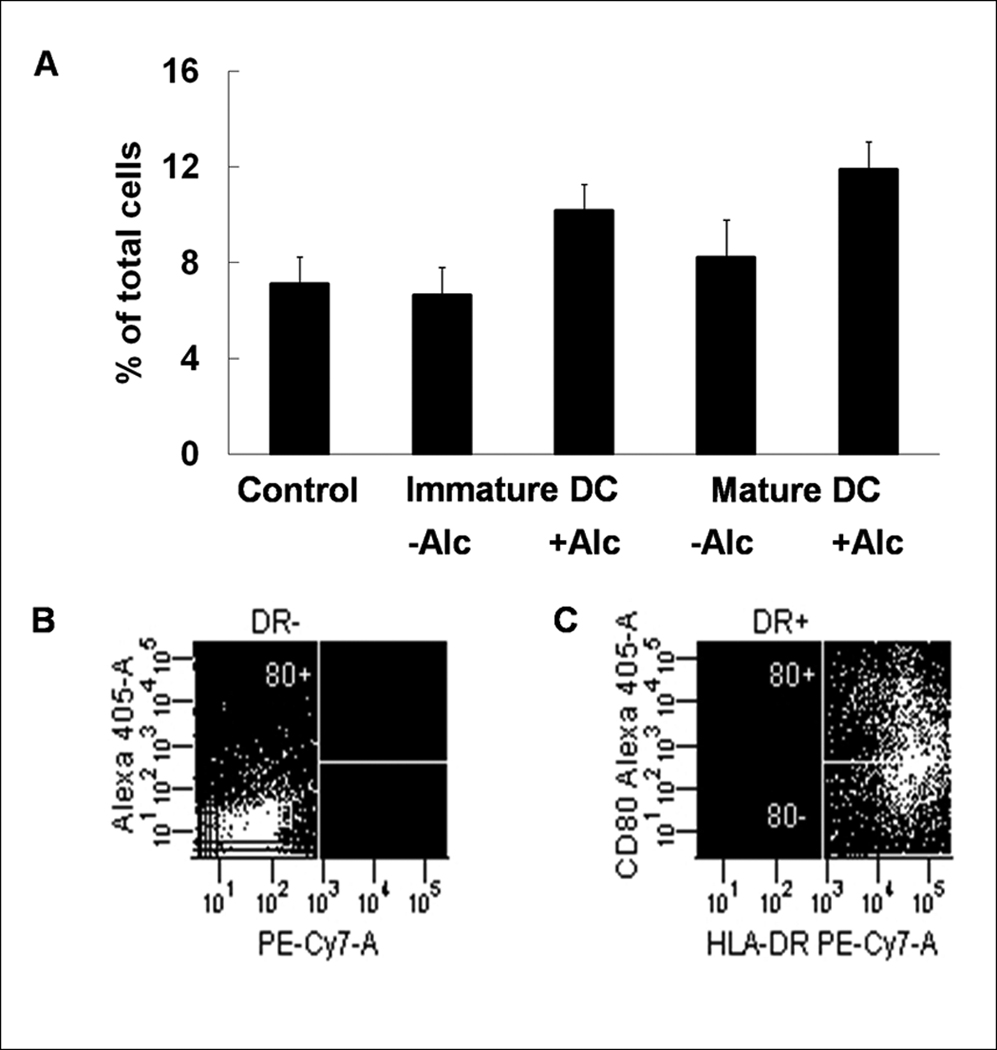
Expression of costimulatory molecule CD83 during DC transformation. Alcohol decreases expression of CD83 in immature and mature in vitro transformed dendritic cells (A). Data are mean ± SEM; N = 3~4 in each group; Bars with different letters in each panel are statistically different (p < 0.05). Representative dot plots for isotype (B) and anti-CD83 (C) staining are shown.
We also measured the surface expression level of other DC costimulatory markers that are upregulated by maturation and contribute to accessory cell function. The number of lineage−HLA−DR+CD25+ (7.15±1.37%, 9.40±1.92%, 14.90±2.39%; control, iDC, mature DC respectively) and lineage−HLA−DR+CD86+ cells (2.70±0.53%, 10.20±0.97%, 16.15±2.62%; control, iDC, mature DC respectively) were increased during DC transformation and maturation (Figures 3 & 4). This increase in the number of lineage−HLA−DR+CD25+ cells was not affected by alcohol (9.40±1.92% vs.11.83±1.21%, iDC vs. iDC + alcohol; 14.90±2.39% vs. 13.85±1.35%, mature DC vs. mature DC + alcohol), while alcohol blunted CD86 expression (10.20±0.97% vs.8.88±1.40%, iDC vs. iDC + alcohol; 16.15±2.62% vs. 14.43±2.19%, mature DC vs. mature DC + alcohol). No differences were observed in the expression of CD80 among any of the groups (7.10±1.14%, 6.65±1.14%, 10.18±1.08%, 8.23±1.54%, 11.90±1.12%; control, iDC, iDC + alcohol, mature DC, mature DC + alcohol) (Figure 5).
Figure 3.
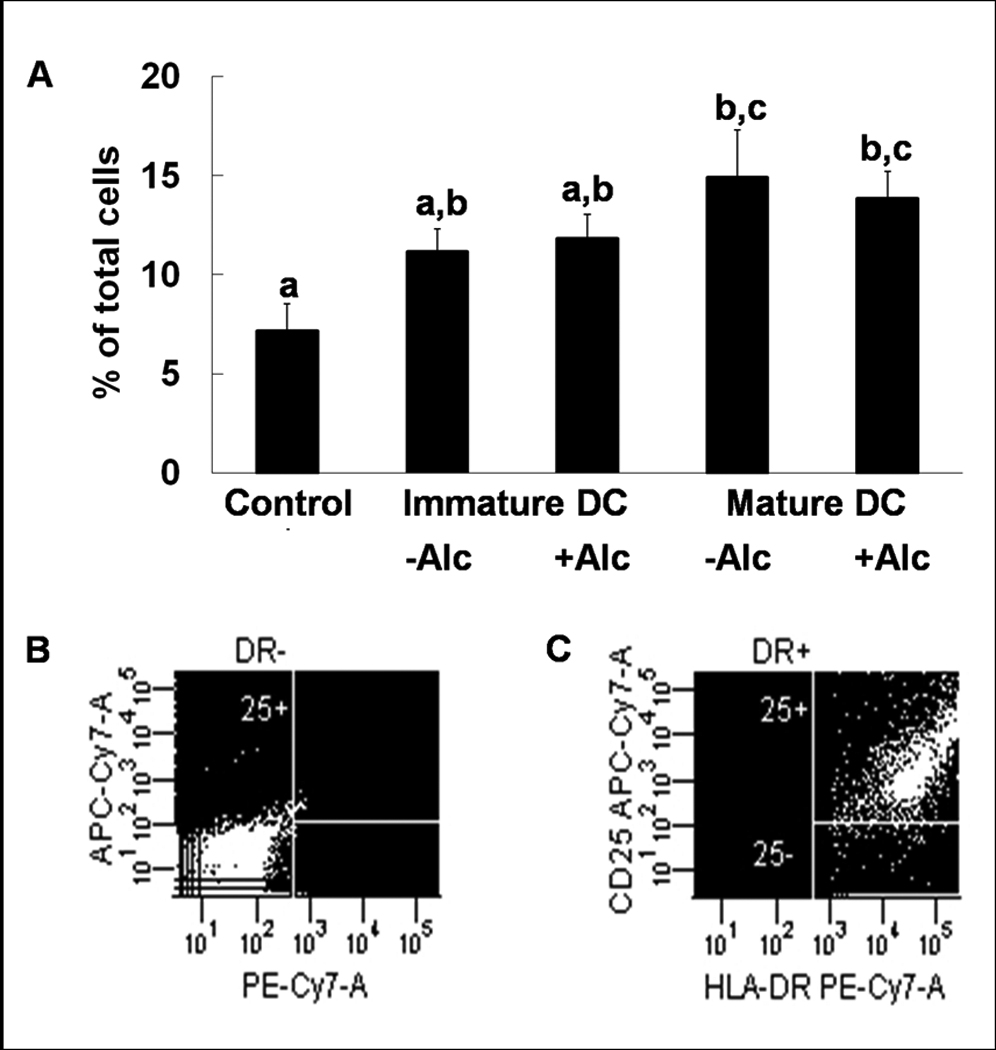
Expression of costimulatory molecule CD25 during DC transformation. CD25 increases during DC transformation, but alcohol does not alter expression of CD25 in immature or mature in vitro transformed dendritic cells (A). Data are mean ± SEM; N = 3~4 in each group; Bars with different letters in each panel are statistically different (p < 0.05). Representative dot plots for isotype (B) and anti-CD25 (C) staining are shown.
Figure 4.
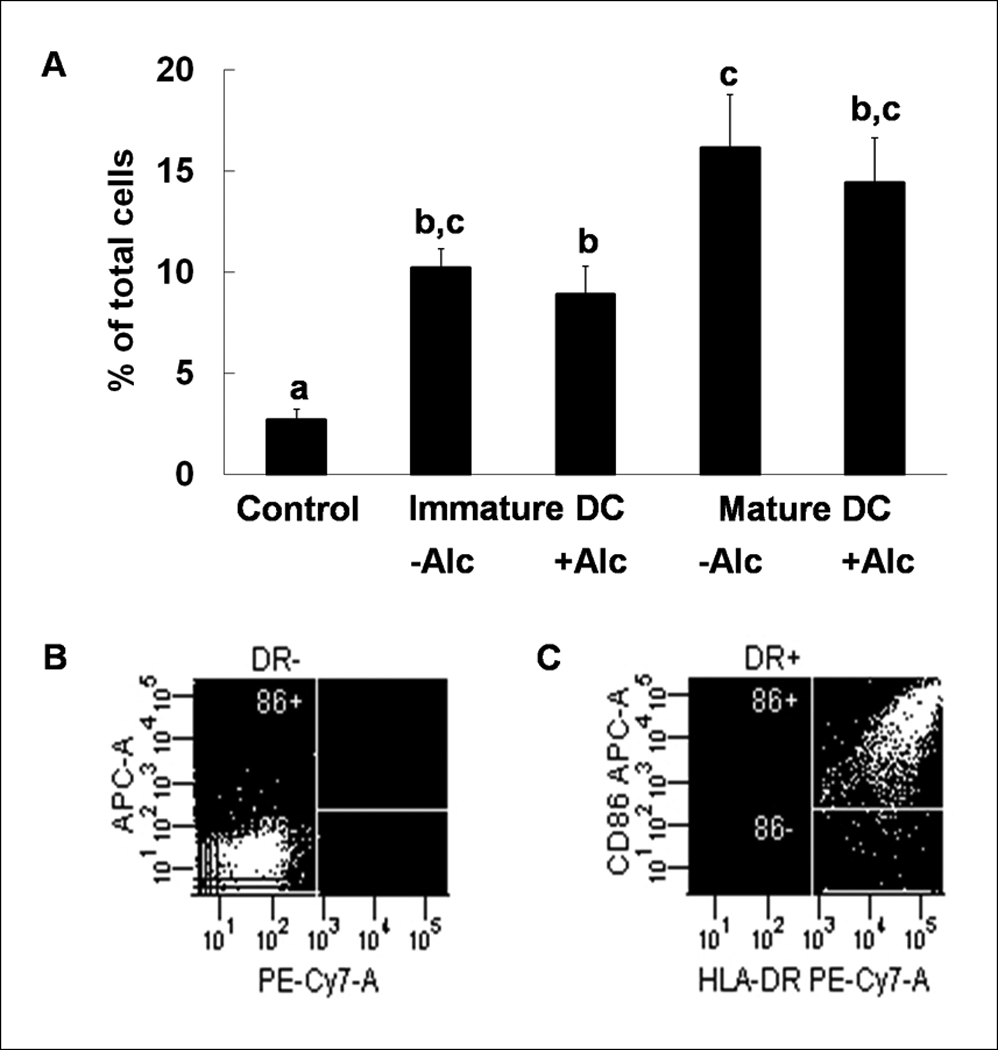
Expression of costimulatory molecule CD86 during DC transformation. CD86 expression increases during in vitro maturation of transformed dendritic cells, and this expression is blunted by alcohol (A). Data are mean ± SEM; N = 3~4 in each group; Bars with different letters in each panel are statistically different (p < 0.05). Representative dot plots for isotype (B) and anti-CD86 (C) staining are shown.
Figure 5.
Expression of costimulatory molecule CD80 during DC transformation. CD80 expression did not change during DC transformation and alcohol had no effect (A). Data are mean ± SEM; N = 3~4 in each group; There were no statistically significant differences among the groups. Representative dot plots for isotype (B) and anti-CD80 (C) staining are shown.
Discussion
Alcohol abuse is known to impair host defense in both humans and animal models; however, the immunosuppressive mechanisms of chronic alcohol abuse are incompletely understood (Jerrels et al, 1994; Szabo, 1999). Multiple mechanisms have been proposed to contribute to the immunosuppressive effects of alcohol. Acute alcohol has been shown to cause thymocyte and circulating mononuclear cell apoptosis (Ewald and Shao, 1993; Singhal, 1999). Increases in circulating level of immunoglobulins is a hallmark of chronic alcohol consumption in humans; however, absolute numbers of circulating B cells from control and alcohol groups are not different (Szabo, 1999). These data support the hypothesis that chronic alcohol increases the TH2 response at the expense of the TH1 response. The results from our studies provide an additional potential mechanism underlying the impaired adaptive immune function seen in alcoholics: namely, diminished myeloid DC numbers and function. Myeloid DCs are the most potent antigen presenting cells (APCs) in mammals, so any disruption of this cell type would be expected to lead to a diminished T cell response to invading pathogens, both bacterial and viral (Chen et al, 2007; Mellman and Steinman, 2001).
DC differentiation from progenitor cells is incompletely understood. Myeloid DCs are thought to arise predominantly from either the common myeloid progenitor (CMP) or the granulocyte monocyte progenitor (GMP) in the bone marrow (Olweus et al, 1997). IL-4 and TNF-α promote these progenitors to differentiate toward immature myeloid dendritic cells. pDCs were thought to have a distinct progenitor from those of myeloid DCs (Ardavin et al, 1993), but recent data suggest that both DC subtypes can originate from both the CMP and common lymphoid progenitors (CLP) branches of the hematopoietic hierarchy (Karsunky et al, 2005; Lau et al, 2006; Olweus et al, 1997; Shigematsu et al, 2004; Traver et al, 2000). The differences in lineage hierarchy and differentiation programs might account for the selective modulation of myeloid DCs by alcohol.
Lineage determination of progenitors towards fully differentiated progeny is controlled by the microenvironment of the niche (Taichman, 2005). The niche includes a stromal layer of cells that produce intercellular cytokines and cell membrane proteins that regulate the differentiation of hematopoietic progenitor cells (HPCs). Recent studies have shown that chronic alcohol administration disrupts stromal cell differentiation and protein secretion (Yeh et al, 2008). Mesenchymal stem cells (MSCs) are thought to play an important role in regulating the niche environment (Miura et al, 2006). Chronic alcohol preferentially activates the adipocyte differentiation program in MSCs, at the expense of the osteoblastic differentiation program (Cui et al, 2006; Wahl et al, 2006; Wazeman and Gong, 2004). Adipogenic MSCs have been shown to lack adequate myelopoietic support, while osteoblastic MSCs are capable of fostering myeloid cell differentiation from HPCs (Morad et al, 2008). Chronic alcohol has also been shown to promote osteoclastogenesis (Dai et al, 2000). Prior research indicates that osteoclasts and dendritic cells arise from a common progenitor (Miyamoto et al, 2001). These findings suggest that the decrease in total myeloid DC number in our rhesus model might be due to shunting of progenitors towards the osteoclast lineage in the bone marrow. With altered differentiation patterns of the stromal cells in the niche, cytokine secretion from these cells would likely be altered. Chronic alcohol has been shown to alter the normal function of many cytokines and chemokines in vivo. Rats fed chronic ethanol have diminished GM-CSF receptor signaling (Joshi et al, 2006). Circulating levels of TNF-α are not altered by alcohol, but TNF-α processing has been shown to be inhibited by ethanol (Gonzalez-Quintela et al, 2008; Zhao et al, 2003). These two cytokines play a major role in the induction and maturation of myeloid DCs. The modulation of these signaling pathways might account for the diminished myeloid DC numbers seen in our model.
In our rhesus macaque model of chronic alcohol consumption, total bone marrow and circulating myeloid DCs were decreased compared to isocaloric sucrose controls. Since all myeloid DCs ultimately arise from the bone marrow, we examined the numbers of monocytes and myeloid precursors. Bone marrow precursors of the myeloid DCs were not statistically different between sucrose and alcohol groups in our animals. It is known that the myeloid precursors differentiate to several myeloid cell types, such as granulocytes and monocytes, which constitute the vast majority of total myeloid lineage cells. Hematopoietic stem cells are upstream of myeloid progenitors. Total numbers of HSCs were decreased by alcohol, which may perturb downstream lineage commitment. Myeloid DCs were markedly decreased by alcohol suggesting that this cell type is more vulnerable to alcohol-induced damage in comparison to other cell types along the myeloid branch. Additionally we noticed a reduction in T lymphoid precursors in alcohol administered animals. Since a portion of myeloid DCs may derive from the lymphoid branch of the hematopoietic hierarchy, the decrease we observed in the lymphoid precursor pool could also partially account for the diminished number of myeloid DCs in our current model (Thomas and Lipsky, 1996). Further examination is required to determine the primary mechanism for the inhibition of myeloid DC production by chronic alcohol.
As stated before, myeloid DCs leave the bone marrow and migrate to tissues. When the iDC encounters antigen, it matures and migrates to the regional lymph nodes. Once in the lymph node, myeloid DCs have an expected half-life of two to three days (Lanzavecchia and Sallusto, 2001). Chronic EtOH has been reported to diminish splenic DCs in mouse models, with no effect on the differentiation or turnover of primary lymphoid resident DCs. Additionally, migration rate into secondary lymphoid tissues was not altered with chronic ethanol exposure in mice (Edsen-Moore, 2008).
Our findings that myeloid DC numbers are decreased following chronic ethanol administration in rhesus macaques are supported by observations in humans and other animal models (Edsen-Moore, 2008). Two possible mechanisms for this effect of alcohol involve blocking the final commitment of myeloid DC precursors to immature myeloid DCs in the bone marrow and inhibiting maturation of tissue-resident immature myeloid DCs. The decrease in total number and maturation of myeloid DCs may serve as one mechanism underlying the increased incidence and severity of infections in alcoholic hosts.
Impaired immunity from excessive alcohol consumption is partially explained by the decreased number of myeloid DCs. A decrease in myeloid DC function may exacerbate this immune impairment. We conducted in vitro studies to determine if myeloid DC function is impaired by alcohol in rhesus monkeys. Immature DCs are very effective in antigen uptake, while mature DCs show an enhanced capacity for Ag presentation and immunostimulation. During DC maturation, increased expression of costimulatory molecules is a unique feature that is correlated to their functional enhancement of Ag presentation (Frank et al, 2002; Pichyangkul et al, 2001). Costimulatory molecule CD83 is a critical surface marker of myeloid DCs in rhesus monkeys (Pichyangkul et al, 2001). CD83+ DCs express other costimulatory molecules including CD25 (IL-2Rα), CD80 (B7-1), and CD86 (B7-2) and produce IL-12 in response to INF-γ and LPS (Morelli et al, 2001; Tschoep et al, 2003). CD25 is the high affinity subunit of the IL-2 receptor. Recent studies through monoclonal antibody blockade of CD25 on DCs suggest that this molecule is important for TH1 polarization and IL-12 production (Mnasria et al, 2008). Both CD80 and CD86 are monomeric ligands for CD28 expressed on most CD4 positive T cell subsets (Zheng et al, 2004). These costimulatory molecules provide a signal that is distinct from T cell receptor (TCR) activation, and depending on the cytokines present, these costimulatory molecules have been shown to have differential effects (Carreno and Collins, 2002; Zheng et al, 2004). Studies in mice have shown that CD83 can induce T cell clonal expansion in mixed lymphocyte cultures, and soluble CD83 has been shown to cause T cell anergy (Hirano et al, 2006; Lechmann, 2001).
Our current study shows that alcohol exposure inhibits CD83 expression, which suggests that the tissue-resident immature myeloid DCs are not sufficiently activated. Insufficient CD83 expression and soluble CD83 have been shown to be immunosuppressive (Lechmann, 2001). Acute alcohol has been shown to decrease the allostimulatory capacity of myeloid DCs, as well as CD80 and CD86 expression (Szabo et al, 2004a; Szabo et al, 2004b). Additionally, ethanol has been shown to increase IL-10 production and inhibit IL-12 production, possibly impairing the ability of iDC to mature (Szabo et al, 2007). Since the mature myeloid DCs migrate to the lymph nodes, we hypothesize that a reduced progression of iDC in our alcohol consuming rhesus macaques would result in a smaller pool of these cells in lymphoid tissues.
In summary, chronic alcohol administration decreases both bone marrow and circulating levels of myeloid DCs and attenuates costimulatory molecule expression on myeloid DCs. These negative effects of alcohol on myeloid DC function may impair host immune defense and partially account for the increase in host susceptibility to infectious diseases in alcohol abusers (Lau et al, 2006).
Acknowledgements
We thank Amy B. Weinberg, Joseph S. Soblosky, PhD, Rhonda R. Martinez, Jean Carnal, and Jane A. Schexnayder for their expert technical assistance. The authors also thank Connie P. Porretta for her expert assistance with flow cytometric analyses and cell sorting. This work was supported by NIH grants AA09803, AA07577, and AA11290.
Literature Cited
- Ardavin C, Wu L, Li C-L, Shortman K. Thymic dendritic cells and T cells develop simultaneously in the thymus from a common precursor population. Nature. 1993;362:761–763. doi: 10.1038/362761a0. [DOI] [PubMed] [Google Scholar]
- Bagby GJ, Stoltz DA, Zhang P, Kolls JK, Brown J, Bohm RP, Jr, Rockar R, Purcell J, Murphey-Corb M, Nelson S. The effect of chronic binge ethanol consumption on the primary stage of SIV infection in rhesus macaques. Alcohol Clin Exp Res. 2003;27:495–502. doi: 10.1097/01.ALC.0000057947.57330.BE. [DOI] [PubMed] [Google Scholar]
- Banchereau J, Steinman RM. Dendritic cells and the control of immunity. Nature. 1998;392:245–252. doi: 10.1038/32588. [DOI] [PubMed] [Google Scholar]
- Carreno BM, Collins M. The B7 family of ligands and its receptors: new pathways for costimulation and inhibition of immune responses. Annu Rev Immunol. 2002;20:29–53. doi: 10.1146/annurev.immunol.20.091101.091806. [DOI] [PubMed] [Google Scholar]
- Chen M, Huang L, Shabier Z, Wang J. Regulation of the lifespan in dendritic cell subsets. Mol Immun. 2007;44:2558–2565. doi: 10.1016/j.molimm.2006.12.020. [DOI] [PMC free article] [PubMed] [Google Scholar]
- Chung E, Amrute SB, Abel K, Gupta G, Wang Y, Miller CJ, Fitzgerald-Bocarsly P. Characterization of virus-responsive plasmacytoid dendritic cells in the rhesus macaque. Clin Diagn Lab Immunol. 2005;12:426–435. doi: 10.1128/CDLI.12.3.426-435.2005. [DOI] [PMC free article] [PubMed] [Google Scholar]
- Cui Q, Wang Y, Saleh KJ, Wang GJ, Balian G. Alcohol-induced adipogenesis in a cloned bone-marrow stem cell. J Bone Joint Surg Am. 2006;88 Suppl 3:148–154. doi: 10.2106/JBJS.F.00534. [DOI] [PubMed] [Google Scholar]
- Dai J, Lin D, Zhang J, Habib P, Smith P, Murtha J, Fu Z, Qi Y, Keller ET. Chronic alcohol ingestion induces osteoclastogenesis and bone loss through IL-6 in mice. J Clin Invest. 2000;106:887–895. doi: 10.1172/JCI10483. [DOI] [PMC free article] [PubMed] [Google Scholar]
- Edsen-Moore MR, Fan J, Ness KJ, Marietta JR, Cook RT, Schlueter AJ. Effects of chronic ethanol feeding on murine dendritic cell numbers, turnover rate, and dendropoiesis. Alcohol Clin Exp Res. 2008;32:1309–1320. doi: 10.1111/j.1530-0277.2008.00699.x. [DOI] [PMC free article] [PubMed] [Google Scholar]
- Ewald SJ, Shao H. Ethanol increases apoptotic cell death of thymocytes in vitro. Alcohol Clin Exp Res. 1993;17:359–365. doi: 10.1111/j.1530-0277.1993.tb00776.x. [DOI] [PubMed] [Google Scholar]
- Frank I, Piatak M, Jr, Stoessel H, Romani N, Bonnyay D, Lifson JD, Pope M. Infectious and whole inactivated simian immunodeficiency viruses interact similarly with primate dendritic cells (DCs): differential intracellular fate of virions in mature and immature DCs. J Virol. 2002;76:2936–2951. doi: 10.1128/JVI.76.6.2936-2951.2002. [DOI] [PMC free article] [PubMed] [Google Scholar]
- Gonzalez-Quintela A, Campos J, Loidi L, Quinteiro C, Perez LF, Gude F. Serum TNF-alpha levels in relation to alcohol consumption and common TNF gene polymorphisms. Alcohol. 2008;42:513–518. doi: 10.1016/j.alcohol.2008.04.008. [DOI] [PubMed] [Google Scholar]
- Hirano N, Butler MO, Xia Z, Ansen S, von Bergwelt-Baildon MS, Neuberg D, Freeman GJ, Nadler LM. Engagement of CD83 ligand induces prolonged expansion of CD8+ T cells and preferential enrichment for antigen specificity. Blood. 2006;107:1528–1536. doi: 10.1182/blood-2005-05-2073. [DOI] [PMC free article] [PubMed] [Google Scholar]
- Jerrells TR, Slukvin I, Sibley D, Fuseler J. Increased susceptibility of experimental animals to infectious organisms as a consequence of ethanol consumption. Alcohol Alcohol Suppl. 1994;2:425–430. [PubMed] [Google Scholar]
- Joshi PC, Applewhite L, Mitchell PO, Fernainy K, Roman J, Eaton DC, Guidot DM. GM-CSF receptor expression and signaling is decreased in lungs of ethanol-fed rats. Am J Physiol Lung Cell Mol Physiol. 2006;291:L1150–L1158. doi: 10.1152/ajplung.00150.2006. [DOI] [PubMed] [Google Scholar]
- Karsunky H, Merad M, Mende I, Manz MG, Engleman EG, Weissman IL. Developmental origin of interferon-α-producing dendritic cells from hematopoietic precursors. Exp Hematol. 2005;33:173–181. doi: 10.1016/j.exphem.2004.10.010. [DOI] [PubMed] [Google Scholar]
- Lanzavecchia A, Sallusto F. Dynamics of T lymphocyte responses: intermediates, effectors, and memory cells. Science. 2000;290:92–97. doi: 10.1126/science.290.5489.92. [DOI] [PubMed] [Google Scholar]
- Lanzavecchia A, Sallusto F. Regulation of T Cell Immunity by Dendritic Cells. Cell. 2001;106:263–266. doi: 10.1016/s0092-8674(01)00455-x. [DOI] [PubMed] [Google Scholar]
- Laso FJ, Vaquero JM, Almeida J, Marcos M, Orfao A. Chronic alcohol consumption is associated with changes in the distribution, immunophenotype, and the inflammatory cytokine secretion profile of circulating dendritic cells. Alcohol Clin Exp Res. 2007;31:846–854. doi: 10.1111/j.1530-0277.2007.00377.x. [DOI] [PubMed] [Google Scholar]
- Latvala J, Parkkila S, Niemelä O. Excess alcohol consumption is common in patients with cytopenia: studies in blood and bone marrow cells. Alcohol Clin Exp Res. 2004;28:619–624. doi: 10.1097/01.alc.0000122766.54544.3b. [DOI] [PubMed] [Google Scholar]
- Lau AH, Abe M, Thomson AW. Ethanol affects the generation, cosignaling molecule expression, and function of plasmacytoid and myeloid dendritic cell subsets in vitro and in vivo. J Leukoc Biol. 2006;79:941–953. doi: 10.1189/jlb.0905517. [DOI] [PubMed] [Google Scholar]
- Le Bon A, Etchart N, Rossmann C, Ashton M, Hou S, Gewart D, Borrow P, Tough DF. Cross-priming of CD8+ T cells stimulated by virus-induced type I interferon. Nat Immunol. 2003;4:1009–1015. doi: 10.1038/ni978. [DOI] [PubMed] [Google Scholar]
- Lechmann M, Krooshoop DJEB, Dudziak D, Kremmer E, Kuhnt C, Figdor CG, Schuler G, Steinkasserer A. The extracellular domain of CD83 inhibits dendritic cell–mediated T cell stimulation and binds to a ligand on dendritic cells. J Exp Med. 2001;194:1813–1821. doi: 10.1084/jem.194.12.1813. [DOI] [PMC free article] [PubMed] [Google Scholar]
- Loof TG, Goldmann O, Medina E. Immune recognition of Streptococcus pyogenes by dendritic cells. Infect Immun. 2008;76:2785–2792. doi: 10.1128/IAI.01680-07. [DOI] [PMC free article] [PubMed] [Google Scholar]
- Mellman I, Steinman RM. Dendritic cells: specialized and regulated antigen processing machines. Cell. 2001;106:255–258. doi: 10.1016/s0092-8674(01)00449-4. [DOI] [PubMed] [Google Scholar]
- Miura Y, Gao Z, Miura M, Seo BM, Sonoyama W, Chen W, Gronthos S, Zhang L, Shi S. Mesenchymal stem cell-organized bone marrow elements: an alternative hematopoietic progenitor resource. Stem Cells. 2006;24:2428–2436. doi: 10.1634/stemcells.2006-0089. [DOI] [PubMed] [Google Scholar]
- Miyamoto T, Ohneda O, Arai F, Iwamoto K, Okada S, Takagi K, Anderson DM, Suda T. Bifurcation of osteoclasts and dendritic cells from common progenitors. Blood. 2001;98:2544–2554. doi: 10.1182/blood.v98.8.2544. [DOI] [PubMed] [Google Scholar]
- Mnasria K, Lagaraine C, Velge-Roussel F, Oueslati R, Lebranchu Y, Baron C. Anti-CD25 antibodies affect cytokine synthesis pattern of human dendritic cells and decrease their ability to prime allogeneic CD4+ T cells. J Leukoc Biol. 2008;84:460–467. doi: 10.1189/jlb.1007712. [DOI] [PubMed] [Google Scholar]
- Morad V, Pevsner-Fischer M, Barnees S, Samokovlisky A, Rousso-Noori L, Rosenfeld R, Zipori D. The myelopoietic supportive capacity of mesenchymal stromal cells is uncoupled from multipotency and is influenced by lineage determination and interference with glycosylation. Stem Cells. 2008;26:2275–2286. doi: 10.1634/stemcells.2007-0518. [DOI] [PubMed] [Google Scholar]
- Morelli AE, Zahorchak AF, Larregina AT, Colvin BL, Logar AJ, Takayama T, Falo LD, Thomson AW. Cytokine production by mouse myeloid dendritic cells in relation to differentiation and terminal maturation induced by lipopolysaccharide or CD40 ligation. Blood. 2001;98:1512–1523. doi: 10.1182/blood.v98.5.1512. [DOI] [PubMed] [Google Scholar]
- Olweus J, Bitmansour A, Warnke R, Thompson PA, Carballido J, Picker LJ, Lund-Johansen F. Dendritic cell ontogeny: A human dendritic cell lineage of myeloid origin. Proc Natl Acad Sci U S A. 1997;94:12551–12556. doi: 10.1073/pnas.94.23.12551. [DOI] [PMC free article] [PubMed] [Google Scholar]
- Pichyangkul S, Saengkrai P, Yongvanitchit K, Limsomwong C, Gettayacamin M, Walsh DS, Stewart VA, Ballou WR, Heppner DG. Isolation and characterization of rhesus blood dendritic cells using flow cytometry. J Immunol Meth. 2001;252:15–23. doi: 10.1016/s0022-1759(01)00327-1. [DOI] [PubMed] [Google Scholar]
- Shigematsu H, Reizis B, Iwasaki H, Mizuno S, Hu D, Traver D, Leder P, Sakaguchi N, Akashi K. Plasmacytoid dendritic cells activate lymphoid-specific genetic programs irrespective of their cellular origin. Immunity. 2004;21:43–53. doi: 10.1016/j.immuni.2004.06.011. [DOI] [PubMed] [Google Scholar]
- Singhal PC, Reddy K, Ding G, Kapasi A, Franki N, Ranjan R, Nwakoby IE, Gibbons N. Ethanol-induced macrophage apoptosis: the role of TGF-beta. J Immunol. 1999;162:3031–3036. [PubMed] [Google Scholar]
- Szabo G, Catalano D, White B, Mandrekar P. Acute alcohol consumption inhibits accessory cell function of monocytes and dendritic cells. Alcohol Clin Exp Res. 2004;28:824–828. doi: 10.1097/01.alc.0000127104.80398.9b. [DOI] [PubMed] [Google Scholar]
- Szabo G, Dolganiuc A, Mandrekar P, White B. Inhibition of antigen-presenting cell functions by alcohol: implications for hepatitis C virus infection. Alcohol. 2004;33:241–249. doi: 10.1016/j.alcohol.2004.07.003. [DOI] [PubMed] [Google Scholar]
- Szabo G, Mandrekar P, Oak S, Mayerle J. Effect of ethanol on inflammatory responses: implications for pancreatitis. Pancreatology. 2007;7:115–123. doi: 10.1159/000104236. [DOI] [PMC free article] [PubMed] [Google Scholar]
- Szabo G. Consequences of alcohol consumption on host defense. Alcohol Alcohol. 1999;34:830–841. doi: 10.1093/alcalc/34.6.830. [DOI] [PubMed] [Google Scholar]
- Taichman RS. Blood and bone: two tissues whose fates are intertwined to create the hematopoietic stem-cell niche. Blood. 2005;105:2631–2639. doi: 10.1182/blood-2004-06-2480. [DOI] [PubMed] [Google Scholar]
- Teleshova N, Kenney J, Jones J, Marshall J, Van Nest G, Dufour J, Bohm R, Lifson JD, Gettie A, Pope M. CpG-C Immunostimulatory oligodeoxyribonucleotide activation of plasmacytoid dendritic cells in rhesus macaques to augment the activation of IFN-γ-secreting simian immunodeficiency virus-specific T cells. J Immunol. 2004;173:1647–1657. doi: 10.4049/jimmunol.173.3.1647. [DOI] [PubMed] [Google Scholar]
- Thomas R, Lipsky PE. Dendritic cells: origin and differentiation. Stem Cells. 1996;14:196–206. doi: 10.1002/stem.140196. [DOI] [PubMed] [Google Scholar]
- Traver D, Akashi K, Manz M, Merad M, Miyamoto T, Engleman EG, Weissman IL. Development of CD8?-positive dendritic cells from a common myeloid progenitor. Science. 2000;290:2152–2154. doi: 10.1126/science.290.5499.2152. [DOI] [PubMed] [Google Scholar]
- Tschoep K, Manning TC, Harlin H, George C, Johnson M, Gajewski TF. Disparate functions of immature and mature human myeloid dendritic cells: implications for dendritic cell-based vaccines. J Leukoc Biol. 2003;74:69–80. doi: 10.1189/jlb.0702352. [DOI] [PubMed] [Google Scholar]
- Wahl EC, Liu L, Perrien DS, Aronson J, Hogue WR, Skinner RA, Hidestrand M, Ronis MJ, Badger TM, Lumpkin CK., Jr A novel mouse model for the study of the inhibitory effects of chronic ethanol exposure on direct bone formation. Alcohol. 2006;39:159–167. doi: 10.1016/j.alcohol.2006.08.004. [DOI] [PubMed] [Google Scholar]
- Wazeman FH, Gong Z. Adipogenic effect of alcohol on human bone marrow-derived mesenchymal stem cells. Alcohol Clin Exp Res. 2004;28:1091–1101. doi: 10.1097/01.alc.0000130808.49262.f5. [DOI] [PubMed] [Google Scholar]
- Yeh CH, Chang JK, Wang YH, Ho ML, Wang GJ. Ethanol may suppress Wnt/beta-catenin signaling on human bone marrow stroma cells: a preliminary study. Clin Orthop Relat Res. 2008;466:1047–1053. doi: 10.1007/s11999-008-0171-1. [DOI] [PMC free article] [PubMed] [Google Scholar]
- Yoneyama H, Matsuno K, Zhang Y, Murai M, Itakura M, Ishikawa S, Hasegawa G, Naito M, Asakura H, Matsushima K. Regulation by chemokines of circulating dendritic cell precursors, and the formation of portal tract–associated lymphoid tissue, in a granulomatous liver disease. J Exp Med. 2001;193:35–49. doi: 10.1084/jem.193.1.35. [DOI] [PMC free article] [PubMed] [Google Scholar]
- Yoneyama H, Narumi S, Zhang Y, Murai M, Baggiolini M, Lanzavecchia A, Ichida T, Asakura H, Matsushima K. Pivotal role of dendritic cell–derived CXCL10 in the retention of T helper cell 1 lymphocytes in secondary lymph nodes. J Exp Med. 2002;195:1257–1266. doi: 10.1084/jem.20011983. [DOI] [PMC free article] [PubMed] [Google Scholar]
- Zhao XJ, Marrero L, Song K, Oliver P, Chin SY, Simon H, Schurr JR, Zhang Z, Thoppil D, Lee S, Nelson S, Kolls JK. Acute alcohol inhibits TNF-alpha processing in human monocytes by inhibiting TNF/TNF-alpha-converting enzyme interactions in the cell membrane. J Immunol. 2003;170:2923–2931. doi: 10.4049/jimmunol.170.6.2923. [DOI] [PubMed] [Google Scholar]
- Zheng Y, Manzotti CN, Liu M, Burke F, Mead KI, Sansom DM. CD86 and CD80 differentially modulate the suppressive function of human regulatory T cells. J Immunol. 2004;172:2778–2784. doi: 10.4049/jimmunol.172.5.2778. [DOI] [PubMed] [Google Scholar]