

Abstract
A fundamental problem in biology is understanding the evolutionary emergence and maintenance of altruistic behaviors. A well-recognized conceptual insight is provided by a general mathematical relation, Hamilton's rule. This rule can in principle be invoked to explain natural examples of cooperation, but measuring the variables that it involves is a particularly challenging problem and controlling these variables experimentally an even more daunting task. Here, we overcome these difficulties by using a simple synthetic microbial system of producers and nonproducers of an extracellular growth-enhancing molecule, which acts as a ‘common good.' For this system, we are able to manipulate the intrinsic growth difference between producers and nonproducers, as well as the impact of the common good on the growth rate of its recipients. Our synthetic system is thus uniquely suited for studying the relation between the parameters entering Hamilton's rule and the quantities governing the systems' behavior. The experimental results highlight a crucial effect of nonlinearities in the response to the common good, which in general tend to limit the predictive value of Hamilton's rule.
Keywords: evolution of cooperation, Hamilton's rule, quorum sensing, synthetic biology
Introduction
The evolution and persistence of altruism, despite the direct fitness disadvantage associated with altruistic behaviors, have been intensely discussed since The Origin of Species (Darwin, 1872). The most influential contribution to this problem is Hamilton's rule (Hamilton, 1963, 1964, 1975), according to which cooperation in structured populations, and in particular altruism, requires that br>c, where b and c represent the ‘benefit' and ‘cost' of cooperation, whereas r corresponds to a measure of ‘relatedness' between individuals (see Box 1). This formulation illustrates very generally how cooperation can be consistent with natural selection acting at the level of individuals.
Hamilton's rule.
 |
A basic insight underlies Hamilton's rule: an altruist trait can be maintained in a population provided it preferentially benefits individuals sharing the same heritable propensity to behave altruistically. Three levels of selection are generally relevant: the lower level of genes, at which the heritable determinants of altruism are defined; the intermediate level of individuals, at which the altruistic phenotype is defined; and the higher level of groups of interacting individuals, at which the effects of altruism are defined. For haploid and asexual microorganisms, there is, however, no fundamental distinction between the genetic and phenotypic levels and only the individual and group levels need to be considered. In such cases, the central parameter is the probability for two altruists to interact, which is dictated by the structure of the interactions between individuals.
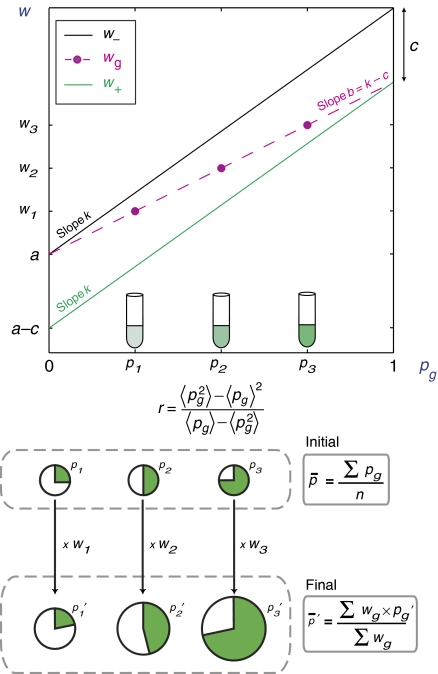
An example of such structure is a population distributed in several groups, indexed by g, where individuals interact exclusively with members of their group. As a simple model for intra-group interactions (Hamilton, 1975), we may assume that a group consists of a fraction pg of cooperators and 1−pg of non-cooperators, and that non-cooperators grow by a factor w− = a+kpg (black line in figure), whereas cooperators grow by the factor w+ = a+kpg−c (green line). Overall, such a group, therefore, grows by a factor wg = pg w++(1−pg) w− = a+bpg (dashed magenta line), where b = k−c. In this model, b>0 represents the ‘benefit' and c>0 the ‘cost' of cooperation. If several mixed groups are formed with different initial proportions pg of cooperators (represented in the figure as pie charts whose green slice is proportional to pg and area proportional to population size), a straightforward calculation, detailed in Supplementary Text S1, shows that the conditions for the global, population-wide proportion of cooperators to increase is
This inequality constitutes Hamilton's rule. The so-called relatedness coefficient, r, describes the bias for altruists to benefit from altruism and depends here only on the distribution (pg) of initial proportions. In the simplest case of equal group sizes, it is given by
 |
This model thus illustrates how altruism may be maintained by showing that Equation (1) can be satisfied (br−c>0), even if within each group g, non-altruistic individuals have the advantage (c>0).
We previously showed how such a model could be implemented in an actual microbial system of common good producers and nonproducers (representing ‘cooperators' and ‘non-cooperators', respectively) (Chuang et al, 2009). Modifications of this original system, presented in this study, however, generically lead to situations where the linear relation wg = a+bpg does not hold. The role of the population structure in maintaining cooperation may nevertheless still be described by relations (1) and (2) provided b and c are properly defined (see Supplementary Text S1). In particular, b should correspond to the regression coefficient β of wg on pg,
 |
Hamilton's rule can, therefore, always be invoked, but the parameters b and c may lose their interpretation as phenotypic properties defined at the level of individuals.
A considerable number of formal extensions of Hamilton's rule have concurred to reinforce its importance (Queller, 1985, 1992; Lehmann and Keller, 2006). Precisely connecting the various theoretical frameworks to actual biological systems, however, faces two major difficulties: (i) theoretically, Hamilton's rule derives its generality from its purely mathematical basis (Box 1; Supplementary Text S1), but this comes at an expense: the definitions of the parameters b, r, c can be subtle and may subsume many intricate and idiosyncratic details (Frank, 1998; Gardner et al, 2007); (ii) experimentally, r can be measured and varied (Gilbert et al, 2007), but measuring quantitatively the variables determining the cost and benefit parameters b and c can be time consuming and tricky (Grafen, 1984; Emlen and Wrege, 1992; Bowles and Posel, 2005; Krakauer, 2005), and even more challenging is manipulating these parameters in natural settings (Field et al, 2006). In this work, we overcome some of the problems of (ii) by using a tractable synthetic microbial system that allows us to explore experimentally the nature of difficulty (i).
Microbes have been argued recently to be choice systems for bridging the gap between theoretical models and biological phenomena (Crespi, 2001; Rainey and Rainey, 2003; Velicer, 2003; Kerr et al, 2006; Mehdiabadi et al, 2006; West et al, 2006; Gilbert et al, 2007; MacLean and Brandon, 2008; Gore et al, 2009). In addition, the field of synthetic biology has illustrated how design principles of biological networks can be investigated by forward engineering of novel behaviors in cells; the resulting systems, having been built from the ground up, are amenable to manipulation, thereby serving as simplified experimental systems for the study of more complex phenomena (Sprinzak and Elowitz, 2005; Mukherji and van Oudenaarden, 2009; Song et al, 2009; Tanouchi et al, 2009).
Thus, we previously built and analyzed a synthetic microbial system comprised of two genetically engineered ‘cooperator' and ‘noncooperator' strains of Escherichia coli, represented, respectively, by producers and nonproducers of a ‘common good.' The common good, specifically the small molecule Rhl autoinducer (Miller and Bassler, 2001), is synthesized solely by producers, but activates expression of the antibiotic resistance gene chloramphenicol acetyltransferase (cat) in both strains, as Rhl autoinducer is membrane permeable. In mixed cultures of producers and nonproducers containing the antibiotic chloramphenicol (Cm), nonproducers—which do not bear the burden of production—outgrow producers and increase in proportion at the expense of producers (Chuang et al, 2009).
This synthetic system may be viewed as an experimental implementation of one of the simplest models originally introduced by Hamilton for conceptual purposes (Box 1). By forming mixed groups, indexed by g, with sufficiently different initial proportions (pg) of producers, one can vary the parameter r characterizing the structure of the population, because r is here directly related to the distribution of the pg's, and a higher variance of pg results in higher r. It is thus possible to satisfy Hamilton's rule br−c>0, and to obtain an increase in the overall fraction of producers, Δp̄>0, despite the fact that within each mixed subpopulation, the proportion of producers decreases (Δpg<0 for all g)—a situation that can be interpreted as an instantiation of the so-called Simpson's paradox (Wagner, 1982). Experimentally, this is observed in the synthetic system (Chuang et al, 2009) when the variance of initial producer proportions, is sufficiently large (corresponding to high r).
An important feature of the synthetic approach is that both the structure of the population and the interactions between individuals can be experimentally manipulated. Whereas in previous work on Simpson's paradox we varied the population structure of a single-fixed system of producers and nonproducers (thus keeping the intrinsic properties of the system constant), here we hold constant the population structure while altering the nature of the interactions between producers and nonproducers. With the synthetic approach, we are able to modify with relative ease two intrinsic properties of the bacterial system: (i) the growth difference between producers and nonproducers, when having access to the same amount of common good autoinducer and (ii) the growth improvement, for both producers and nonproducers, because of the presence of autoinducer. Such modifications allow us to study quantitatively how varying the parameters associated with microbial biology affects the three parameters b, r and c entering Hamilton's rule.
Results and discussion
First, to control the growth difference between producers and nonproducers, we introduced an auxotrophic mutation, argHΔ, solely into the synthetic producer strain (Figure 1A). As the argH gene remains intact in nonproducers, varying the level of arginine (in minimal media) should allow us to tune the relative growth of producers compared with nonproducers. A similar approach using histidine mutants was recently used in a study of yeast cooperation (Gore et al, 2009). As expected, when arginine was not limiting, the growth of Arg− producers in the absence of antibiotic was equivalent to the original Arg+ producers (Figure 1B). As we lowered the arginine concentration, the overall growth of producers decreased (Figure 1B). This first modified system (Figure 1A) thus gives us the ability to test the effect of decreasing the growth of producers relative to nonproducers (see below).
Figure 1.

Decreasing the relative growth of producers versus nonproducers reverses the direction of selection. (A) Schematic of a modified producer–nonproducer system composed of Arg− (arginine auxotroph) producers and Arg+ nonproducers (see text and Materials and methods for details). (B) Growth curves of Arg− versus Arg+ producers grown in minimal media lacking antibiotic at 30°C with varying arginine concentrations (different colors; 1 × = 520 μM arginine). (C) The overall proportion of producers, Δp̄, decreases under selective conditions (in antibiotic; producer–nonproducer mixtures with pg distributed uniformly) when the arginine concentration is decreased. (Insets) Growth curves of producer–nonproducer mixtures (differing in pg) corresponding to two conditions of low (0.05 × ) and intermediate (0.3 × ) arginine concentrations. Note: With argHΔ, limiting arginine does not have large effects on growth rates, but rather overall growth levels—this does not affect our conclusions as what matters here is only how much growth occurred during the selection phase in antibiotic.
Second, to control the growth rate improvement conferred by the autoinducer common good, we increased the dosage of the rhlR gene, which encodes the transcription factor to which Rhl autoinducer must bind to activate resistance to antibiotic (Figure 2A). This was accomplished by transforming into both producers and nonproducers a second compatible plasmid, which either provided extra copies of rhlR (‘extra rhlR') or not (‘control'). As extra rhlR cells contain more autoinducer-sensitive transcription factor, they should respond more readily to the autoinducer common good. Indeed, when we added to a population of cells (producers or nonproducers) with extra rhlR the same amount of autoinducer as before, we observed that their growth rate in the presence of antibiotic increased compared with the original system (Figure 2B). This second modified system (Figure 2A) thus gives us the ability to test the effect of varying the influence of the common good.
Figure 2.

Increasing the antibiotic resistance response to autoinducer reverses the direction of selection. (A) Schematic of a modified producer–nonproducer system in which all autoinducer recipients have increased dosage (‘extra rhlR') of the autoinducer-responsive transcription factor gene, rhlR (see text and Materials and methods for details). (B) Growth curves of extra rhlR nonproducers versus control nonproducers in antibiotic in the presence of varying amounts of exogenously added autoinducer. (C) The overall proportion of producers, Δp̄, decreases under selective conditions (in antibiotic; producer–nonproducer mixtures with pg distributed uniformly) when autoinducer recipient cells were made more responsive to autoinducer by increased rhlR dosage (‘extra rhlR'). (Insets) Growth curves of producer–nonproducer mixtures (differing in pg) from the extra rhlR system (left) versus the control system (right).
To assess how varying these two elements would affect the interactions between producers and nonproducers, we performed experiments in which we measured the change in overall producer proportion (Δp̄) when producer–nonproducer subgroups were formed and grown in selective conditions in antibiotic-containing media. In each experiment, we fixed the compositions of the subgroups (i.e. fixed the distribution of pg) by creating mixtures containing 10, 20, 30, 40, 50, 60, 70, 80, 90, and 95% producers. In accordance with our previous study of Simpson's paradox, in large concentrations of arginine and without extra copies of rhlR, the change in total producer proportion Δp̄ in the whole population (ensemble of all subgroups) was positive, that is producers were overall favored (Chuang et al, 2009). Next, we changed either the amount of arginine (Figure 1C) or the dosage of rhlR (Figure 2C).
Using the first modified system with Arg− producers, we observed that the change in overall producer proportion Δp̄ became negative at low arginine concentrations (Figure 1C). This can be easily understood from the perspective of Hamilton's rule. With the proper definition of the parameters b, c and r (Box 1; Supplementary Text S1), decreasing the level of arginine in the first modified system (Figure 1A) leads to an increase of the cost parameter c, as intuitively expected, as well as a moderate decrease in b. Thus, the difference br−c can become negative, causing nonproducers to be favored in the overall population.
When using the second modified system with cells expressing extra copies of rhlR, we also observed a decrease in Δp̄ (Figure 2C). From the perspective of Hamilton's rule, this means that increasing the dosage of rhlR transcription factor in the second modified system (Figure 2A), which makes the autoinducer common good more helpful (as the same amount of autoinducer stimulates faster growth in antibiotic), leads to a nonintuitive decrease of the benefit parameter b. The reason is that the parameter b entering Hamilton's equation, given by Equation (3) of Box 1, is a linear regression coefficient. In a linear system, b is independent of the distribution of initial producer proportions (pg). However, the increased dosage of rhlR caused the relationship between growth and producer proportion to become nonlinear. As a result, b depends here both on the dosage of rhlR and on the distribution of the initial producer proportions pg (Figure 3); it is thus a nonintuitive function dependent both on ‘intrinsic' properties of the microbes and ‘extrinsic' properties of the population structure (Box 1).
Figure 3.

Interpretation of the ‘benefit' parameter b in the presence of nonlinearities. (A) Two different systems (blue and red) have different nonlinear relations between the initial proportion of cooperators, pg, in a mixed group, g, and the factor by which such a population is multiplied, wg. When different groups of equal size are formed, here two groups with proportion of producers p1 and p2, the value of b entering Hamilton's rule, Equation (1) of Box 1, is given by the regression coefficient b defined in Equation (3) of Box 1. This regression coefficient corresponds here to the slope of the line joining the two points associated with p1 and p2 on the curve (in the presence of more than two groups, b would correspond to the slope of the best linear interpolation between the different points). In this example bblue>bred in spite of the fact that the red system systematically outgrows the blue system with any given fraction of cooperators, i.e., wblue(pg)<wred(pg) for all pg. (B) Growth rates of extra rhlR (circles) and control (squares) nonproducers in the presence of varying amounts of Rhl autoinducer and antibiotic (Cm). Growth rates were determined by fitting growth curves to a logistic equation. The approximate range of autoinducer concentrations experienced by cells during an experiment of Figure 2C is outlined in the dashed magenta box.
Our synthetic microbial system clearly illustrates the general problem in applying Hamilton's rule to real biological systems (Gardner et al, 2007). As Hamilton's rule is a demonstrated mathematical inequality, the problem in analyzing any particular system centers on the relation between b, c and r and the parameters of the system (Box 1; Supplementary Text S1). This generally leads to parameters b and c that are not necessarily related in a simple way to the intrinsic parameters describing the organisms only, but also involve the population structure.
Thus, even if one has measured the values of b, c and r for a particular system of producers and nonproducers, one cannot predict what will result from changing either the structure of population or the biochemistry of the individuals. In particular, the growth (wg) of producer–nonproducer mixtures has to be a linear function of the fraction of producers (pg), as in the model in Box 1, for the knowledge of the values of b and c to provide a sufficient basis for predicting the evolution of the system upon changes of its population structure. Our original synthetic system (Chuang et al, 2009) was specifically designed to be in the linear regime. This property is, however, not generic and we found here that modifications of the system readily pushed it out of the linear regime.
A nonlinear growth response to a molecular signal (Figure 3) is a feature commonly found in biological systems and is probably inherent to common good-based cooperation in microbes. Hamilton's rule indicates that the maintenance of producers is typically destabilized relative to the ideal linear case. More precisely, the stronger the nonlinearities of the system, the stronger are the constraints on the population dynamics (e.g. constraints on the distribution into groups) implied by Hamilton's rule. This suggests that in each particular system under study, an important goal should be to characterize the nonlinearities controlling the dynamics of cooperating microorganisms. In a recent study of the problem of cooperation in yeast sucrose metabolism (Gore et al, 2009), for instance, nonlinear benefits explain why both invertase producers and nonproducers could mutually persist instead of being taken over by nonproducers.
We developed here an approach based on synthetic biology for addressing the nature of the main biological constraints underlying a general principle well known in evolutionary biology, Hamilton's rule. As a first step, we showed how a simple mathematical model (Box 1; Supplementary Text S1), which serves as a transparent illustration of Hamilton's rule, could be implemented in a microbial system (Chuang et al, 2009). We then took a further step by exploring the response of the synthetic system to different modifications, so as to understand how the properties of a generic biological system are most likely to deviate from those of our specifically designed system. As a result of this approach, we found that a major constraint for the maintenance of cooperation in microorganisms has the form of a nonlinear growth response to a molecular signal (Figure 3).
Beyond its specific conclusions, this study illustrates how synthetic biology can be used to develop and analyze mathematical models in a biological context, following an approach that could be extended to address other basic questions in biology beyond the maintenance of cooperation.
Materials and methods
Producer and nonproducer strains
The original system (Chuang et al, 2009) consists of a producer and nonproducer strain, both derived by plasmid transformation of E. coli strain JC1191, which has genotype att::rhl-catLVA(SpR) ΔsdiA::FRT rrnB3 ΔlacZ4787 hsdR514 Δ(araBAD)567 Δ(rhaBAD)568 rph-1. att::rhl-catLVA(SpR), which is the spectinomycin (Sp) resistance-marked integration (into the bacteriophage λ attachment site) of an Rhl autoinducer-responsive promoter (Prhl*) driving an unstable (Andersen et al, 1998) version of cat. Specifically, the ‘rhl-catLVA cassette' carries both PlacIq-rhlR and Prhl*-catLVA (Chuang et al, 2009). Therefore, the growth of rhl-catLVA strains in Cm is strongly dependent on Rhl autoinducer. Producers carry in addition the low copy, GFP-marked production plasmid, pZS*2R-GFP,rhlI, whereas nonproducers carry a control plasmid lacking GFP and rhlI. rhlI encodes Rhl autoinducer (C4-HSL) synthase (Parsek et al, 1999).
Plasmid and strain construction
An arginine-dependent producer was made by bacteriophage P1 transduction of argHΔ::FRT(kan) from the Keio reference strain JW3932 (Baba et al, 2006) into JC1191 to create JC1209. The kan marker was looped out using a transient source of Flp recombinase (Cherepanov and Wackernagel, 1995) and the resulting plasmid-free strain was transformed with the production plasmid to create JC1211. There is no significant cross-feeding of Arg− producers by Arg+ nonproducers. A producer–nonproducer pair with increased dosage of rhlR was created by transforming the original producer and nonproducer strains with a second compatible plasmid, pZA12-rhlR. This plasmid has a medium copy origin of replication (p15A), the ampicillin resistance gene β-lactamase (bla), and rhlR under control of the PLacO1 promoter. pZA12-rhlR was constructed by subcloning the rhlR coding sequence into pZA12 (Lutz and Bujard, 1997). As the strains in this study are LacI+, the increased copy number of rhlR only increases RhlR expression moderately through leakiness of the PLacO1 promoter. A control pair of producers and nonproducers with no further increase in rhlR dosage was created by transforming instead with the control vector pZA1R, which lacks rhlR. Strains carrying pZA1 vectors were maintained by selection with ampicillin (50 μg/ml).
Growth experiments and measurement of producer proportions
Growth media, growth conditions, and quantification of the relative growth of producers and nonproducers were performed as described (Chuang et al, 2009) except that for the experiments involving arginine limitation (Figure 1), the producer–nonproducer mixtures were subjected to an initial dilution of 1/50 into MOPS minimal media (Neidhardt et al, 1974) (supplemented with thiamine, uracil, dextrose, antibiotics, and arginine) containing 4.5 μg/ml Cm. 1X arginine is defined as 520 μM. In brief, a typical experiment involved setting up subpopulations with different proportions of producers (pg=10, 20, 30, 40, 50, 60, 70, 80, 90, and 95% producers). Each mixture was first diluted and grown in the absence of Cm, and then at ‘time 0,' each subpopulation was diluted into media containing Cm. Growth curves were obtained by periodic measurements of optical density at 600 nm (OD600) in a plate reader (Wallac Victor 2). Before (i.e. at time 0) and after a period of limited growth (12–14 h at 30°C), the initial (pg) and final (pg') producer proportions within each group were determined by flow cytometry as described (Chuang et al, 2009) The initial (p̄) and final (p̄′) global producer proportions were measured by pooling equal volumes of each subpopulation and subjecting the global pool to flow cytometry. The change in the global producer proportion, Δp̄, is defined as p̄′−p̄.
Supplementary Material
Supplementary information, Supplementary figures S1–2
Acknowledgments
We thank L Keller and all the members of our laboratory for comments and discussion. We thank the National BioResource Project (NIG, Japan) for E. coli strains. OR was supported by a Simons Foundation fellowship from Rockefeller University.
Footnotes
The authors declare that they have no conflict of interest.
References
- Andersen JB, Sternberg C, Poulsen LK, Bjorn SP, Givskov M, Molin S (1998) New unstable variants of green fluorescent protein for studies of transient gene expression in bacteria. Appl Environ Microbiol 64: 2240–2246 [DOI] [PMC free article] [PubMed] [Google Scholar]
- Baba T, Ara T, Hasegawa M, Takai Y, Okumura Y, Baba M, Datsenko KA, Tomita M, Wanner BL, Mori H (2006) Construction of Escherichia coli K-12 in-frame, single-gene knockout mutants: the Keio collection. Mol Syst Biol 2. 2006.0008 [DOI] [PMC free article] [PubMed] [Google Scholar]
- Bowles S, Posel D (2005) Genetic relatedness predicts South African migrant workers' remittances to their families. Nature 434: 380–383 [DOI] [PubMed] [Google Scholar]
- Cherepanov PP, Wackernagel W (1995) Gene disruption in Escherichia coli: TcR and KmR cassettes with the option of Flp-catalyzed excision of the antibiotic-resistance determinant. Gene 158: 9–14 [DOI] [PubMed] [Google Scholar]
- Chuang JS, Rivoire O, Leibler S (2009) Simpson's paradox in a synthetic microbial system. Science 323: 272–275 [DOI] [PubMed] [Google Scholar]
- Crespi BJ (2001) The evolution of social behavior in microorganisms. Trends Ecol Evol 16: 178–183 [DOI] [PubMed] [Google Scholar]
- Darwin CR (1872) The Origin of Species by Means of Natural Selection. 6 edn John Murray: London [Google Scholar]
- Emlen ST, Wrege PH (1992) Parent-offspring conflict and the recruitment of helpers among bee-eaters. Nature 356: 331–333 [Google Scholar]
- Field J, Cronin A, Bridge C (2006) Future fitness and helping in social queues. Nature 441: 214–217 [DOI] [PubMed] [Google Scholar]
- Frank SA (1998) Foundations of Social Evolution. Princeton University Press: Princeton, NJ [Google Scholar]
- Gardner A, West S, Barton NH (2007) The relation between Multilocus Population Genetics and Social Evolution Theory. Am Nat 169: 207–226 [DOI] [PubMed] [Google Scholar]
- Gilbert OM, Foster KR, Mehdiabadi NJ, Strassmann JE, Queller DC (2007) High relatedness maintains multicellular cooperation in a social amoeba by controlling cheater mutants. Proc Natl Acad Sci USA 104: 8913–8917 [DOI] [PMC free article] [PubMed] [Google Scholar]
- Gore J, Youk H, van Oudenaarden A (2009) Snowdrift game dynamics and facultative cheating in yeast. Nature 459: 253–256 [DOI] [PMC free article] [PubMed] [Google Scholar]
- Grafen A (1984) Natural selection, kin selection and group selection. In Behavioural Ecology. Krebs JR, Davies NB (eds), 2 edn, pp 62–84. Blackwell Scientific Publications: Oxford [Google Scholar]
- Hamilton WD (1963) The evolution of altruistic behavior. Am Nat 97: 354 [Google Scholar]
- Hamilton WD (1964) The genetical evolution of social behaviour. J Theor Biol 7: 1–52 [DOI] [PubMed] [Google Scholar]
- Hamilton WD (1975) Innate social aptitudes of man: an approach from evolutionary genetics. In ASA Studies 4: Biosocial Anthropology. Fox R (ed) pp 133–153. Malaby Press: London [Google Scholar]
- Kerr B, Neuhauser C, Bohannan BJM, Dean AM (2006) Local migration promotes competitive restraint in a host-pathogen ‘tragedy of the commons'. Nature 442: 75–78 [DOI] [PubMed] [Google Scholar]
- Krakauer AH (2005) Kin selection and cooperative courtship in wild turkeys. Nature 434: 69–72 [DOI] [PubMed] [Google Scholar]
- Lehmann L, Keller L (2006) The evolution of cooperation and altruism—a general framework and a classification of models. J Evol Biol 19: 1365–1376 [DOI] [PubMed] [Google Scholar]
- Lutz R, Bujard H (1997) Independent and tight regulation of transcriptional units in Escherichia coli via the LacR/O, the TetR/O and AraC/I1-I2 regulatory elements. Nucleic Acids Res 25: 1203–1210 [DOI] [PMC free article] [PubMed] [Google Scholar]
- MacLean CR, Brandon C (2008) Stable public goods cooperation and dynamic social interactions in yeast. J Evol Biol 21: 1836–1843 [DOI] [PubMed] [Google Scholar]
- Mehdiabadi NJ, Jack CN, Farnham TT, Platt TG, Kalla SE, Shaulsky G, Queller DC, Strassmann JE (2006) Social evolution: kin preference in a social microbe. Nature 442: 881–882 [DOI] [PubMed] [Google Scholar]
- Miller MB, Bassler BL (2001) Quorum sensing in bacteria. Annu Rev Microbiol 55: 165–199 [DOI] [PubMed] [Google Scholar]
- Mukherji S, van Oudenaarden A (2009) Synthetic biology: understanding biological design from synthetic circuits. Nat Rev Genet 10: 859–871 [DOI] [PMC free article] [PubMed] [Google Scholar]
- Neidhardt FC, Bloch PL, Smith DF (1974) Culture medium for Enterobacteria. J Bacteriol 119: 736–747 [DOI] [PMC free article] [PubMed] [Google Scholar]
- Parsek MR, Val DL, Hanzelka BL, Cronan JE, Greenberg EP (1999) Acyl homoserine-lactone quorum-sensing signal generation. Proc Natl Acad Sci USA 96: 4360–4365 [DOI] [PMC free article] [PubMed] [Google Scholar]
- Queller DC (1985) Kinship, reciprocity and synergism in the evolution of social behaviour. Nature 318: 366–367 [Google Scholar]
- Queller DC (1992) Quantitative genetics, inclusive fitness, and group selection. Am Nat 139: 540 [Google Scholar]
- Rainey PB, Rainey K (2003) Evolution of cooperation and conflict in experimental bacterial populations. Nature 425: 72–74 [DOI] [PubMed] [Google Scholar]
- Song H, Payne S, Gray M, You L (2009) Spatiotemporal modulation of biodiversity in a synthetic chemical-mediated ecosystem. Nat Chem Biol 5: 929–935 [DOI] [PMC free article] [PubMed] [Google Scholar]
- Sprinzak D, Elowitz MB (2005) Reconstruction of genetic circuits. Nature 438: 443–448 [DOI] [PubMed] [Google Scholar]
- Tanouchi Y, Pai A, You L (2009) Decoding biological principles using gene circuits. Mol BioSyst 5: 695–703 [DOI] [PubMed] [Google Scholar]
- Velicer GJ (2003) Social strife in the microbial world. Trends Microbiol 11: 330–337 [DOI] [PubMed] [Google Scholar]
- Wagner CH (1982) Simpson's paradox in real life. Am Stat 36: 46–48 [Google Scholar]
- West SA, Griffin AS, Gardner A, Diggle SP (2006) Social evolution theory for microorganisms. Nat Rev Micro 4: 597–607 [DOI] [PubMed] [Google Scholar]
Associated Data
This section collects any data citations, data availability statements, or supplementary materials included in this article.
Supplementary Materials
Supplementary information, Supplementary figures S1–2