Summary
Intracellular recording shows how differences in single cell subthreshold oscillation frequency could directly underlie the differences in spacing of grid cell firing locations shown previously in awake, behaving animals.
Grid cells in layer II of entorhinal cortex fire to spatial locations in a repeating hexagonal grid with smaller spacing between grid fields for neurons in more dorsal anatomical locations. Data from in vitro whole-cell patch recordings show a corresponding difference in frequency of subthreshold membrane potential oscillations in entorhinal neurons at different positions along the dorsal to ventral axis, supporting a model of physiological mechanism for grid cell responses.
The entorhinal cortex plays an important role in encoding of spatial information (1–3) and episodic memory (4). Many layer II neurons of rat entorhinal cortex are “grid cells,” firing when the rat is in an array of spatial locations forming a hexagonal grid within the environment (5–7). The spacing of firing fields in the grid varies with anatomical position of the cell along the dorsal to ventral axis of entorhinal cortex, as measured by distance from the postrhinal border (5). Neurons closer to the dorsal border of entorhinal cortex have shorter distances between firing fields. Computational models explicitly predict that differences in grid field spacing should correspond to differences in intrinsic frequencies of neurons along the dorsal to ventral axis (3, 8). This could provide systematic variation in the gain of a movement-speed signal for path integration (2, 3, 9).
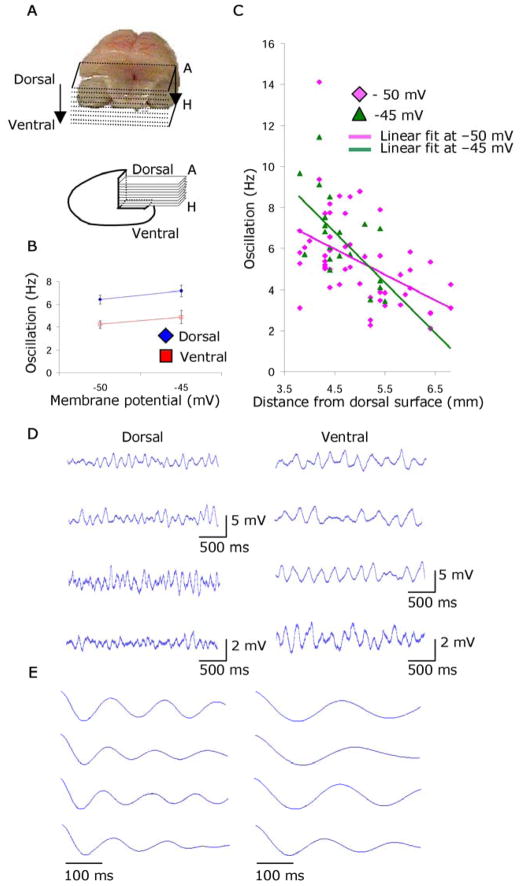
Subthreshold membrane potential oscillations in entorhinal cortical stellate cells (10) arise from a single-cell mechanism involving voltage-sensitive currents (11–13) and could contribute to network dynamics (14). We recorded subthreshold oscillations from 57 stellate cells in layer II of medial entorhinal cortex (Fig. S1) in slices from different anatomical positions along the dorsal to ventral axis, using whole-cell patch clamp techniques (15). The position of individual horizontal slices was measured relative to the dorsal surface of the brain (Fig. 1A).
Fig. 1.
Higher frequency of subthreshold oscillations in dorsal versus ventral entorhinal cortex. A. Top: Dorsal view of brain after slicing. Bottom: Sagittal view showing anatomical location of horizontal slices A to H. B. Mean frequency of subthreshold oscillations for neurons from dorsal slices (3.8 – 4.9 mm Bregma) and ventral slices (4.9 – 7.1 mm Bregma) at −50 mV and −45 mV. C. Subthreshold oscillation frequency plotted versus anatomical distance from dorsal surface. D. Examples of subthreshold oscillations at −50 mV in dorsal regions (left) and ventral regions (right). E. Corresponding autocorrelations used to measure frequency in D.
Stellate cells in dorsal entorhinal cortex show higher temporal frequencies of subthreshold membrane potential oscillations compared to lower frequencies in cells from more ventral entorhinal slices (Fig. 1B). Dorsal cells (n = 30) are defined as cells recorded in slices taken between 3.8 mm (the border with postrhinal cortex (16)) and 4.9 mm from the dorsal surface of the brain. Ventral cells (n = 27) are defined as cells recorded in slices between 4.9 and 7.1 mm from the dorsal surface. Fig. 1B shows the group means of the frequency of subthreshold oscillations recorded from these populations. Because frequency of subthreshold oscillations can depend upon the mean membrane potential voltage, we performed this analysis separately for data gathered at different approximate holding membrane potentials of −50 mV and −45 mV. The mean frequency in dorsal cells was significantly higher than the mean frequency in ventral cells for measurements at approximately −50 mV (dorsal = 6.42 ± .40 Hz, n = 28; ventral = 4.23 ± .32 Hz, n = 25; p < .001) and −45 mV (dorsal = 7.18 ± 0.50 Hz, n = 14; ventral = 4.88 ± .59 Hz, n = 7; p < .01). Frequencies were determined by an automated autocorrelation analysis algorithm (15) and were used throughout unless otherwise noted. The significant difference between mean frequencies was replicated with analyses using the peak in the power spectra for data at −50 mV (dorsal = 4.86 ± .37 Hz, n = 28; ventral = 3.44 ± .25 Hz, n = 25; p < .01) and −45 mV (dorsal = 5.54 ± .49 Hz, n = 14; ventral = 3.76 ± .31 Hz, n = 8; p < .01) (Fig. S2). The resting membrane potential, firing threshold, resistance and age (dorsal = 19.8 ± .4 days, ventral = 19.1 ± .4 days, p = NS) did not contribute to the difference in the frequency of oscillations observed between neurons from dorsal versus ventral slices (15).
Entorhinal neurons show a systematic difference in subthreshold oscillation frequency when plotted for different locations along the dorsal to ventral axis (Fig. 1C) for data at −50 mV (r = .48, Slope = −1.26) and at −45 mV (r = .60, Slope = −2.48). This resembles the difference in spatial periodicity of grid cells previously recorded from layer II at different positions along the dorsal to ventral axis in awake, behaving animals (5, 7). Fig. 1D presents examples of higher frequency subthreshold oscillations recorded from four individual dorsal entorhinal neurons on the left and lower frequency oscillations recorded from four ventral neurons on the right. Fig. 1E presents 500 ms segments of the autocorrelations computed for the same cells in Fig. 1D, demonstrating the difference in peak to peak wavelength.
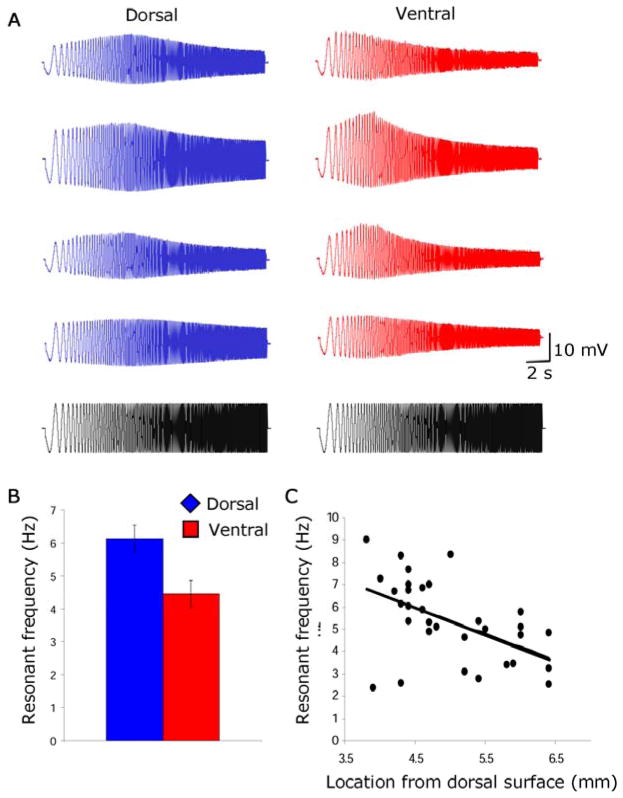
The frequency of subthreshold oscillations has been shown to correlate with the peak frequency of membrane potential resonance at rest (−60 – −64 mV) in entorhinal neurons (17). We evaluated the resonant frequency of neurons by delivering a 20 second long impedance amplitude profile (ZAP) stimulus and measuring the input frequency that caused the largest amplitude depolarization of membrane potential. Individual examples of the response to the ZAP stimulus are shown for four neurons from dorsal entorhinal slices (Fig. 2A) and four neurons from more ventral slices. The resonant frequency of stellate cells was significantly higher in dorsal cells compared to ventral cells (dorsal = 6.13 ± .41 Hz, n = 18; ventral = 4.45 ± .40 Hz, n = 14; p < .01)(Fig. 2B). There was no significant difference in resting potential between the populations used for this analysis (dorsal = −60.12 ± .26 mV, n = 18; ventral = −60.11 ± .26 mV, n = 14; p = NS). Resonant frequency was systematically higher in dorsal regions when plotted in relation to anatomical location (r = .51, slope = −1.18)(Fig. 2C).
Fig. 2.
Differences in resonance properties of neurons in dorsal versus ventral entorhinal cortex. A. Examples of resonance responses of neurons in dorsal (blue traces) and ventral entorhinal cortex (red traces) in response to impedance amplitude profile (ZAP) stimulus (black). B. Histogram of mean peak resonance frequency for neurons in dorsal versus ventral entorhinal cortex. C. Resonance frequency plotted versus anatomical distance from the dorsal surface.
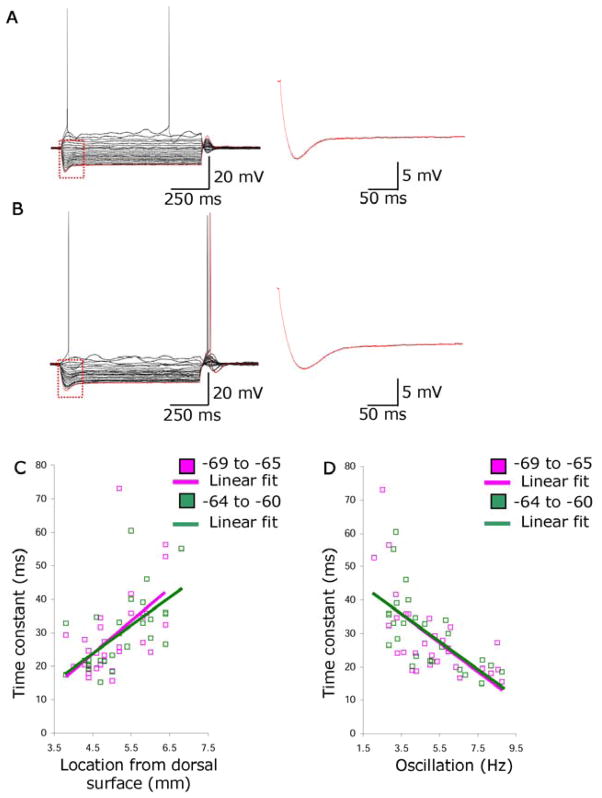
To analyze the relationship of subthreshold oscillations to other intrinsic properties, we measured the change in membrane potential during a hyperpolarizing current injection that usually caused a slow depolarizing shift (a “sag” of the membrane potential). The sag was fit with a dual exponential equation starting just after the trough of the sag and ending near the end of the current injection at steady state potential (Fig. 3A and 3B). The faster of the two time constants (τ1) of the sag was measured for hyperpolarizing current steps that ended at steady state membrane voltages of −69.9 to −65 mV (V1) and at steady state membrane voltages of −64.9 to −60 (V2). The time constant (τ1) of the sag increased with depth on the dorsal to ventral axis (V1, r = .55, slope = 9.67; V2, r = .61, slope = 8.23)(Fig. 3C) with significantly faster time constants in more dorsal portions compared to more ventral portions at V1 (dorsal = 23.37 ± 1.24 ms, n = 17; ventral = 35.52 ± 1.81 ms, n = 14; p < .01) and at V2 (dorsal = 22.37 ± 1.60 ms, n = 11; ventral = 34.71 ± 2.68 ms, n = 17; p < .01). The time constant of the sag correlated with the frequency of subthreshold oscillations (V1, r = .63, slope = −4.32; V2, r = .65, slope = −4.10)(Fig. 3D). Voltage-clamp studies are necessary to confirm underlying currents. A potential candidate is the h-current, which has been shown to underlie sag in stellate cells (11).
Fig. 3.
Relationship of subthreshold membrane potential oscillations to sag potential. For single neurons in dorsal (A) and ventral entorhinal cortex (B), traces on left show membrane potential responses to multiple current injection levels. Single traces (right) show sag potentials at higher resolution. C. First time constant of sag potential (ms) plotted versus anatomical location. D. Time constant of sag potential plotted versus subthreshold oscillation frequency.
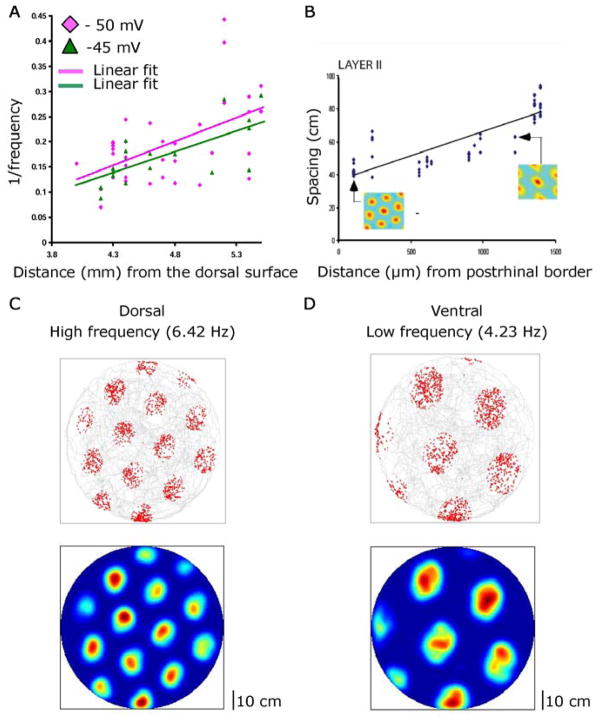
The differences in temporal frequency shown here correspond to differences in spatial periodicity of unit firing observed with extracellular recording in awake, behaving animals (5–7). Neurons at more dorsal locations show higher intrinsic subthreshold oscillation frequency in vitro and smaller spacing between grid fields in vivo. Fig. 4A plots the reciprocal of temporal frequency versus anatomical position revealing slopes similar to the slope of grid field spacing relative to anatomical position (Fig. 4B).
Fig. 4.
Subthreshold oscillations may underlie differences in grid field spacing. A. Reciprocal of oscillation frequency plotted versus anatomical depth for anatomical range matching a previous publication (7) as shown in B. C–D. Simulation of grid cell model (3, 8). Top: Gray indicates trajectory of simulated rat. Red indicates firing locations. Bottom: Firing rate map (red=maximum, blue=no spikes). Grid field spacing is small for mean dorsal oscillation frequency of 6.42 Hz (C) and larger for mean ventral frequency of 4.23 Hz (D).
These data support the prediction of a model (3, 8) related to other models of grid cells and theta phase precession (18–20). In this model, grid cell periodicity arises from an interference pattern generated by intrinsic temporal oscillations in the soma and dendrites of a single cell. During simulated rat movement, cells modulated by head direction and speed (7, 21, 22) shift the frequency of dendritic oscillations (consistent with voltage effects on frequency). The grid pattern is the product of interference by three dendritic oscillations, each receiving a different head direction input, shifting in and out of phase with soma oscillations in proportion to distance moved in the preferred direction of each head direction cell. Spiking occurs when all three dendrites are in phase with the soma, causing oscillations to cross threshold (Fig. S4 & S5). Spiking does not alter soma or dendritic phase, but occurs with theta rhythmicity, consistent with in vivo recordings in entorhinal cortex (5–7) and hippocampus (2, 9, 18), and potentially causing precession relative to field potential oscillations (3, 8, 19, 20).
The model (3, 8) was modified to include shifts in dendritic frequency proportional to soma frequency and to utilize a scaling factor H (Fig. S6) determined from the experimental data. Simulations (15) shown in Fig. 4C–D demonstrate that differences in temporal frequency of somatic oscillations result in different grid field spacing. Insertion of the experimentally determined value for subthreshold oscillation frequency (f) at a particular anatomical location results in simulated grid cell spacing that matches data (7) on grid cell spacing (G) at the same anatomical location (Fig. S7).
The model demonstrates one possible mechanism for path integration (2) and supports the prediction that systematic variation in gain of a movement-speed signal could underlie differences in grid field spacing (2, 9). The model is compatible with maintenance of grid cell representations by persistent firing (23) or attractor dynamics arising from patterned excitatory connectivity (2, 24, 25). Long-term stability of grid fields could require place cell input dependent on external landmarks (3, 8, 26). Differences in intrinsic frequency along the dorsal to ventral axis of entorhinal cortex could contribute to differences in place field size along the septal to temporal axis of the hippocampus (9, 27).
The systematic differences in intrinsic temporal frequency shown here may provide multiple scales for coding of both space and time. Periodic representation of the environment at multiple spatial scales could prove essential to mechanisms of path integration (2, 3, 9, 28), consistent with impairments after entorhinal lesions (1). Coding of continuous dimensions by interacting frequencies could also allow the coding of continuous relative time necessary for episodic memory (29). These results suggest that beyond simple summation of input, neural processing involves interactions of synaptic input and interference between intrinsic frequencies (9, 18, 19).
Supplementary Material
Acknowledgments
Thanks to Edvard Moser, May-Britt Moser, Motoharu Yoshida, Kyle Lillis, Howard Eichenbaum and John White for advice and comments. Research supported by NIMH MH60013, Silvio O. Conte Center grant NIMH MH71702, NSF SLC SBE 0354378 and NIDA DA16454 (part of the CRCNS program).
Contributor Information
Lisa M. Giocomo, Email: giocomo@bu.edu.
Michael E. Hasselmo, Email: hasselmo@bu.edu.
References and notes
- 1.Steffenach HA, Witter M, Moser MB, Moser EI. Neuron. 2005;45:301–13. doi: 10.1016/j.neuron.2004.12.044. [DOI] [PubMed] [Google Scholar]
- 2.McNaughton BL, Battaglia FP, Jensen O, Moser EI, Moser MB. Nat Rev Neurosci. 2006;7:663–78. doi: 10.1038/nrn1932. [DOI] [PubMed] [Google Scholar]
- 3.O’Keefe J, Burgess N. Hippocampus. 2005;15:853–66. doi: 10.1002/hipo.20115. [DOI] [PMC free article] [PubMed] [Google Scholar]
- 4.Eichenbaum H, Cohen NJ. From conditioning to conscious recollection. Oxford University Press; New York: 2003. [Google Scholar]
- 5.Hafting T, Fyhn M, Molden S, Moser MB, Moser EI. Nature. 2005;436:801–6. doi: 10.1038/nature03721. [DOI] [PubMed] [Google Scholar]
- 6.Fyhn M, Molden S, Witter MP, Moser EI, Moser MB. Science. 2004;305:1258–64. doi: 10.1126/science.1099901. [DOI] [PubMed] [Google Scholar]
- 7.Sargolini F, et al. Science. 2006;312:758–62. doi: 10.1126/science.1125572. [DOI] [PubMed] [Google Scholar]
- 8.Burgess N, Barry C, Jeffery KJ, O’Keefe J. paper presented at the Computational Cognitive Neuroscience Meeting; Washington, D.C. 2005. [Google Scholar]
- 9.Maurer AP, Vanrhoads SR, Sutherland GR, Lipa P, McNaughton BL. Hippocampus. 2005;15:841–52. doi: 10.1002/hipo.20114. [DOI] [PubMed] [Google Scholar]
- 10.Alonso A, Llinas RR. Nature. 1989;342:175–177. doi: 10.1038/342175a0. [DOI] [PubMed] [Google Scholar]
- 11.Dickson CT, et al. J Neurophysiol. 2000;83:2562–79. doi: 10.1152/jn.2000.83.5.2562. [DOI] [PubMed] [Google Scholar]
- 12.Fransen E, Alonso AA, Dickson CT, Magistretti J, Hasselmo ME. Hippocampus. 2004;14:368–84. doi: 10.1002/hipo.10198. [DOI] [PubMed] [Google Scholar]
- 13.White JA, Klink R, Alonso A, Kay AR. J Neurophysiol. 1998;80:262–9. doi: 10.1152/jn.1998.80.1.262. [DOI] [PubMed] [Google Scholar]
- 14.Acker CD, Kopell N, White JA. J Comput Neurosci. 2003;15:71–90. doi: 10.1023/a:1024474819512. [DOI] [PubMed] [Google Scholar]
- 15.See, Supplementary On-line Materials.
- 16.Paxinos G, Watson C. The rat brain in stereotaxic coordinates. Academic Press; San Diego, CA: 1998. [Google Scholar]
- 17.Erchova I, Kreck G, Heinemann U, Herz AV. J Physiol. 2004;560:89–110. doi: 10.1113/jphysiol.2004.069930. [DOI] [PMC free article] [PubMed] [Google Scholar]
- 18.O’Keefe J, Recce ML. Hippocampus. 1993;3:317–330. doi: 10.1002/hipo.450030307. [DOI] [PubMed] [Google Scholar]
- 19.Lengyel M, Szatmary Z, Erdi P. Hippocampus. 2003;13:700–14. doi: 10.1002/hipo.10116. [DOI] [PubMed] [Google Scholar]
- 20.Blair HT, Welday AC, Zhang K. Soc Neurosci Abstr. 2006;32:574.14. [Google Scholar]
- 21.Taube JS, Bassett JP. Cereb Cortex. 2003;13:1162–72. doi: 10.1093/cercor/bhg102. [DOI] [PubMed] [Google Scholar]
- 22.Sharp PE, Blair HT, Cho J. Trends Neurosci. 2001;24:289–94. doi: 10.1016/s0166-2236(00)01797-5. [DOI] [PubMed] [Google Scholar]
- 23.Fransén E, Tahvildari B, Egorov AV, Hasselmo ME, Alonso AA. Neuron. 2006;49:735–46. doi: 10.1016/j.neuron.2006.01.036. [DOI] [PubMed] [Google Scholar]
- 24.Fuhs MC, Touretzky DS. J Neurosci. 2006;26:4266–76. doi: 10.1523/JNEUROSCI.4353-05.2006. [DOI] [PMC free article] [PubMed] [Google Scholar]
- 25.Samsonovich A, McNaughton BL. J Neurosci. 1997;17:5900–5920. doi: 10.1523/JNEUROSCI.17-15-05900.1997. [DOI] [PMC free article] [PubMed] [Google Scholar]
- 26.Knierim JJ, Kudrimoti HS, McNaughton BL. J Neurophysiol. 1998;80:425–46. doi: 10.1152/jn.1998.80.1.425. [DOI] [PubMed] [Google Scholar]
- 27.Solstad T, Moser EI, Einevoll GT. Hippocampus. 2006 doi: 10.1002/hipo.20244. [DOI] [PubMed] [Google Scholar]
- 28.Redish AD, Touretzky DS. Hippocampus. 1997;7:15–35. doi: 10.1002/(SICI)1098-1063(1997)7:1<15::AID-HIPO3>3.0.CO;2-6. [DOI] [PubMed] [Google Scholar]
- 29.Hasselmo ME, Eichenbaum H. Neural Networks. 2005;15:689–707. doi: 10.1016/j.neunet.2005.08.007. [DOI] [PMC free article] [PubMed] [Google Scholar]
Associated Data
This section collects any data citations, data availability statements, or supplementary materials included in this article.


