

Abstract
Pyruvate is located at a metabolic junction of assimilatory and dissimilatory pathways and represents a switch point between respiratory and fermentative metabolism. In Escherichia coli, the pyruvate dehydrogenase complex (PDHC) and pyruvate formate-lyase are considered the primary routes of pyruvate conversion to acetyl-CoA for aerobic respiration and anaerobic fermentation, respectively. During glucose fermentation, the in vivo activity of PDHC has been reported as either very low or undetectable, and the role of this enzyme remains unknown. In this study, a comprehensive characterization of wild-type E. coli MG1655 and a PDHC-deficient derivative (Pdh) led to the identification of the role of PDHC in the anaerobic fermentation of glucose. The metabolism of these strains was investigated by using a mixture of 13C-labeled and -unlabeled glucose followed by the analysis of the labeling pattern in protein-bound amino acids via two-dimensional 13C,1H NMR spectroscopy. Metabolite balancing, biosynthetic 13C labeling of proteinogenic amino acids, and isotopomer balancing all indicated a large increase in the flux of the oxidative branch of the pentose phosphate pathway (ox-PPP) in response to the PDHC deficiency. Because both ox-PPP and PDHC generate CO2 and the calculated CO2 evolution rate was significantly reduced in Pdh, it was hypothesized that the role of PDHC is to provide CO2 for cell growth. The similarly negative impact of either PDHC or ox-PPP deficiencies, and an even more pronounced impairment of cell growth in a strain lacking both ox-PPP and PDHC, provided further support for this hypothesis. The three strains exhibited similar phenotypes in the presence of an external source of CO2, thus confirming the role of PDHC. Activation of formate hydrogen-lyase (which converts formate to CO2 and H2) rendered the PDHC deficiency silent, but its negative impact reappeared in a strain lacking both PDHC and formate hydrogen-lyase. A stoichiometric analysis of CO2 generation via PDHC and ox-PPP revealed that the PDHC route is more carbon- and energy-efficient, in agreement with its beneficial role in cell growth.
Keywords: Carbon Dioxide, Energy Metabolism, Glucose Metabolism, Intermediary Metabolism, Mathematical Modeling, Pyruvate Dehydrogenase Complex, Isotopomer Balancing, Metabolic Flux Analysis, Biosynthetic 13C Labeling of Proteinogenic Amino Acids
Introduction
The fermentative metabolism of glucose has been extensively studied in many organisms, especially in the model bacterium Escherichia coli (1). As shown in Fig. 1, glucose is concomitantly transported and phosphorylated by the phosphoenolpyruvate-dependent phosphotransferase system (2, 3). The resulting glucose 6-phosphate is processed via the Embden-Meyerhof-Parnas (EMP)2 pathway and the pentose phosphate pathway (PPP) (4) to provide ATP, reducing power and carbon skeletons for biosynthesis. In the absence of external electron acceptors (i.e. under fermentative conditions), E. coli converts most of the glucose to a mixture of organic acids (acetate, formate, lactate, and succinate), ethanol, carbon dioxide, and hydrogen (Fig. 1) (1). Most of these fermentation products are generated from pyruvate (Fig. 1).
FIGURE 1.

Pathways involved in the synthesis of fermentation products, precursor metabolites, ATP, and reducing equivalents during the fermentative utilization of glucose by E. coli. Enzyme(s) catalyzing shown reaction(s) are as follows. Glucose transport and phosphorylation: (1), phosphoenolpyruvate-dependent phosphotransferase system (PTS); EMP: (2), phosphoglucose isomerase; (3), 6-phosphofructokinase; (4), fructose bisphosphate aldolase; (5), triose-phosphate isomerase; (6), glyceraldehyde-3-phosphate dehydrogenase; (7), phosphoglycerate kinase; (8), phosphoglycerate mutases and enolase; (9), pyruvate kinase. Ox-PPP: (10), glucose-6-phosphate dehydrogenase; (11), 6-phosphogluconolactonase; and (12), 6-phosphogluconate dehydrogenase. Non-ox-PPP: (13), ribulose phosphate 3-epimerase; (14), ribose-5-phosphate isomerases; (15), transketolases; and (16), transaldolases. Oxidative and reductive branches of the TCA cycle: (17), citrate synthase and acomitases; (18), isocitrate dehydrogenase; (19), malate dehydrogenase and fumarases; and (20), fumarate reductase. Anaplerotic reaction: (21), phosphoenolpyruvate carboxylase. Pyruvate dissimilation: (22), pyruvate formate-lyase; (23), pyruvate dehydrogenase complex. Fermentation: (24), lactate dehydrogenase; (25), formate hydrogen-lyase; (26), phosphate acetyltransferase; (27), acetate kinase; (28), alcohol/acetaldehyde dehydrogenase. Transhydrogenases: (29), soluble and membrane-bound pyridine nucleotide transhydrogenases. Cell growth: (30), synthesis of cell mass from precursor metabolites (★), ATP, and reducing equivalents. Broken lines indicate multiple steps. The following abbreviation are used: ACK, acetate kinase; ADH, alcohol dehydrogenase; AKG, α-ketoglutarate; DHAP, dihydroxyacetone phosphate; E4P, erythrose 4-phosphate; FRU16P, fructose 1,6-bisphosphate; FRU6P, fructose 6-phosphate; FUM, fumarate; GALP, glyceraldehyde 3-phosphate; GLC6P, glucose 6-phosphate; ICIT, isocitrate; OAA, oxaloacetate; PEP, phosphoenolpyruvate; PGLU, 6-phospho-d-gluconate; PGLUL, d-glucono-δ-lactone-6-phosphate; POX, pyruvate oxidase; PP, pentose phosphate; PPP, pentose phosphate pathway; PTA, phosphate acetyltransferase; PYK, pyruvate kinase; PYR, pyruvate; RL5P, ribulose 5-phosphate; R5P, ribose 5-phosphate; S7P, sedoheptulose 7-phosphate; T3P, combined pool of GALP and DHAP; X5P, xylose 5-phosphate; 13PG, 1,3-diphosphate glycerate; 3PG, 3-phosphoglycerate.
Pyruvate is located at a major metabolic node linking carbohydrate catabolism to energy generation and biosynthesis and also represents a major switch point between respiratory and fermentative metabolism. In this context, pyruvate formate-lyase (PFL) and the pyruvate dehydrogenase complex (PDHC) are considered the major routes for pyruvate dissimilation in E. coli (Fig. 1) (1). During aerobic growth, pyruvate is converted to acetyl coenzyme A (AcCoA), carbon dioxide, and NADH by PDHC. AcCoA enters the tricarboxylic acid cycle, where it is further oxidized to carbon dioxide, generating reducing equivalents that support ATP production through coupling to the electron transport systems and oxidative phosphorylation. During anaerobic fermentation, PFL replaces PDHC converting pyruvate to AcCoA and formate. AcCoA leads to the synthesis of fermentation products acetate and ethanol, which contribute to ATP generation and maintenance of redox balance, respectively (Fig. 1). The in vivo activity of PDHC during glucose fermentation has been reported as either very low or undetectable (1, 5–7). Even when active to some extent, PDHC cannot support fermentative growth on glucose in the absence of PFL unless the medium is supplemented with acetate (1, 6, 8). The role of PDHC in the fermentative metabolism of glucose by E. coli remained unknown prior to the work reported here.
This study focuses on a comprehensive metabolic analysis of wild-type E. coli and a PDHC-deficient derivative during the fermentative metabolism of glucose. Significant differences between the two strains were identified with the use of metabolite balancing, biosynthetic 13C labeling of proteinogenic amino acids, and isotopomer balancing. This analysis led to the hypothesis that PDHC is responsible for the generation of CO2 during glucose fermentation. The proposed role of PDHC was verified experimentally.
EXPERIMENTAL PROCEDURES
Strains, Plasmids, and Genetic Methods
E. coli K12 strain MG1655, used as the wild-type strain, and mutant FB23645 (aceF::Tn5KAN-I-SceI, referred to in this study as Pdh, pyruvate dehydrogenase complex deficient) were obtained from the University of Wisconsin E. coli Genome Project (9). Deletion mutants JW1841 (Δzwf-FRT-Kan-FRT), JW4040 (ΔfdhF-FRT-Kan-FRT), and JW0855 (ΔpoxB-FRT-Kan-FRT) were obtained from the National BioResource Project, National Institute of Genetics, Japan (10). Single mutants Zwf (Zwf = glucose-6-P dehydrogenase-deficient), Fdh (formate dehydrogenase-deficient), and Pox (pyruvate oxidase-deficient) were constructed by introducing the zwf, fdhF, and poxB deletion from JW1841, JW4040, and JW0855, respectively, into MG1655 using P1 phage transduction. Double mutants Pdh-Zwf (pyruvate dehydrogenase complex and glucose-6-P dehydrogenase-deficient) and Pdh-Fdh (pyruvate dehydrogenase complex and formate dehydrogenase-deficient) were constructed by transferring the aceF mutation from strain Pdh into strains Zwf and Fdh, respectively. Details of the specific protocol used in phage transduction are available elsewhere (11, 12). Manufacturer protocols and standard methods (12, 13) were followed for DNA purification (Qiagen, Valencia, CA), restriction endonuclease digestion (New England Biolabs, Ipswich, MA), electroporation, and DNA amplification (Stratagene, La Jolla, CA, and Invitrogen). The strains were kept in 32.5% glycerol stocks at −80 °C. Plates were prepared using Luria-Bertani (LB) medium containing 1.5% (w/v) agar, and kanamycin was included (when required) at a final concentration of 50 μg/ml.
Culture Medium and Cultivation Conditions
The minimal medium designed by Neidhardt et al. (14) supplemented with 5 g/liter glucose was used unless otherwise specified. A 10× concentrate of this medium was prepared and filter-sterilized before storing at −20 °C. Kanamycin was included when required at a final concentration of 50 μg/ml. Chemicals were obtained from Fisher and Sigma, except 13C-labeled glucose (both 1-carbon and uniformly labeled), which was obtained from Cambridge Isotope Ltd (Andover, MA).
Fermentations were conducted in a SixFors multifermentation system (Infors HT, Bottmingen, Switzerland) with six 400-ml working volume vessels and independent control of temperature (37 °C), pH (7.4, unless otherwise specified), and stirrer speed (300 rpm) (15). Anaerobic conditions were maintained as follows. The medium was sparged with ultra-high purity argon (Matheson, Tri-Gas, Houston, TX), which was passed through an oxygen trap (Alltech Associates, Inc., Deerfield, IL) to eliminate traces of oxygen. The vessels were then closed to prevent any exchange of gases. 3 m NaOH and H2SO4 were used to control the pH.
Pre-cultures used to inoculate the above fermentors were prepared as follows. A single colony was used to inoculate 17-ml Hungate tubes (Bellco Glass, Inc., Vineland, NJ) filled with LB media (pH 7.4) supplemented with 5 g/liter glucose. The tubes were placed in a rotator and kept at 37 °C. Upon reaching an A550 density between 0.3 and 0.4, the cultures were centrifuged and the pellet washed and resuspended in minimal medium (pH 7.4) to an A550 of 0.02. This inoculated minimal medium was incubated in completely filled Hungate tubes as described above until the cultures reached an A550 between 0.3 and 0.4. An appropriate volume of the culture was harvested, the pellet resuspended in 10 ml of minimal medium, and the resulting suspension used to inoculate the fermentors with a target starting A550 of 0.02. The starting A550 for the experiments with labeled glucose was below 0.02. Prior to use, strains (stored as glycerol stocks at −80 °C) were streaked onto LB plates (with appropriate antibiotics if required) and incubated overnight at 37 °C in an Oxoid anaerobic jar with the CO2 gas-generating kit (Oxoid, Basingstoke, UK).
Analytical Methods
Absorbance was measured at 550 nm in a Thermo Spectronic Genesys 20 spectrophotometer (Thermo Scientific, MA) and used as an estimate of cell mass (1 A550 = 0.34 g dry weight/liter). After centrifugation, the supernatants were stored at −20 °C for HPLC analysis using a Shimadzu Prominence SIL 20 system (Shimadzu Scientific Instruments Inc., Columbia, MD) equipped with an HPX-87H organic acid column (Bio-Rad). Specific details about quantification of glucose, organic acids, ethanol, and hydrogen were previously reported (15, 16). The identity of fermentation products was verified via one-dimensional 1H NMR as described previously (15, 17)
Enzyme Activities
Actively growing cells were harvested by centrifugation, washed twice with a saline solution (9 g/liter NaCl), and stored as cell pellets at −80 °C until use. Cell pellets were resuspended in 0.1 m potassium phosphate buffer to obtain ∼3.4 mg dry cell weight/ml and permeabilized with chloroform (17). The activity of the pyruvate dehydrogenase complex (toward pyruvate) was monitored spectrophotometrically by following the reduction of NAD+ at 340 nm (18, 19). The reaction mixture (1 ml, final pH 7.0) contained 50 mm potassium phosphate (pH 8.0), 2.0 mm sodium pyruvate, 2.5 mm NAD+, 1.0 mm MgCl2, 2.6 mm cystine-HCl, 0.13 mm CoASH, 0.2 mm thiamine pyrophosphate (19), and 50 μl of permeabilized cells prepared as described above. Linearity of the reactions (protein concentration and time) was established for all preparations. All spectrophotometric measurements were conducted in a BioMate 5 spectrophotometer (Thermo Scientific). The nonenzymatic rates were subtracted from the observed initial reaction rates. Enzyme activities are reported as micromoles of pyruvate oxidized per min/mg of cell protein and represent averages for at least three cell preparations. Total cell protein was assumed to represent 50% of the cell dry weight.
Calculation of Fermentation Parameters
Specific growth rates (μ, h−1) were estimated by plotting total cell concentration versus time in a log linear plot. The slope of the curves thus obtained was used as the average specific rate. These curves become straight lines during exponential growth and the calculated specific rate reaches its maximum value (μm). Specific rates (mmol/g cell/h) during the exponential growth phase were calculated from data for glucose consumption and product synthesis and used to demonstrate balanced growth, as described previously (20) and discussed in detail in the supplemental text. Rates are reported as averages ± S.D. calculated from at least three independent samples taken during the exponential growth phase. Growth and product yields (weight or molar basis) were calculated as the amount of cell mass or product synthesized per amount of glucose consumed. In the above calculations, an average molecular weight of 25.1 was used, which corresponds to an average E. coli cell of a molecular formula CH1.81O0.52N0.21 (21).
Sample Preparation for NMR Experiments
An experiment with 13C-labeled glucose was conducted to assess the incorporation of this carbon source into proteinogenic biomass, information that was then used to calculate isotopomer abundances (see below) and estimate intracellular fluxes (see under “In Vivo Metabolic Flux Analysis”). Cultures were grown in fermentors, as described under “Culture Medium and Cultivation Conditions,” using a complex mixture of labeled and unlabeled glucose (12.5% [U-13C]glucose, 25% [1-13C]glucose, and 62.5% unlabeled glucose). This mixture was previously determined to be optimal for the estimation of intracellular fluxes during the fermentative metabolism of glucose in E. coli.3 Cells were harvested in the middle of the exponential phase after at least five generations to ensure metabolic and isotopic steady state (see supplemental text for details). The resulting pellets were washed twice with 5 g/liter NaCl and stored at −80 °C. Pellets were thawed and hydrolyzed by adding an appropriate amount of 6 n constant boiling HCl (1 ml per 6 mg of protein) in a vacuum hydrolysis tube (Pierce), and the atmosphere was exchanged three times with argon. The resulting mixture was incubated at 110 °C for 24 h on a Reacti-Therm hydrolysis system (Pierce). To remove the acid, the biomass hydrolysates were subjected to rapid vaporization at 75 °C under vacuum for 4 h using a CentriVap system (Labconco Corp., Kansas City, MO). The dried samples were reconstituted in 1 ml of D2O (Cambridge Isotope Laboratories, Cambridge, MA), frozen to −80 °C, and subsequently freeze-dried for 24 h in a 4.5-liter FreeZone freeze-dry system (Labconco Corp., Kansas City, MO). The samples were then reconstituted in 600 μl of D2O and filtered to remove cell particulates, and the pH was adjusted to 1 using DCl.
NMR Spectroscopy, Isotopomer Abundances, and Probabilistic Equations for the Analysis of Carbon-Carbon Connectivity
Samples prepared as described above were analyzed via NMR spectroscopy to determine the labeling pattern of proteinogenic amino acids. Two-dimensional heteronuclear single-quantum coherence 13C,1H correlation (two-dimensional 13C-1H HSQC) NMR spectra (23–25) were acquired on a 500-MHz Varian Innova spectrometer (Varian, Inc., Palo Alto, CA) at 298 K. The parameters used for data acquisition were as follows: sweep width 6 kHz, acquisition time 0.085 s, coupling constant (JCH) 143, decoupler offset (carbon carrier position) 30 ppm (for aliphatic), and 117 ppm (for aromatic), decoupler power (power in carbon dimension) 44, sweep width (carbon dimension) 30 ppm (for aliphatic), and 60 ppm (for aromatic), Globally Optimized Alternating Phase Rectangular Pulse decoupling with a field strength of 2.7 kHz, and ni (number of transients in carbon dimension) 2500. The reference to 0 ppm was set using the methyl signal of 4,4-dimethyl-4-silapentane-1-sulfonic acid (Sigma) as an internal standard.
The raw data (FIDs) were transformed into two-dimensional spectra in NMRViewTM format by using the software NMRPipe (26). The resulting spectra were analyzed to estimate the intensity of individual peaks in the multiplet patterns for different carbon atoms of detected amino acids using NMRViewTM (27). Overlapping multiplets (α-amino acid), which could not be processed with NMRViewTM, were quantified by previously reported peak deconvolution software (28).
The intensity of individual peaks in the multiplet patterns for different carbon atoms of detected amino acids were used to calculate the abundance of each isotopomer. Amino acid isotopomer abundances obtained from the 13C,1H HSQC spectra can be translated to isotopomer abundances of metabolic precursors by using retrobiosynthetic reconstruction as described by Szypreski (29).
In Vivo Metabolic Flux Analysis
In vivo metabolic flux analysis was conducted using two different approaches. First, intracellular fluxes were estimated based on network stoichiometry and extracellular measurements using a technique known as metabolite balancing (30, 31). The stoichiometric model used for this purpose consisted of 80 reactions (fluxes) and 74 balanceable metabolites (see supplemental Table 1a), thus resulting in a system with six degrees of freedom. The fermentation data were used to calculate six extracellular fluxes (i.e. specific rates) associated with cell growth, consumption of glucose, and synthesis of fermentation products during exponential growth. The availability of these measurements made the system determined and allowed the calculation of intracellular fluxes without the use of an optimization routine. Three independent pairs of measurements were used in the calculations, thus allowing the estimation of standard deviations.
A second in vivo metabolic flux analysis technique, based on the use of 13C-labeled glucose followed by NMR analysis and isotopomer balancing (30), was also used for the estimation of intracellular fluxes as it provides a more comprehensive description of network topology that, unlike metabolite balancing, does not rely on redox and ATP balances. This approach is referred to here as isotopomer balancing. Estimation of intracellular fluxes through isotopomer balancing involves a global optimization process that was implemented using the previously reported computer program NMR2Flux (32). NMR2Flux is a generic program that utilizes metabolic network information (reaction stoichiometries and carbon skeleton rearrangements), isotopomer abundances, and extracellular flux/biomass composition data as inputs. NMR2Flux estimates metabolic fluxes by minimizing the differences between simulated and experimental isotopomer intensities using the χ2 function. The isotopomer abundances and measured fluxes, obtained as described above, and the metabolic network model shown in supplemental Table 1b were all used in the estimation of fluxes with NMR2Flux. The measured fluxes (± S.D.) were used to constrain the flux solution space. A more detailed description of the estimation of metabolic fluxes based on the use of a 13C-labeled carbon source followed by NMR analysis and isotopomer balancing is presented in the supplemental text and illustrated in supplemental Fig. 1. The validity of the assumption of metabolic and isotopic steady state is also discussed in the supplemental text and supplemental Fig. 2.
RESULTS
Kinetics of Glucose Fermentation in Wild-type MG1655 and a PDHC-deficient Strain and Analysis via Metabolite Balancing
We found that a PDHC-deficient strain (Pdh) grew and metabolized glucose slower than its wild-type MG1655 (Fig. 2). Mutant Pdh exhibited a longer transition time to the exponential phase as follows: 4.7 h compared with 2 h in MG1655 (Fig. 2A, inset). The average maximum specific growth rates (μmax) for three independent fermentations with these strains were 0.465 ± 0.008 and 0.414 ± 0.007 h−1, for MG1655 and Pdh, respectively. A Student's t test was performed to compare the two μmax values, and a p value of 10−5 was obtained, indicating the statistical significance of the differences. The in vitro activity of PDHC was 0.52 ± 0.06 μmol/min/mg of cell protein in MG1655, compared with undetectable levels in strain Pdh. Similar findings were made when another wild-type E. coli, K12 strain W3110, and its PDHC-deficient derivative were evaluated (data not shown). These results indicate not only that PDHC is active during fermentative metabolism of glucose but also that this enzyme performs a beneficial function. Fig. 2 also shows the changes in concentration of glucose (A) and fermentation products (B) for both strains, all exhibiting slower kinetics in mutant Pdh. These findings were rather unexpected given previous reports of a very minor contribution of PDHC to pyruvate dissimilation during fermentative metabolism of glucose in E. coli (1, 5–8).
FIGURE 2.

Kinetics of cell growth, glucose fermentation, and product synthesis by wild-type MG1655 (solid lines and filled symbols) and PDHC-deficient strain Pdh (dashed lines and open symbols) at pH 7.4. A, cell growth (triangles) and glucose utilization (circles). The inset shows log linear plots for the absorbance in each strain during the exponential growth phase. B, synthesis of fermentation products acetate (squares), ethanol (diamonds), formate (circles), and succinate (triangles). The amounts of lactate synthesized were negligible when compared with other products (around 0.2 mm at the end of the fermentation) and therefore are not shown.
In addition to PFL and PDHC, the enzyme pyruvate oxidase is also involved in the metabolism of pyruvate by catalyzing its oxidative decarboxylation to acetate and carbon dioxide. Pyruvate oxidase delivers the electrons resulting from the oxidation of pyruvate directly to the respiratory chain and has been shown to contribute to the aerobic growth efficiency of E. coli (33). Despite its role in aerobic metabolism, we found that a pyruvate oxidase-deficient strain grew and fermented glucose in a wild-type manner (data not shown). Therefore, it appears that pyruvate oxidase does not play an important role in pyruvate dissimilation during the fermentative metabolism of glucose under the conditions examined in this study.
A more clear distinction of the effect of the PDHC deficiency could be established by investigating the above strains during the exponential phase of growth; here, the observed differences between MG1655 and mutant Pdh would not be due to metabolic and regulatory changes induced by the accumulation of extracellular products and/or substrate limitations in the later stages of the culture. To this end, the above measurements of growth and formation of extracellular products, in combination with a stoichiometric model of metabolism (see supplemental Table 1a), were used to calculate intracellular fluxes during exponential growth and gain a better understanding of the global response to the PDHC deficiency. This approach, known as metabolite balancing (4, 30, 31), is a very useful, noninvasive, and cost-effective tool that has been widely used to study microbial metabolism (4, 34, 35). Selected intracellular fluxes calculated for MG1655 and Pdh cultures are shown in Table 1; the complete set of fluxes is provided in supplemental Table 1a. The fluxes toward lactic and succinic acids were negligible in both the wild type and Pdh mutant, whereas the fluxes toward ethanol and acetate were very similar in both strains. However, the ethanol-to-acetate ratio was higher in the wild type (Table 1), which could be caused by a higher NADH generation in this strain due to pyruvate dissimilation via PDHC.
TABLE 1.
Comparison of selected intracellular fluxes (value ± S.D.) for wild-type E. coli MG1655 and a mutant deficient in the pyruvate dehydrogenase complex (Pdh) as calculated using two different metabolic flux analysis (MFA) techniques (i.e. metabolite or isotopomer balancing)
Estimated fluxes represent the molar percentages of the average specific glucose uptake rates, which were 5.2 ± 0.4mmol/gCDW/h (MG1655) and 4.6 ± 0.4 mmol/gCDW/h (Pdh). The transhydrogenase flux in isotopomer balancing was calculated based on estimated fluxes for reactions consuming and generating NAD(P)H and assuming redox balanced conditions. Isotopomer balancing does not differentiate between ethanol and acetate because there are no measurable carbon backbone rearrangements between the two metabolites. Hence, the reported flux is a sum of the flux generating these metabolites. See Fig. 1 for abbreviations and for details about pathways.

Although the glucose consumption rate was 13% higher in MG1655, the fraction of carbon proceeding through the EMP pathway is very similar in both strains, except for the flux of glucose-6-P to fructose-6-P, which is higher in the wild type (Table 1). There is a sizeable flux through PDHC in MG1655, which represents 12.5% of the total pyruvate dissimilation flux, with PFL contributing the remaining 87.5%. Because PDHC is absent in mutant Pdh, all the pyruvate is dissimilated via PFL. The effects of the PDHC deficiency are mostly minor throughout the network, with the exception of the pentose phosphate pathway (PPP), in which case a significant redistribution of fluxes is observed (Table 1 and supplemental Table 1a). The flux through the oxidative branch of the PPP (ox-PPP) is very low in the wild type. There is also a very small influx of glycolytic intermediates fructose-6-P and glyceraldehyde-3-P toward the PPP via the nonoxidative branch of PPP (non-ox-PPP), apparently to fulfill the requirement of PPP intermediates used in the synthesis of cell mass (Table 1). The low value of the fluxes and the large standard deviations indicate that the fraction of carbon routed through the PPP in MG1655 is very low. The situation is quite different in mutant Pdh, as a relatively large flux through ox-PPP was observed (over five times that observed in the wild type). This high ox-PPP flux is more than the amount needed to fulfill the requirement of precursor metabolites generated in the PPP, and the excess carbon flux is channeled back to the glycolytic intermediates fructose-6-P and glyceraldehyde-3-P, leading to a substantial positive non-ox-PPP flux (Table 1).
Another interesting effect of PDHC inactivation is the decrease in transhydrogenase flux (Table 1). By converting NADH to NADPH, transhydrogenases provide 35–45% of the NADPH required for biosynthetic purposes in E. coli during aerobic metabolism of glucose (36, 37). The ox-PPP and the oxidative branch of the tricarboxylic acid (ox-TCA) cycle are considered to be the other sources of the anabolic reductant NADPH. Given the low activity of the TCA cycle and the large NADH/NAD+ ratio under fermentative conditions, it is then reasonable to expect a large contribution of transhydrogenases to the generation of NADPH. In these experiments, the calculated transhydrogenase flux is high in MG1655, because of low ox-PPP flux as compared with mutant Pdh, where the increased ox-PPP flux leads to a decrease in the transhydrogenase flux (Table 1). Another important difference in flux distribution between the MG1655 and Pdh relates to the CO2 generation flux, which is three times higher in MG1655 (Table 1). It is hypothesized that the observed changes in distribution of metabolic fluxes in response to the PDHC deficiency might reflect the function of this enzyme in wild-type MG1655.
Biosynthetically Directed 13C Labeling of Proteinogenic Amino Acids in MG1655 and Pdh
One of the most significant metabolic responses to the PDHC deficiency discussed above was the increase in the flux through ox-PPP as elucidated via metabolite balancing analysis. However, given the reliance of metabolite balancing on redox balances, the calculated increase in ox-PPP flux could be an artifact resulting from the need to balance reducing equivalents in the system. To resolve this issue, an alternative approach was used that does not rely on redox balances but instead uses 13C-labeled glucose and subsequent quantitative analysis via biosynthetically directed fractional 13C labeling of proteinogenic amino acids (29). For this purpose, strains MG1655 and Pdh were grown on a mixture of labeled and unlabeled glucose (12.5% [U-13C]glucose, 25%[1-13C]glucose, and 62.5% unlabeled glucose), which enhances the elucidation of carbon partitioning at the EMP-PPP node.3 Cell biomass from these cultures was hydrolyzed, and their two-dimensional 13C,1H HSQC spectra were acquired (Fig. 3).
FIGURE 3.

Two-dimensional 13C,1H HSQC spectra of hydrolyzed extracts of wild-type MG1655 (A) and Pdh (B) grown on a mixture of labeled and unlabeled glucose (12. 5% U-13C, 25% 1-13C, and 62.5% unlabeled). Each spot in the spectra depicts a proton-carbon correlation of an amino acid. For better resolution along the carbon dimension, peaks arising from α-carbons were folded. The insets are expanded views of the regions of the spectra corresponding to Tyr-α and Tyr-β for both strains (along with one-dimensional slices), which show that each spot exhibits fine structure with multiple peaks depending on whether the adjacent carbon atoms are also 13C-labeled. The intensities of these peaks are used to determine the isotopomer fractions. Coefficients of variation (i.e. S.D./average × 100) were below 5% in all cases.
The carbon atoms of 16 amino acids were identified by their unique 13C/1H chemical shifts, distinctive coupling patterns, and J-coupling constants (JCC) (32, 38). The cross-peaks in the 13C,1H spectra displayed peak splitting along the 13C dimension, due to 13C–13C scalar coupling, which are more evident in the expanded views shown as insets in Fig. 3. The specific carbons shown in the insets in Fig. 3 correspond to tyrosine-α, which as expected generates nine peaks, and tyrosine-β, which generates three peaks. These multiplets represent specific isotopomers of the detected compounds, and their abundances are directly proportional to the integrals of the respective multiplet peaks. Upon quantification of peak integrals, 46 sets of relative isotopomer abundances were obtained, corresponding to 46 observed carbon atoms of proteinogenic amino acids, as shown in supplemental Table 2.
Probabilistic equations relating the observed multiplet intensities of the 13C fine structures to the relative abundance of the intact carbon fragments are very useful in the quantitative study of intermediary metabolism (29, 39) and were used here to compare strains MG1655 and Pdh. As previously, the parameter fi is used to represent the degree of carbon-carbon connectivity. For a terminal carbon, f2 denotes the fraction having intact bonds with neighboring carbon, and f1 denotes the fraction having a neighboring carbon arising from a different source molecule. For a central carbon, f3 denotes the fraction with both neighbors intact; f2a denotes the fraction with intact neighboring carbon atom showing smaller scalar coupling, f2b denotes the fraction with intact neighbor showing larger scalar coupling, and f1 denotes the fraction having both neighbors originating from different source molecule. The bond connectivity vector fi can be obtained from the following expression: I = Σ K2if2i (29), where I represents the vector of relative isotopomer intensities and Ki represents the vector of relative intensities of multiplet components (see also supplemental Table 3). Given the isotopic mixture of glucose employed in this study, however, previously reported expressions for Ki (29) could not be used. The new expressions developed here are shown in supplemental Table 3 and were used in the calculation of the relative amounts of various fractions of intact carbon fragments (i.e. parameters fi) for strains MG1655 and Pdh.
The fractional enrichment of glycolytic intermediates pyruvate, phosphoenolpyruvate, and 3-phosphoglycerate (Table 2) were analyzed to further investigate our finding of a higher flux through ox-PPP in Pdh (see previous section and Table 1). The labeling pattern of these precursors is influenced significantly by the partition of carbon at the EMP-ox-PPP node. This is because the carbon metabolism via the PPP involves several bond breakages and reformation leading to an eclectic collection of isotopomers, whereas the EMP route does not lead to any carbon backbone rearrangement (Fig. 4). Thus, a higher flux through ox-PPP leads to lower f3 values for central carbon atoms and lower f2 values for terminal carbon atoms in these three metabolites. In this study, the labeling pattern of alanine was used as proxy for that of pyruvate because alanine is directly derived from pyruvate without any carbon-carbon bond rearrangement (Fig. 4). Similarly, the α-Phe/α-Tyr and α-Ser/α-Gly carbon atoms provide the best sources of information regarding the carbon backbone rearrangements in phosphoenolpyruvate and 3-phosphoglycerate (Fig. 4).
TABLE 2.
Fractions of intact and broken carbon backbone fragments for the α-carbon atoms of Ala, Tyr, Phe, Ser, and Gly and the β-carbon atom of Ala in strains MG1655 and Pdh
The fi values were calculated using observed intensities (Ii) and expressions and relationships shown in supplemental Table III. Ii and fi are as defined in supplemental Table 3 and text for terminal and central carbon atoms. For all calculations it was considered that x = 0.125, y = 0.25, and Pn = 0.012.

FIGURE 4.

Carbon backbone rearrangement during the metabolism of glucose through the EMP and pentose phosphate (PP) pathways and its effect on the labeling pattern and fractions of intact versus broken fragments of pyruvate, phosphoenolpyruvate, and 3-phosphoglycerate. For simplicity, only irreversible routes are depicted. A 12.5, 25, and 62.5% mixture of uniformly labeled, C1-labeled, and unlabeled glucose, respectively, was used for this illustration. Labeled and unlabeled carbon atoms are illustrated by filled and open circles, respectively. Carbon atoms connected by − represent intact fragments arising from source glucose molecule and absence of – between two carbon atoms represents a broken bond. The numbers next to a molecule represent the total number of that species formed when 15 molecules of uniformly labeled, 30 molecules of C1-labeled, and 75 molecules of unlabeled glucose were processed through the EMP or pentose phosphate pathways. As in the example shown, there is no direct carbon backbone rearrangement between glyceraldehyde 3-phosphate (T3P), 3-phosphoglycerate (3PG), phosphoenolpyruvate (PEP), and pyruvate (PYR); the numbers will be the same for these four metabolites. The fi values shown in rectangular boxes depict the fraction of intact and broken carbon fragments relative to the central carbon atoms of the aforementioned metabolites (see text for definition of fi). Two sets of fi values are shown, one for the case when these metabolites are generated via the EMP pathway (left box) and the other one when they are generated through the PPP (right box). Also shown in a rounded box is the interconversion of serine, glycine, and one-carbon (1-C) units, which is the major source of glycine and 1-C units for cellular metabolism (41). The reversible conversion of pyruvate to acetyl-CoA via PFL is included in the same box.
The f1 and f2 values for β-Ala provide information regarding the intact C2–C3 fragments in pyruvate (Fig. 4); the higher the f2 value, the higher the fraction of intact fragment. These values for MG1655 and mutant Pdh (Table 2) suggest that the majority of C2–C3 fragments are intact in both strains, indicating low flux through ox-PPP (see Fig. 4). Moreover, the value of f2 is ∼15% higher in the wild type (Table 2), suggesting that the ox-PPP flux is relatively higher in Pdh. The fi values for the α-Ala (Table 2) for both strains indicate that more than 50% of the molecules with labeled central carbon show backbone rearrangement (as the value of f3 is less than 0.5). However, the majority of central carbon atoms are attached to the C3 carbon atoms as indicated by the sum of f2b and f3, which is consistent with the values for β-Ala (Table 2). In contrast, the C1–C2 bonds appear to be broken in pyruvate for both MG1655 and mutant Pdh. The difference in the comparison between MG1655 and PDHC, as elucidated by β-Ala and α-Ala, is probably due to the fact that values for α-Ala represent only those molecules with labeled central carbon atoms and thus have diminished capability to distinguish between small differences. The main significance of the values for α-Ala is in the fact that they indicate a high degree of C1–C2 bond breakage.
Because pyruvate is formed from phosphoenolpyruvate, which in turn is formed from 3-phosphoglycerate, without any carbon backbone rearrangement, the labeling pattern for these metabolites should be the same, and thus the fi values should also be the same. The high f3 value (>90%) for α-Phe and α-Tyr carbon atoms (Table 2) indicates that the complete C3–C2–C1 backbone is conserved in phosphoenolpyruvate for both MG1655 and Pdh, suggesting low ox-PPP flux in both the strains. This is in contrast to the observation of significant C2–C1 bond cleavage in pyruvate (low f2a for α-Ala but high f2 for β-Ala). This indicates that the C2–C1 bond cleavage in pyruvate occurs after it is formed. This can be explained by a high reversible action of PFL (40), which is instrumental in cleavage of the C2–C1 bond in pyruvate (Fig. 4). The fi values for α-Gly and α-Ser show a different scenario for 3-phosphoglycerate. The f2 values are high for α-Gly, which agrees with the observations for phosphoenolpyruvate and pyruvate (Table 2). The f3 value for α-Ser is also comparable with that of α-Phe and α-Tyr in MG1655 (Table 2), indicating a high fraction of C3–C2–C1 backbone in this strain. In contrast, the f3 value for α-Ser is ∼35% lower for Pdh, which contradicts with the f3 value of α-Phe and α-Tyr (Table 2). The fi values of α-Ser in Pdh suggest a high C1–C2 connectivity and a very low C2–C3 connectivity. This could be explained by a high reversible C1 metabolism in Pdh, as shown in the inset of Fig. 4; C1 metabolism was indeed found to be higher in Pdh (see below). Although it is unclear why this phenomenon would be more pronounced in Pdh than in MG1655, it is noteworthy that the PFL flux is higher in Pdh, and formate (a product of PFL) is involved in C1 metabolism (41). Because the serine biosynthetic pathway and pyruvate kinase are irreversible, the reversible nature of C1 metabolism or PFL should not have any effect on the labeling pattern of phosphoenolpyruvate, making it a reliable source of information regarding carbon metabolism upstream of 3-phosphoglycerate. Thus, the high degree of C3–C2–C1 backbone conservation in phosphoenolpyruvate is strong evidence in support of low ox-PPP flux in both MG1655 and Pdh. Furthermore, the higher f1 for α-Phe and α-Tyr in mutant Pdh indicates that a significant fraction of phosphoenolpyruvate molecules has both the C2–C1 and C2–C3 bonds cleaved, thereby implying a higher degree of carbon backbone rearrangement in Pdh as compared with MG1655, which in turn signifies higher ox-PPP flux in Pdh. These results are consistent with the partition of carbon at the EMP-ox-PPP node obtained via metabolite balancing and discussed in the previous section.
Use of Isotopomer Balancing to Compare the in Vivo Distribution of Metabolic Fluxes in MG1655 and Pdh
Although the analysis conducted in the previous section supports our finding that a PDHC deficiency leads to an increased flux through the PPP, it also underscores the complexity and difficulty of using probabilistic equations to infer the distribution of metabolic fluxes. In this section, an alternative and more comprehensive approach was implemented (termed isotopomer balancing) that involves the estimation of intracellular fluxes from measured isotopomer abundances and extracellular and biomass synthesis fluxes. The metabolic model used for this purpose consists of the pathways included in the stoichiometric model developed for metabolite balancing and that are provided as supplemental Table 1b. Details about the calculation of fluxes using this technique are provided as supplemental text. The 80 fluxes estimated for MG1655 and mutant Pdh using this approach are also available in supplemental Table 1b, and fluxes of key metabolic pathways and reactions are shown in Fig. 5 and Table 1. The supplemental Fig. 3 depicts the correlation between experimental isotopomer abundances and those simulated from the calculated fluxes, demonstrating that the calculated fluxes account for the experimental isotopomer abundances very well. It is noteworthy that the calculation of fluxes using this approach does not rely on cofactor or ATP balancing.
FIGURE 5.

In vivo distribution of metabolic fluxes for wild-type MG1655 (boldface) and mutant Pdh (italics) as calculated via isotopomer balancing. Estimated fluxes represent the molar percentages of the average specific glucose uptake rates, which were 5.2 ± 0.4 mmol/g cell dry weight/h and 4.6 ± 0.4 mmol/gCDW/h for MG1655 and Pdh, respectively. The fluxes were calculated for samples taken during the exponential growth phase. Fluxes shown in larger font size highlight differences between the strains, and arrow widths are proportional to fluxes. Arrowheads indicate the direction of fluxes shown as positive (negative fluxes are in opposite direction to that of arrowheads). See Fig. 1 for details about these pathways and abbreviations.
The results obtained with isotopomer balancing confirm a significant flux through PDHC in MG1655, representing more than 12% of the total pyruvate-dissimilation flux (Fig. 5 and Table 1). The loss of PDHC activity results in an increase in the flux through PFL in mutant Pdh but the overall pyruvate dissimilation flux was still lower, as can be inferred from the lower flux to acetate/ethanol (acetyl-CoA flux to cell mass is similar in both strains). The glycolytic fluxes below fructose-6-P are very similar, although slightly lower in the mutant. The most significant response to the PDHC deficiency was a 5-fold increase in the ox-PPP flux, a large fraction of which is cycled back to the EMP via the non-ox-PPP (Fig. 5 and Table 1). Although the estimated value of this flux is very similar to that obtained via metabolite balancing, it exhibited a much smaller standard deviation (Table 1). In contrast, a small negative flux through the non-ox-PPP is observed in MG1655 indicating that the PPP is functioning close to the minimum level needed to fulfill the requirement of pentose precursors for biomass synthesis. Considering that during glucose fermentation by E. coli the majority of carbon backbone rearrangements occur in the PPP, the higher flux through PPP in mutant Pdh explains the overall higher degree of broken fractions in this strain, as discussed in the previous section and shown in Table 2. A 3.6-fold increase in the reversible C1 metabolism (supplemental Table 1b) also corroborates the inference regarding the fi values of α-Ser in Pdh (see previous section).
A comparison of the fluxes through key metabolic pathways and reactions as obtained via metabolite and isotopomer balancing is shown in Table 1, establishing that the intracellular fluxes obtained via both methods are very similar. However, because isotopomer balancing does not rely on cofactor or ATP balances, and there is a high degree of redundancy in the experimental measurements, the confidence in these estimates is very high. Both these methods of flux analysis revealed that the major metabolic responses to PDHC deletion are increased ox-PPP flux and decreased carbon dioxide evolution flux. These changes are of particular significance because both PDHC and ox-PPP co-generate CO2 and reducing equivalents. Furthermore, a high percentage of the ox-PPP flux is eventually cycled back to the EMP pathway, which is an indication that the increase in the ox-PPP flux may not be related to the generation of more PPP intermediates but to provide either CO2 or reducing power for cell growth. Between these two functions, the generation of CO2 seems to be the more reasonable factor driving the increase in ox-PPP flux in mutant Pdh given the excess of reducing equivalents available under fermentative conditions (i.e. high NADH/NAD+ ratio in this metabolic state) (6). Therefore, it can be postulated that in the absence of PDHC, the cells are experiencing a CO2 limitation, and hence the flux through the ox-PPP is increased to fulfill this requirement. As discussed above, this inference is further supported by the calculated CO2 generation fluxes using either metabolite or isotopomer balancing, which are very low in mutant Pdh when compared with the wild-type values (Table 1 and Fig. 5). The lower specific growth rate of mutant Pdh (Fig. 2), where the majority of CO2 is provided by the ox-PPP, appears to indicate that wild-type E. coli prefers PDHC as the pathway that generates CO2.
Experimental Evidence Supporting the Proposed Role of the Pyruvate Dehydrogenase Complex
The metabolic analysis of strains MG1655 and Pdh described in previous sections led to the hypothesis that the role of PDHC during glucose fermentation is to endogenously generate CO2 for cell growth. This hypothesis is based on the observation that E. coli responds to a PDHC deficiency by a 5-fold increase in the flux through the ox-PPP, a pathway that like PDHC generates CO2. It then follows that a strain deficient in both PDHC and ox-PPP should exhibit more pronounced growth defects than those observed in the PDHC-deficient strain. Moreover, an ox-PPP deficiency alone could also affect cell growth, although to a lesser extent than the combined deficiency of PDHC and ox-PPP. We introduced an ox-PPP deficiency in both MG1655 and mutant Pdh by blocking the committed step in the ox-PPP (deletion of zwf, which encodes glucose-6-P dehydrogenase) (Fig. 1). Mutant Zwf (Zwf = glucose-6-P dehydrogenase-deficient) exhibited a growth phenotype similar to that of Pdh, and the double mutant Pdh-Zwf grew much slower than either Pdh or Zwf (Fig. 6A).
FIGURE 6.

Experimental evidence supporting the proposed role of PDHC as a source of CO2 during glucose fermentation. A, growth profiles for strains MG1655 (circles), Pdh (triangles), Zwf (squares), and Pdh-Zwf (diamonds) at pH 7.4. Open symbols and dashed lines indicate the addition of 1 g/liter of sodium bicarbonate (no bicarbonate added in cultures represented by closed symbols and solid lines). B, growth profiles for strains MG1655 (circles), Pdh (triangles), Fdh (square), and Pdh-Fdh (diamond) at pH 6.3. The growth of strains MG1655 and Pdh at pH 7.4 is shown as a reference using open symbols and dotted lines.
If the role of PDHC and ox-PPP is indeed the endogenous generation of CO2, it then follows that mutants Pdh, Zwf, and Pdh-Zwf should recover a wild-type growth phenotype upon exogenous supplementation of CO2 or its endogenous generation by pathways other than PDHC or ox-PPP. Because supplementation of the medium with bicarbonate has been established as an efficient source of CO2 for cell growth (42, 43), experiments in which strains MG1655, Pdh, Zwf, and Pdh-Zwf were grown in the presence of 1 g/liter sodium bicarbonate were conducted. The differences previously observed between these strains completely disappeared, their growth phenotype becoming indistinguishable under such conditions of plentiful availability of CO2 (Fig. 6A). These results demonstrate that the negative impact of the PDHC and ox-PPP deficiency on cell growth is primarily related to the decreased availability of CO2 in the absence of these pathways.
An alternative strategy to enhance CO2 availability is its endogenous generation, which under fermentative conditions can be achieved by the disproportionation of formate to CO2 and hydrogen, a reaction catalyzed by the enzyme FHL (44). Formate is generated in large amounts as a product of pyruvate dissimilation via PFL and thus can act as an abundant source of CO2. However, the experiments described until now were all conducted at pH 7.4, which results in negligible activity of FHL (45, 46). FHL can be activated by decreasing the cultivation pH, thus providing an endogenous source of CO2 and potentially reducing or negating the reliance on both PDHC and ox-PPP as CO2 sources. In effect, once cultivated at pH 6.3, the differences between MG1655 and Pdh vanished (Fig. 6B). Because the goal of this experiment was to increase CO2 availability for cellular utilization, a pH of 6.3 was chosen to ensure sufficient FHL activity, while also favoring equilibrium toward CO2 instead of either bicarbonate or carbonic acid (15, 42). As changes in pH will undoubtedly affect enzymes and pathways other than FHL, inactivation of FHL in both MG1655 and Pdh strains was assessed to seek further evidence of its role in minimizing the differences between MG1655 and Pdh. This was achieved by disrupting the gene fdhF, which codes for the formate dehydrogenase subunit of FHL (44–46). Strains Fdh (formate dehydrogenase-deficient) and Pdh-Fdh exhibited the same differences in growth as observed previously between MG1655 and Pdh (compare Fig. 6, A and B). Therefore, blocking the endogenous generation of CO2 by FHL revealed the negative impact of the PDHC deficiency, now at pH 6.3 as well (Fig. 6B).
DISCUSSION
The metabolic characterization of wild-type E. coli MG1655 and a PDHC-deficient derivative (Pdh) reported here led to identification of the role of PDHC in the fermentative metabolism of glucose. An exhaustive examination of these strains was conducted by using a mixture of 13C-labeled and -unlabeled glucose followed by analysis of protein-bound amino acids via two-dimensional 13C,1H HSQC NMR spectroscopy. Metabolite balancing (31), biosynthetic fractional 13C labeling of proteinogenic amino acids (29), and isotopomer balancing (30) were employed as a means to evaluate the metabolic differences between MG1655 and Pdh. Metabolite balancing and the analysis of intact and broken carbon bonds in key amino acids provided initial evidence of a potential redistribution of fluxes in response to the PDHC deficiency. The intracellular fluxes obtained via both metabolite and isotopomer balancing revealed a significant flux through PDHC in MG1655 and dramatic changes in the flux and operation of the PPP in response to the PDHC deficiency. Specifically, a 5-fold increase in the flux of the oxidative branch of the PPP was observed in strain Pdh compared with MG1655, and most of this carbon was cycled back to the EMP pathway. Because the ox-PPP, as PDHC, generates CO2, the aforementioned findings led to the hypothesis that the role of PDHC during the anaerobic fermentation of glucose is to generate CO2 for cell growth.
E. coli is known to require a supply of CO2 as metabolic substrate during normal growth for the biosynthesis of small molecules (e.g. arginine, pyrimidines, and purines), fatty acids, and precursor metabolites (e.g. oxaloacetate). For example, anaerobic growth without a lag period can be achieved if a suitable concentration of CO2 is provided, and the subsequent exponential growth rate can be controlled by the concentration of this species (42, 43). When not externally provided, CO2 can be endogenously generated through several metabolic pathways that involve decarboxylation reactions such as ox-PPP (6-phosphogluconate dehydrogenase) (4), TCA cycle (2-oxoglutarate dehydrogenase, isocitrate dehydrogenase) (47), fatty acids biosynthesis (β-ketoacyl acyl carrier protein synthase) (48), and enzymatic complexes PDHC and FHL (44). The low activity of the TCA cycle under fermentative conditions limits the contribution of 2-oxoglutarate dehydrogenase and isocitrate dehydrogenase. Fatty acids biosynthesis, on the other hand, generates CO2 (β-ketoacyl acyl carrier protein synthase) but also consumes it (acetyl-CoA carboxylase), making its overall contribution to CO2 generation very low. The ox-PPP (6-phosphogluconate dehydrogenase), PDHC, and FHL then become the three main sources of endogenous CO2 during fermentative metabolism. However, under neutral to alkaline conditions and early phases of growth, FHL provides very little endogenous CO2 (22), as this enzyme is triggered by acidic pH and accumulation of formate (44). It then follows that PDHC and ox-PPP represent the main sources of endogenous CO2 during the early stages of anaerobic cultures conducted at neutral to alkaline pH. Several lines of evidence presented in this study clearly support the role of PDHC and ox-PPP as the primary source of CO2. First, single mutants Pdh and Zwf exhibited less efficient growth than their wild-type MG1655, an effect that was even more pronounced in double mutant Pdh-Zwf (Figs. 2 and 6A). Growth deficiencies in these three strains were completely eliminated by supplementing the growth medium with bicarbonate (Fig. 6A), a well known source of CO2 (42, 43). Activation of FHL by maintaining an acidic extracellular pH rendered the PDHC deficiency silent (Fig. 6B), which demonstrates that, when active, FHL is an alternative source of CO2. This proposal was further supported by the observation that the negative impact of the PDHC deficiency reappeared at acidic conditions upon elimination of the FHL activity (Fig. 6B).
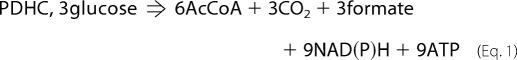
The role proposed here for PDHC in the anaerobic fermentation of glucose is to fulfill the metabolic requirements of CO2. The efficiency of CO2 generation by PDHC can be examined by comparing this pathway to the ox-PPP, the alternative pathway the cells use to generate CO2 under the conditions investigated in this study. Equations 1 and 2 compare the overall stoichiometry of each pathway assuming equal CO2 yields and interconversion of NADH and NADPH via transhydrogenases (see also supplemental Fig. 4).
 |
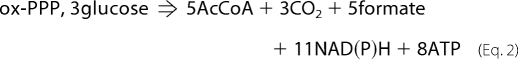 |
As can be seen, for the same amount of CO2 generated upon consumption of the same amount of glucose, PDHC generates more ATP (energy) and AcCoA (carbon) and less formate and reduced cofactors. Cells utilize both energy and carbon to generate the building blocks of biomass, and formate is a toxic metabolite detrimental for cell growth. Also, during fermentative metabolism of glucose, cells operate in a very reduced environment (i.e. high NADH/NAD+ ratio) (6), and further generation of reducing equivalents is clearly undesirable. Thus, overall, PDHC is more energy- and carbon-efficient than ox-PPP and also generates less toxic by-products and reduced cofactors. We speculate that this could be the reason why strain Pdh grows slower even when ox-PPP is present to substitute for this function and why wild-type MG1655 prefers the PDHC pathway to fulfill its metabolic requirements of CO2.
Supplementary Material
Acknowledgments
We thank F. R. Blattner and H. Mori for providing research materials, Y. Dharmadi for assistance with genetic methods, and B. Fulton for assistance with NMR.
This work was supported in part by National Science Foundation Grants BES-0331388/BES-0601549 and EEC-0813570.

The on-line version of this article (available at http://www.jbc.org) contains supplemental text, figures, tables, and references.
M. K. Choudhary, J. Moon, R. Gonzalez, and J. V. Shanks, submitted for publication.
- EMP
- Embden-Meyerhof-Parnas
- FHL
- formate hydrogen-lyase
- AcCoA
- acetyl coenzyme A
- HSQC
- heteronuclear single-quantum coherence
- MFA
- metabolic flux analysis
- non-ox-PPP
- nonoxidative branch of the pentose phosphate pathway
- ox-PPP
- oxidative branch of the pentose phosphate pathway
- PDHC
- pyruvate dehydrogenase complex
- PFL
- pyruvate formate-lyase
- PPP
- pentose phosphate pathway.
REFERENCES
- 1.Sawers R. G., Clark D. P. (2004) in EcoSal–Escherichia coli and Salmonella: Cellular and Molecular Biology (Böck A., Curtiss R., 3rd, Kaper J. B., Karp P. D., Neidhardt F. C., Nyström T., Slauch J. M., Squires C. L., Ussery D. eds) American Society for Microbiology, Washington, D. C [Google Scholar]
- 2.Deutscher J., Francke C., Postma P. W. (2006) Microbiol. Mol. Biol. Rev. 70, 939–1031 [DOI] [PMC free article] [PubMed] [Google Scholar]
- 3.Mayer C., Boos W. (2005) in EcoSal–Escherichia coli and Salmonella: Cellular and Molecular Biology (Böck A., Curtiss R., 3rd, Kaper J. B., Karp P. D., Neidhardt F. C., Nyström T., Slauch J. M., Squires C. L., Ussery D. eds) American Society for Microbiology, Washington, D. C [Google Scholar]
- 4.Romeo T., Snoep J. L. (2005) in EcoSal–Escherichia coli and Salmonella: Cellular and Molecular Biology (Böck A., Curtiss R., 3rd, Kaper J. B., Karp P. D., Neidhardt F. C., Nyström T., Slauch J. M., Squires C. L., Ussery D. eds) American Society for Microbiology, Washington, D. C [Google Scholar]
- 5.Smith M. W., Neidhardt F. C. (1983) J. Bacteriol. 156, 81–88 [DOI] [PMC free article] [PubMed] [Google Scholar]
- 6.de Graef M. R., Alexeeva S., Snoep J. L., Teixeira de Mattos M. J. (1999) J. Bacteriol. 181, 2351–2357 [DOI] [PMC free article] [PubMed] [Google Scholar]
- 7.Snoep J. L., de Graef M. R., Westphal A. H., de Kok A., Teixeira de Mattos M. J., Neijssel O. M. (1993) FEMS Microbiol. Lett. 114, 279–283 [DOI] [PubMed] [Google Scholar]
- 8.Varenne S., Casse F., Chippaux M., Pascal M. C. (1975) Mol. Gen. Genet. 141, 181–184 [DOI] [PubMed] [Google Scholar]
- 9.Kang Y., Durfee T., Glasner J. D., Qiu Y., Frisch D., Winterberg K. M., Blattner F. R. (2004) J. Bacteriol. 186, 4921–4930 [DOI] [PMC free article] [PubMed] [Google Scholar]
- 10.Baba T., Ara T., Hasegawa M., Takai Y., Okumura Y., Baba M., Datsenko K. A., Tomita M., Wanner B. L., Mori H. (2006) Mol. Syst. Biol. 2, 2006.0008 [DOI] [PMC free article] [PubMed] [Google Scholar]
- 11.Shams Yazdani S., Gonzalez R. (2008) Metab. Eng. 10, 340–351 [DOI] [PubMed] [Google Scholar]
- 12.Miller J. H. (1972) Experiments in Molecular Genetics, Cold Spring Harbor Laboratory Press, Cold Spring Harbor, NY [Google Scholar]
- 13.Sambrook J., Fritsch E. F., Maniatis T. (1989) Molecular Cloning: A Laboratory Manual, 2nd Ed., Cold Spring Harbor Laboratory Press, Cold Spring Harbor, NY [Google Scholar]
- 14.Neidhardt F. C., Bloch P. L., Smith D. F. (1974) J. Bacteriol. 119, 736–747 [DOI] [PMC free article] [PubMed] [Google Scholar]
- 15.Dharmadi Y., Murarka A., Gonzalez R. (2006) Biotechnol. Bioeng. 94, 821–829 [DOI] [PubMed] [Google Scholar]
- 16.Dharmadi Y., Gonzalez R. (2005) J. Chromatogr. A. 1070, 89–101 [DOI] [PubMed] [Google Scholar]
- 17.Murarka A., Dharmadi Y., Yazdani S. S., Gonzalez R. (2008) Appl. Environ. Microbiol. 74, 1124–1135 [DOI] [PMC free article] [PubMed] [Google Scholar]
- 18.Snoep J. L., Teixeira de Mattos M. J., Postma P. W., Neijssel O. M. (1990) Arch. Microbiol. 154, 50–55 [DOI] [PubMed] [Google Scholar]
- 19.Danson M. J., Hooper E. A., Perham R. N. (1978) Biochem. J. 175, 193–198 [DOI] [PMC free article] [PubMed] [Google Scholar]
- 20.Gonzalez R., Andrews B. A., Molitor J., Asenjo J. A. (2003) Biotechnol. Bioeng. 82, 152–169 [DOI] [PubMed] [Google Scholar]
- 21.Nielsen J., Villadsen J., Liden G. (2003) Bioreaction Engineering Principles, pp. 47–94, Kluwer Academic Publishers, New York [Google Scholar]
- 22.Merlin C., Masters M., McAteer S., Coulson A. (2003) J. Bacteriol. 185, 6415–6424 [DOI] [PMC free article] [PubMed] [Google Scholar]
- 23.Szyperski T. (1998) Q. Rev. Biophys. 31, 41–106 [DOI] [PubMed] [Google Scholar]
- 24.Szypreski T., Bailey J. E., Wuthrich K. (1996) Trends Biotechnol. 14, 453–458 [Google Scholar]
- 25.Sriram G., Shanks J. V. (2004) Met. Eng. 6, 116–132 [DOI] [PubMed] [Google Scholar]
- 26.Delaglio F., Grzesiek S., Vuister G. W., Zhu G., Pfeifer J., Bax A. (1995) J. Biomol. NMR 6, 277–293 [DOI] [PubMed] [Google Scholar]
- 27.Johnson B. A., Blevins R. A. (1994) J. Biomol. NMR 4, 603–61 [DOI] [PubMed] [Google Scholar]
- 28.Sriram G., Fulton D. B., Shanks J. V. (2007) Phytochemistry 68, 2243–2257 [DOI] [PubMed] [Google Scholar]
- 29.Szyperski T. (1995) Eur. J. Biochem. 232, 433–448 [DOI] [PubMed] [Google Scholar]
- 30.Klapa M. I., Park S. M., Sinskey A. J., Stephanopoulos G. N. (1999) Biotechnol. Bioeng. 62, 375–391 [DOI] [PubMed] [Google Scholar]
- 31.Stephanopoulos G., Aristidou A. A., Nielsen J. (1998) Metabolic Engineering: Principles and Methodology, pp. 309–351, Academic Press, CA [Google Scholar]
- 32.Sriram G., Fulton D. B., Iyer V. V., Peterson J. M., Zhou R., Westgate M. E., Spalding M. H., Shanks J. V. (2004) Plant Physiol. 136, 3043–3057 [DOI] [PMC free article] [PubMed] [Google Scholar]
- 33.Abdel-Hamid A. M., Attwood M. M., Guest J. R. (2001) Microbiology 147, 1483–1498 [DOI] [PubMed] [Google Scholar]
- 34.Downs D. M. (2006) Annu. Rev. Microbiol. 60, 533–559 [DOI] [PubMed] [Google Scholar]
- 35.Nielsen J. (2003) J. Bacteriol. 185, 7031–7035 [DOI] [PMC free article] [PubMed] [Google Scholar]
- 36.Sauer U., Canonaco F., Heri S., Perrenoud A., Fischer E. (2004) J. Biol. Chem. 279, 6613–6619 [DOI] [PubMed] [Google Scholar]
- 37.Fuhrer T., Sauer U. (2009) J. Bacteriol. 191, 2112–2121 [DOI] [PMC free article] [PubMed] [Google Scholar]
- 38.Harris R. K. (1983) Nuclear Magnetic Resonance Spectroscopy: A Physicochemical View, Pitman Books, London [Google Scholar]
- 39.Grivet J. P. (2009) Prog. Nucl. Mag. Res. Sp. 54, 1–53 [Google Scholar]
- 40.Wagner A. F., Frey M., Neugebauer F. A., Schäfer W., Knappe J. (1992) Proc. Natl. Acad. Sci. U.S.A. 89, 996–1000 [DOI] [PMC free article] [PubMed] [Google Scholar]
- 41.Stauffer G. V. (2004) in EcoSal–Escherichia coli and Salmonella: Cellular and Molecular Biology (Böck A., Curtiss R., 3rd, Kaper J. B., Karp P. D., Neidhardt F. C., Nyström T., Slauch J. M., Squires C. L., Ussery D. eds) American Society for Microbiology, Washington, D. C [Google Scholar]
- 42.Lacoursiere A., Thompson B. G., Kole M. N., Ward D., Gerson D. F. (1986) Appl. Microbiol. Biotechnol. 23, 404–406 [Google Scholar]
- 43.Repaske R., Clayton M. A. (1978) J. Bacteriol. 135, 1162–1164 [DOI] [PMC free article] [PubMed] [Google Scholar]
- 44.Sawers R. G., Blokesch M., Bock A. (2004) in EcoSal–Escherichia coli and Salmonella: Cellular and Molecular Biology (Böck A., Curtiss R., 3rd, Kaper J. B., Karp P. D., Neidhardt F. C., Nyström T., Slauch J. M., Squires C. L., Ussery D. eds) American Society for Microbiology, Washington, D. C [Google Scholar]
- 45.Self W. T., Hasona A., Shanmugam K. T. (2004) J. Bacteriol. 186, 580–587 [DOI] [PMC free article] [PubMed] [Google Scholar]
- 46.Bagramyan K., Trchounian A. (2003) Biochemistry 68, 1159–1170 [DOI] [PubMed] [Google Scholar]
- 47.Cronan J. E., LaPorte D. (2006) in EcoSal–Escherichia coli and Salmonella: Cellular and Molecular Biology (Böck A., Curtiss R., 3rd, Kaper J. B., Karp P. D., Neidhardt F. C., Nyström T., Slauch J. M., Squires C. L., Ussery D. eds) American Society for Microbiology, Washington, D. C [Google Scholar]
- 48.Cronan J. E., Rock C. O. (2008) in EcoSal–Escherichia coli and Salmonella: Cellular and Molecular Biology (Böck A., Curtiss R., 3rd, Kaper J. B., Karp P. D., Neidhardt F. C., Nyström T., Slauch J. M., Squires C. L., Ussery D. eds) American Society for Microbiology, Washington, D. C [Google Scholar]
Associated Data
This section collects any data citations, data availability statements, or supplementary materials included in this article.