

Abstract
The microarray technique has become a standard means in simultaneously examining expression of all genes measured in different circumstances. As microarray data are typically characterized by high dimensional features with a small number of samples, feature selection needs to be incorporated to identify a subset of genes that are meaningful for biological interpretation and accountable for the sample variation. In this article, we present a simple, yet effective feature selection framework suitable for two-dimensional microarray data. Our correlation-based, nonparametric approach allows compact representation of class-specific properties with a small number of genes. We evaluated our method using publicly available experimental data and obtained favorable results.
Keywords: gene expression microarray, feature selection, classification, clustering
Background
Recently feature selection has become an essential process to handle the high dimensional nature of biological data such as gene expression microarrays. The main objective of feature selection, in particular for the gene expression data analysis, is to identify a subset of features without deforming the original representation or distorting the interpretability [1]. This allows the subset to retain sufficient information in explaining the underlying biological system behaviour like cellular function and pathways [2]. Therefore, feature selection differs from other conventional dimension reduction techniques such as the projection-based principle component analysis or the information measure-based approaches, which in general do not provide a way to recover the original biological meaning from the reduced features [1]. In summary, the gene expression data are characterized by the following issues:
obviously microarrays are of high dimension, with thousands of genes involved,
measured samples or experiments are very few, typically less than 100, and
among thousands of gene expressions, only a few of them account for the data variation [3]
A lot of data mining and pattern recognition techniques have been applied to capture the meaningful patterns in gene expression microarrays. A straightforward approach is to apply standard statistical methods: using the t-test [4], the Bayesian approach [5], and the Wilcoxon rank sum test [6]. All these methods are the univariate feature selection method which ignores the dependency between features. To take into account the correlation between genes, multivariate models have been developed including exploring bivariate interactions, correlation-based feature selection, the Markov blanket filter method. These filter-based approaches focus only on the general properties of the data itself without considering the associated classifier in evaluating the selected features. The wrapper approach, on the other hand, integrates the feature selection process with the evaluation of the selected features by a classifier.
In the machine learning world, it is well known that classification/clustering performance could be degraded when the selected features include irrelevant and redundant information [7]. Redundancy-removed feature subset allows avoiding overfitting and hence improves the performance of the applied model [1]. Microarray data presumably also include some gene expressions that are not related to the classification task at hand. In the past, feature subset selection has been extensively studied [1,8,9,10]. Two key issues concerning feature subset selection are
how to evaluate selected features and
how to perform search, except determining the starting and stopping conditions.
Feature evaluation methods are further divided into groups based on modeling strategies, namely filter, wrapper, and embedded techniques [1]. Filter techniques compute statistical correlations between gene expressions and sample classes. Selection of genes is computationally simple and fast to implement, easily scalable to high-dimensional data, and independent of classification algorithm. Filter techniques in general, however, evaluate the features one by one to determine their relevance to the classification task. As a result, they can not provide correlative information between two sets of gene expression, which would be valuable in selecting a biologically meaningful subset of genes. Wrapper methods integrate the feature search procedure with the classifier training in such a way that evaluation of feature subset is performed in accordance with classifier testing. This interaction between feature selection and classifier design enables to consider feature dependencies [11]. In the context of finding maximally influencing genes from microarray data, though taking different strategies, all feature subset selection methods are concerned with handling the following issues:
Removal of irrelevancy;
Removal of redundancy;
Maintaining of class-discriminating power.
In this paper we present a simple, yet efficient feature selection framework which is appropriate to extract class-specific properties as a small number of genes from two-dimensional microarray data. Our feature selection method addresses the key issue in feature selection: removal of irrelevance and redundancy without performance degradation. The main contribution of our approach, however, lies in providing a way to identify what features (gene expressions and samples) characterize each class. This is somewhat different from just identifying the sample phenotypes in different classes, in the sense that we consider the genes and samples at the same time in selecting the most influential genes. In other words, the class-specific features retain the original matrix form, and hence it is easy to see which genes are related with which samples in each class. Another advantageous point is that our method can be implemented without great effort.
In spite of its simple process, however, our method allows the interpretable process of gene selection as well as superior performance in classification. Simulation with the widely used benchmark microarray data shows that our method yield compact representation of gene expressions (less than 100 out of thousands) while the results are favourably compared with the published results[3, 12].
Methodology
See supplementary material for methdology.
Discussion
We tested the feature selection method using the publicly available data of three different cancer types: acute leukemia, medulloblastoma, central nervous system tumors [12]. All simulations were carried out using MATLAB® software on a 2.80GHz Petium-4 workstation. To verify the effectiveness of the proposed approach, we compare the experimental results with those obtained by the basic NMF [13] and those by the sparse NMF [5]. We measured the accuracy of the clustering by the formula given in equation 7 (supplementary material). Note that our goal here is not just to apply a black box-type classifier aiming for a good result without reasoning but to find how well samples are grouped into compactly formed clusters, which would be useful for further analysis. The details of the experiments over each data set are as follows.
Leukemia dataset
This data set is widely used as a benchmark in the cancer classification to compare various methods [12]. The classification task with this data set is to discriminate acute lymphoblastic leukemia (ALL) type from acute myelogenous leukemia (AML) type, and, within the ALL type, to classify ALL-T cell subtype from ALL-B subtype. The data set is composed of 5000 genes from 38 bone marrow samples: 19 samples of ALL- B type, 8 samples of ALL-T type, and 11 samples of AML type. Thus, this data set poses two classification problems:
distinction of AML and ALL types and
distinction of all subtypes of AML, ALLB, and ALL-T.
The first problem can be relatively easily addressed by using SOM or hierarchical clustering (HC), though some kind of tuning of parameters (such as number of clusters and number of input genes) is required to get optimal solutions [3, 12]. For the second problem, however, distribution of samples seemingly does not form compact and distinct clusters. Rather, depending on the used metric and inputs (for HC) or the starting condition (for SOM), these methods yield varying and unstable classification results. Brunet et al. [12] reported that basic NMF recovered successfully the cluster structure intrinsic to the data for both problems. Later Gao and Church [3] presented the sparse NMF (SNMF) and reportedly improved the classification accuracy, measured by Equation (7), from 0.947 (2 incorrectly classified out of 38) using basic NMF to 0.974 (1 incorrect out of 38) using SNMF. Our goal here is first to identify most influencing subset of genes from leukemia data in such a way that they retain the class‐specific features while discarding irrelevant gene features, and then to show that performance can be improved or favorable compared to the results above. Recall that the NMF algorithm decomposes the gene expression data, C(N',M), into V H where H has dimension of κ ×M, where κ clusters of samples are formed. Utilizing this property, we can see if each sample is correctly classified into well-defined clusters by examining the maximum value in each column of H. More specifically, if a sample belongs to class w and has the max value at column w, then it is correctly classified, and otherwise not. Using the feature selection method described in Method section, we have selected 64 genes. The class-specific feature selection criteria as described at step 7 of Algorithm in Figure 1 are set to as follows: F1(˙) ≫ 23, F2(˙) ≫ 26, and F3(˙) ≫ 26. The results of 50 runs of the NMF algorithm with κ set to 3 consistently show that all the samples except one have been correctly classified. The incorrectly recognized sample is the 29th sample annotated as “AML 13” in the original data set, which is classified as ALL-B type. This result is similar to that of Gao and Church [3], but somewhat different from the result of Brunet et al. [12] in which two incorrectly recognized samples are the 6-th and the 10-th, both of type ALL-B. Investigating the source from which this discrepancy comes seems to be an interesting, but challenging task for the future work.
Figure 1.
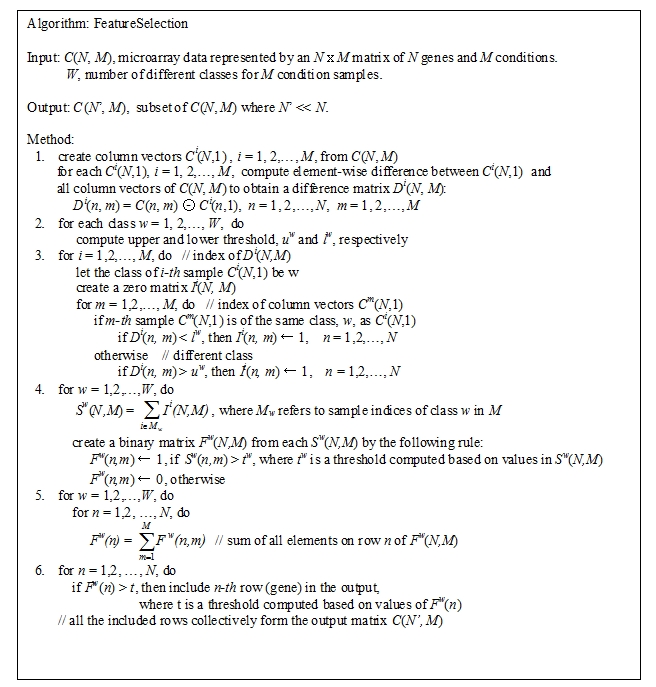
A feature subset selection algorithm that is specifically targeted for 2-D microarray data.
Medulloblastoma dataset
The medulloblastoma data set contains 34 samples related to childhood brain tumors. Although pathogenesis of medulloblastoma is not well understood and its diagnosis is highly subjective, due to some attributes observable under the microscope, medulloblastoma could be divided into two sub-classes, classic and desmoplastic [12, 16]. The samples are composed of 25 classic and 9 desmoplastic medulloblastoma. SOM and HC can not recognize the clustering topology intrinsic to this two-class data. The basic NMF successfully captured the distinctiveness between two classes for κ = 2 to 5, but two desmoplastic and one classic sample are incorrectly classified. When the SNMF was applied to this data set, though it captured the intrinsic clustering structure, classification performance was not satisfactory: only three out of nine desmoplastic samples were correctly classified. Considering that SNMF seeks sparse representation of genes, which is equivalent to the objective of our approach by and large, comparison of our method's performance against that of SNMF would be meaningful. However, comprehensive comparison is difficult because Gao and Church [3] only described the outline of the SNMF algorithm and the implication of sparseness, without providing any information about the degree of data sparseness used (or how compactly the data are reduced). Using the feature selection method, we have selected 74 genes out of 5893 in the data set. In this case, the class-specific feature selection criteria specified at step 7 of Algorithm are set to as follows: F1(˙) ≫ 14 and F2(˙) ≫ 10. These values are a little bit smaller compared to those in the leukemia data case. By varying the value of κ from 2 to 5, we carried out several tests and observed the following results. For κ = 2, the experiment consistently yielded three incorrectly classified sample, all belonging to classic medulloblastoma. For κ = 3, the experiment also yielded three incorrectly classified sample, two from classic and one from desmoplastic medulloblastoma. For κ = 4 and 5, only one classic medulloblastoma, the 6-th sample annotated as “Brain MD 49”, was incorrectly classified. This sample was consistently misclassified across all the experiments. These results, compared with others above, are very suggestive of our method's effectiveness in feature selection.
Central Nervous System Tumors Data
The data set is composed of 34 samples of central nervous system embryonal tumors [16]. The samples come from four different types: 10 classic medulloblastomas, 10 malignant gliomas, 10 rhabdoids, and 4 normals. The basic NMF method well captured four-class clustering structure with two misclassifications: the 18-th sample (“Brain Rhab 10”) of glioma type as a rhabdoids and the 30-th sample (“Brain MGlio 8”) as normal. The SNMF algorithm showed similar results with only one (the 18-th) sample misclassified as a rhabdoid. We have selected 97 genes out of 7129 in the data set. The class-specific feature selection criteria are set to as follows: F1(˙) > 24, F2(˙) > 23, F3(˙) > 22, and F4(˙) > 24. We applied the basic NMF to this set, getting one misclassification for the 18-th sample. We note that the 18-th sample is persistently misclassified as a rhabdoid across all the three methods.
Class-Specific Features
In our feature selection method, the features that are specific to class w is saved in Fw(N,M) as described at step5 of Algorithm in Figure 1. Fw(N,M) is a binary-valued matrix in which values of 1 refers to feature components distinguished for class w. Therefore, for any two different classes w1 and w2, the lesser common entries of value 1 Fw1 (N,M) and Fw2 (N,M) have, the better discrimination between w1 and w2 we expect. Table 2 (supplementary material) shows that the feature matrices obtained from the leukemia data share few common elements of value 1. Fw denotes the number of 1-valued elements in Fw(N,M), and Fi – Fj donotes the number of elements that have 1 for both Fi(N,M) and Fj(N,M), and so on. In Table 1 (supplementary material), one can see that 1-valued elements that are commonly occurred for any two classes are on the average about 10% of the total number of 1-valued elements. This clearly explains why our method is effective in capturing class-specific features. For the case of medulloblastoma data, the features of two classes are more uncorrelated as shown in Table 2 (supplementary material). Only 72 out of over 20,000 elements are marked as common. Table 3 (see supplementary material) shows the statistics for the central nervous system tumors data, where “Avg.” refers to the average value of four Fw(N,M)'s. Three-class common membership statistics show similar behavior (10% on the average) as other data sets above, except for the F2 ─ F3 ─ F4 case where the number of common elements is remarkably small. This explains that the three classes are expectedly well separated from each other.
Conclusion
We present a feature subset selection framework that is effective in selecting a subset of influencing genes from microarray data. The proposed method provides an explicit representation of class-specific features. This scheme will be useful to identify biologically meaningful genes associated with a certain diagnosis. Our approach is distinct from typical dimension reduction methods that do not consider preserving the unit property of individual features in the reduced representation. Typical dimension reduction of microarray data is carried out either by reducing only the number of rows (gene expression levels) or by creating new reduced dimensions without considering the unity of original features, such as employed by PCA. In this work, we approached row-wise dimension reduction by using feature selection technique, while applying the clustering technique for column-wise reduction. One point to note about this work and most other existing works is that the dimension reduction in row-wise and column-wise direction is not coordinated with each other. The next step of our work will be directed to the coordination scheme in which selection of genes is well coordinated with identification of sample phenotypes characterizing each class based on the selected genes.
Supplementary material
Acknowledgments
This research was supported by Basic Science Research Program through the National Research Foundation of Korea (NRF) funded by the Ministry of Education, Science and Technology (NRF No. 2009- 0063257 and NRF No. R01-2007-000-10926-0), and by the Korean Ministry of Education, Science and Technology(The Regional Core Research Program / Chungbuk BIT Research-Oriented University Consortium).
Footnotes
Citation:Pok et al, Bioinformation 4(8): 385-389 (2010)
References
- 1.Saeys Y, Inza I. Bioinformatics. 2007;23:2507. doi: 10.1093/bioinformatics/btm344. [DOI] [PubMed] [Google Scholar]
- 2.Moloshok T, et al. Bioinformatics. 2002;18:566. doi: 10.1093/bioinformatics/18.4.566. [DOI] [PubMed] [Google Scholar]
- 3.Gao Y, Church G. Bioinformatics. 2005;21:3970. doi: 10.1093/bioinformatics/bti653. [DOI] [PubMed] [Google Scholar]
- 4.Tsai C, et al. Nucl Acids Res. 2003;31:e52 . doi: 10.1093/nar/gng052. [DOI] [PMC free article] [PubMed] [Google Scholar]
- 5.Baldi P, Long A. Bioinformatics. 2001;17:509. doi: 10.1093/bioinformatics/17.6.509. [DOI] [PubMed] [Google Scholar]
- 6.Anatoniadis A, et al. Bioinformatics. 2003;19:563. [Google Scholar]
- 7.Kuo W, et al. J Biomed Inform. 2004;37:293. doi: 10.1016/j.jbi.2004.07.002. [DOI] [PubMed] [Google Scholar]
- 8.Hwang D, et al. Bioinformatics. 2002;18:1184. doi: 10.1093/bioinformatics/18.9.1184. [DOI] [PubMed] [Google Scholar]
- 9.Liu J, et al. Bioinformatics. 2008;24:i86. doi: 10.1093/bioinformatics/btn145. [DOI] [PMC free article] [PubMed] [Google Scholar]
- 10.Sima C, Dougherty E. Bioinformatics. 2006;22:2430. doi: 10.1093/bioinformatics/btl407. [DOI] [PubMed] [Google Scholar]
- 11.Inza, et al. Artif Intelli Med. 2004;31:91. doi: 10.1016/j.artmed.2004.01.007. [DOI] [PubMed] [Google Scholar]
- 12.Brunet JP, et al. PNAS. 2004;101:4164. doi: 10.1073/pnas.0308531101. [DOI] [PMC free article] [PubMed] [Google Scholar]
- 13.Devarajan PLOS Comp Biol. 2008;4:1. [Google Scholar]
- 14.Lee D, Seung S. Nature. 1999;401:788. doi: 10.1038/44565. [DOI] [PubMed] [Google Scholar]
- 15.Ge X, Iwata S. Neural Netw. 2002;15:285. doi: 10.1016/s0893-6080(01)00145-9. [DOI] [PubMed] [Google Scholar]
- 16.Pomeroy S, et al. Nature. 2002;415:436. doi: 10.1038/415436a. [DOI] [PubMed] [Google Scholar]
Associated Data
This section collects any data citations, data availability statements, or supplementary materials included in this article.