Abstract
A new classification scheme based on the melting profile of DNA sequences simulated thermal melting profiles. This method was applied in the classification of (a) several species of mammalian β globin and (b) αchain class II MHC genes. Comparison of the thermal melting profile with the molecular phylogenetic trees constructed using the sequences shows that the melting temperature based approach is able to reproduce most of the major features of the sequence based evolutionary tree. Melting profile method takes into account the inherent structure and dynamics of the DNA molecule, does not require sequence alignment prior to tree construction, and provides a means to verify the results experimentally. Therefore our results show that melting profile based classification of DNA sequences could be a useful tool for sequence analysis.
Keywords: DNA, hybridization, melting profiles, classification
Background
The DNA double helix has more information built into its structure, that are both local such as variation in base pairing interactions and stacking interactions, as well as long range such as dynamic superhelical stress [1–3]. These interactions are responsible for the physical chemistry of the sequences and they are reflected in the thermodynamic properties such as the melting temperature. Therefore, sequences that have a high homology are expected to have similar thermodynamic parameters such as the melting temperature (Tm). Melting of a DNA molecule involves the denaturation the doublestranded DNA molecule into two single strands and it is the reverse process of hybridization. The denaturation process can be affected by many means such as an increase in temperature or denaturant concentrations [4]. The melting curve represents the denaturation process as a function of increasing sample temperature. Experimentally, the melting profile can be monitored by optical techniques such as absorption and fluorescence microscopy as the interactions among stacked bases cause a decrease in UV absorption. Melting of doublestranded DNA at elevated temperatures involves breaking the hydrogen bonds of the base pairs and a decrease of base stacking. This results in an increase in UV absorption, a hyperchromicity, which can be measured with a spectrophotometer [4].
Melting curve analysis has been used in many applications such as the detection of single nucleotide polymorphisms (SNPs) [5–7] and has recently been proposed as an approach to DNA sequencing [8]. DNA melting profile analysis has also been used in many clinical research applications [9]; these include genotyping [10–13], mutation scanning [14,15] and simultaneous genotyping and mutation scanning [16–18]. Experiments based on melting profiles have also been used as a rapid, economical means of screening close relatives for transplant compatibility [19]. The melting behavior and melting temperature of oligonucleotides can be predicted by a wide range of thermodynamic models which assumes that the stability of a DNA duplex depends on the identity and orientation of the neighboring base pairs [5–720–25]. The idea of using the thermal stability, in particular the melting temperature to differentiate between DNA sequences was originally suggested in the pioneering work by King and Wilson [26] and later followed by others [26–29]. King and Wilson used the nucleic acid hybridization melting temperature to quantify the resemblance between human and chimpanzee genes [26]. The difference in melting temperature between the reannealed human DNA and humanchimpanzee hybrid DNA is about 1.1° C, and that to the sibling species of Drosophila, congeneric species of mice and congeneric species of Drisophila are 3° C, 5° C and 19° C, respectively. Higher the difference in the Tm, larger the evolutionary distance between the species. As longer DNA sequences tend to have several localized melting events [30,31], the melting profile of the DNA sequence has additional information [9]. In one of the early works, Schmid and Marks [28] demonstrated the use of DNA hybridization as a guide to phylogeny using a model system of heteroduplexes formed between human β globin CDNA and four β like globin genes isolated from a different species (chimpanzee).
In this study, we present a simple method for classifying the nucleotide sequences using simulated melting profiles. We demonstrate the utility of this method in β έglobin and gene clusters of MHC class II αchain proteins across multiple mammalian species. Comparison of the melting profile generated phylogenetics with that of the conventional sequence based approach reproduces many of the major features, but do not show a perfect match. The major advantage of this method is that it provides a way to verify phylogenetics constructed only from the DNA sequence and the molecular evolutionary process experimentally.
Methodology
The first exon of the β globin gene is often used as a standard example in many DNAbased graphing methods [32] is used as the first example. The gene family of β globin varies between 86105 bases and has a significant biological role in oxygen transport. β globin gene across the 11 species is listed in Table 1. The class II MHC αchain sequences were obtained from the original reference of Takahashi and coworkers [33] (see supplementary material for data). The average length of the class II MHC αchain is 612 and a total of 31 different species were used for the analysis. The melting profile was separately calculated for each individual sequence using the MELTSIM program [34, 35]. The melting profiles were calculated from 60°C to 120°C in steps of 0.1°C using the default setting (75mM of NaCl). Classification of the calculated profiles were performed using the Euclidian distance measure, unweighted arithmetic average for clustering with a 10 fold bootstrapping for revalidation. Clustering and validation of the profiles were performed using a combination of codes written in Matlab [36] and R [37,38]. For the same DNAs, sequencebased evolutionary trees were constructed using MEGA [39]. All phylogenetic output files were generated in newick tree format (http://evolution.genetics.washington.edu/phylip/newicktree.html) , and visualized using Treedyn [40].
Results
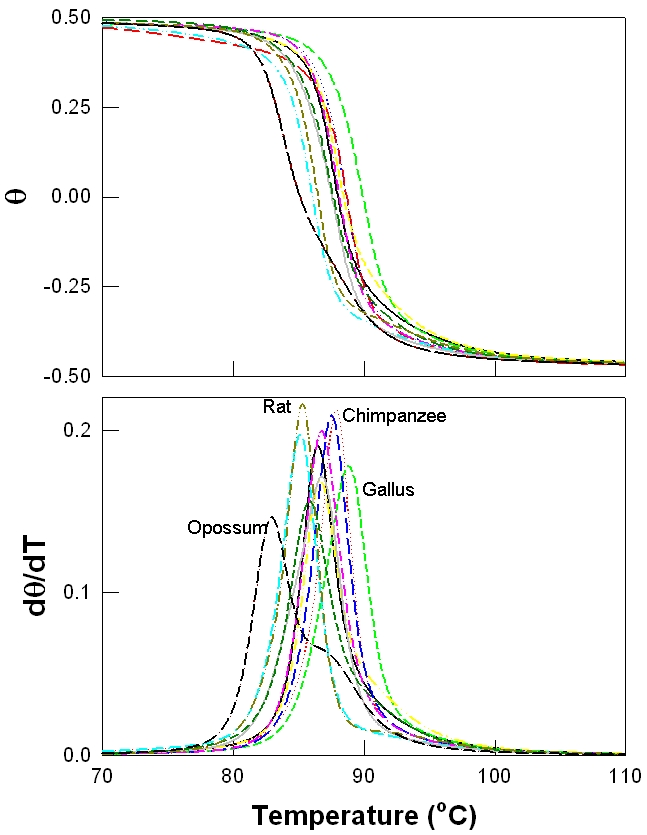
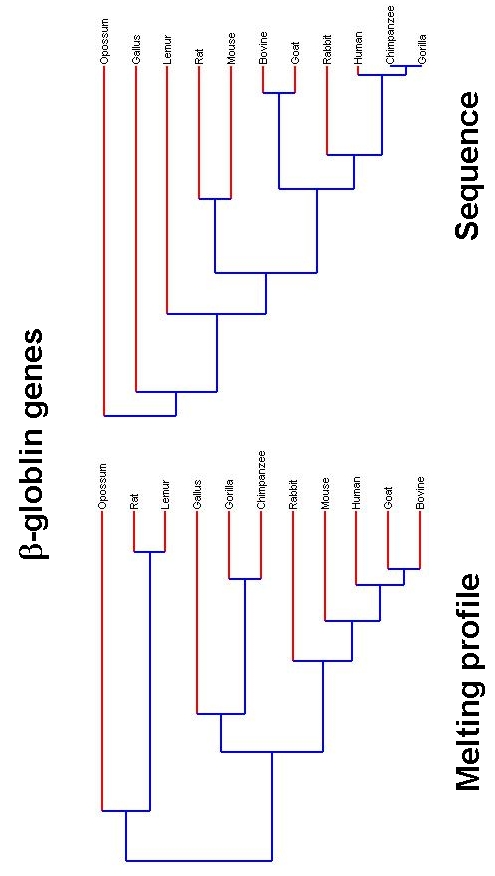
The gene family of β-globin across the 11 species are listed in Table 1 along with the percentage of the various bases, GC content as well the estimated Tm, for each sequence. Figure 1 shows the simulated melting profile using the program MELTSIM of the denaturation process (θ vs. temperature) (in Figure 1a) for all the 11 sequences and its first derivative dθ/dT (in Figure 1b). The population value 0.5 and 0.5 represents the doublehelical and denatured (single strand) DNAs, respectively and the melting temperature (Tm) is defined to be where these populations are equal. The first derivative of the melting profile is more illustrative of the process of denaturation, as the melting temperature is represented as a peak (dθ/dT). Each derivative profile shows peak value that corresponds to the Tm and additional features such the width, shape and other low intensity peaks are manifestations of the sequence composition [41,42]. As βglobin is represented by a relatively small number of bases such distinct features are not pronounced, except for the opossum (highlighted with dark curve in Figure 1). The DNA sequence of opossum has the lowest of the GC content of the sequences and consequently has the lowest Tm [43]. Melting profile based phylogenetics of β globin is shown in Figure 2a, while the similar profile using the sequence is shown in Figure 2b. Most of the tree structures are reproduced in the melting profile based phylogenetics, with few notable differences. In both approaches the sequence of Opossum is clearly differentiated and the relative distances between Rat, Lemur and Gallus are also reproduced. Sequence based approach shows the cluster of Human, Chimpanzee and Gorilla, while the melting profile based approach keeps only the cluster of Chimpanzee and Gorilla together.
Figure 1.

Melting profiles of betaglobin genes: (a) and their respective first derivatives (b). Some of the sequences are labeled in (b) and the melting profile of Opossum is shown in dark lines.
Figure 2.

Evolutionary trees of βglobin genes: Evolutionary trees constructed using the thermal melting profiles (left) and that from the respective gene sequence after sequence alignment.
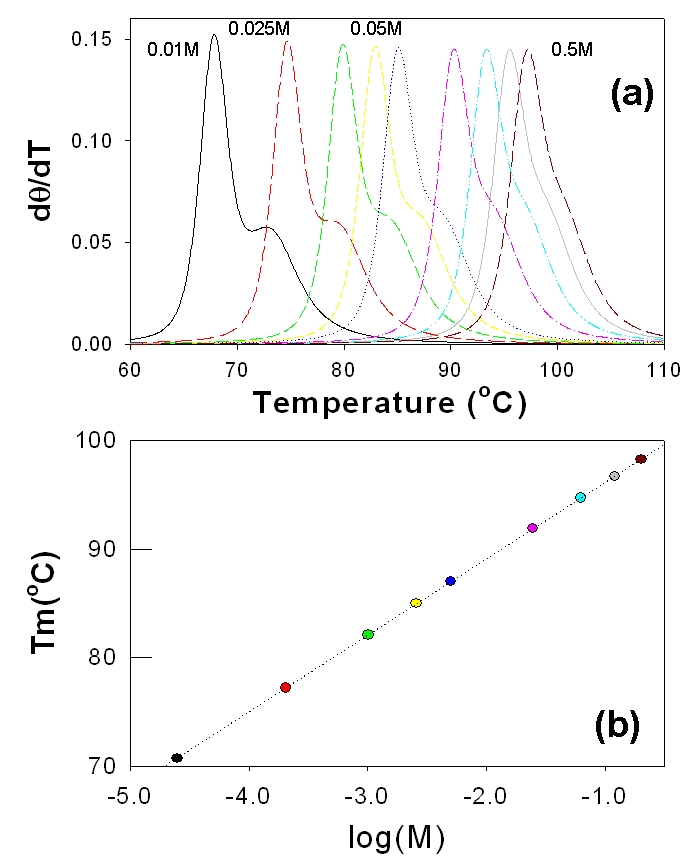
The shape of the melting curve and the melting temperature (Tm) are sensitive to the salt concentration in the sample [44]. All the calculations in Figure 1 are performed with the salt concentration of 75mM. To highlight the effect of salt concentration on the melting profile, the βglobin sequence of opossum that shows additional features in the melting profile is simulated as a function of salt concentration. Figure 3a shows the plot of the profiles and the change in the Tm is shown in Figure 3b. Increase in salt concentration increases Tm (70°C at 0.01M to 98°C at 0.5M) and follows the empirical relationship between Tm vs. log(Concentration) [44]. Increasing the salt concentration also drastically changes the melting profile such as drastic loss of fine features that represent local melting events. Both melting profile and the Tm are important to differentiate the sequences in determining the phylogenetics and therefore optimal concentration of the salt is expected to be critical.
Figure 3.

Temperature effect of Melting profiles: Plots of the melting profiles of the Opossum sequence of the βglobin gene family as a function of salt concentration (a). The plot of the melting temperature (Tm) as a function of the log (concentration) follows a liner relationship (b).
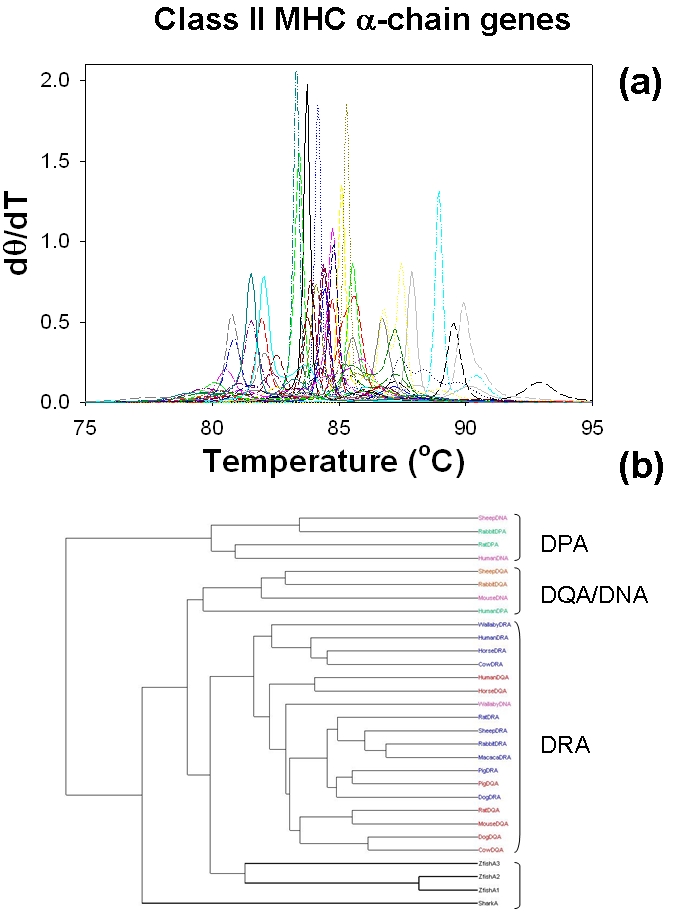
Figure 4 show the melting profiles and molecular phylogenetics, respectively for the genes of class II MHC αchain genes [33]. The origins and divergence times of mammalian class II MHC genes have been studied in detail by Takahashi et al [33] and the data presented here is one of the subgroups of gene clusters studied in the original study ( Table 2 of [33]). The sequence lengths of class II MHC αchain genes are much larger than that of β globin. Total of 31 different sequences and sequence length close to 612 for most sequences (see supporting material for the list genetic sequences) were used. As expected the melting profiles of these genes are complex suggesting the presence of additional features that could be useful to differentiate one sequence from the other. Original sequence based analysis of class II MHC αchain genes showed four sequences (Zebra fish A1, A2 and A3 and shark) belong to an outgroup and the melting temperature analysis (Figure 4) also reproduces the same result. Mammalian class II MHC genes are clustered into four major groups, DRA, DPA, DQA and DNA [33]. Melting temperature based phylogeny is able to reproduce three of the four clusters only with overlaps between the closer clusters DQA and DPA.
Figure 4.

Application to Class II αchains of MHC sequences: (a) Melting profiles of the 31 class II αchains of MHC proteins simulated using MELTSIM. (b) Melting profile derived molecular evolutionary tree of class II alphachains of MHC proteins. DPA, DQA, DNA and DRA refer to the gene clusters originally ([33]).
Discussion
With the advent of new molecular biology techniques including sophisticated cloning, sequencing and monitoring genomes allows the characterization of the single species without need for crosshybridization techniques. For example Liu et al [45] have applied a melting map calculation to the complete human genome. (http://meltmap.uio.no). DNA melting curves analysis is a valuable technique in sequencing, differentiate between coding and noncoding regions [46–48], genotyping [46–48] in the design of oligonucleotide probes in microarray experiments [46–48] and clinical applications [19] Classification of the profiles presented in this paper adds to an additional dimension to the power of melting profile analysis.
Salt concentration is expected to play a significant role on the applicability of DNA melting based differentiation between the sequences (Figure 2). The hypochromicity of DNA, responsible for the denaturing of the double helix is explained in terms of the interaction of the bases when they are stacked in the double helical array as delineated by Watson Crick Model [49–51]. Semiquantitative models developed in the 1960s continue to provide significant insight to the melting profiles of DNAs [44,52]. Another major variable generating the melting profiles of the DNA sequences is the choice of the simulation program. In this work we have used the one of the widely used method, MELTSIM (materials and methods). For short oligonucleotides (1632 bases), Panjkovich and Melo [53] performed an extensive comparison of the various methods. In their study it was noted that large and significant differences in the estimations of Tm were obtained while using different methods and no conclusive recommendations were provided on the choice of simulation methods to determine the melting profiles or its accuracy. Here, we are suggesting an approach to classify DNA sequences has potential implication for sequence analysis; DNA sequences could be classified purely from the experimental melting profiles and sequence information is not mandatory as it depends. This method is expected to find wider applications once the sensitivity of the results is established by experiments.
Supplementary material
Acknowledgments
The authors acknowledge Dr. K.W. P. Miller for critical reading of the manuscript. V.V.K. is supported by an NIH grant: Research Infrastructure for Minority Institutions P20MD002732.
Footnotes
Citation:Reese et al, Bioinformation 4(10): 463-467 (2010)
References
- 1.Benham CJ, Mielke SP. Annu Rev Biomed Eng. 2005;7:21. doi: 10.1146/annurev.bioeng.6.062403.132016. [DOI] [PubMed] [Google Scholar]
- 2.Marko JF, Siggia ED. Science. 1994;265:506. doi: 10.1126/science.8036491. [DOI] [PubMed] [Google Scholar]
- 3.Cozzarelli NR. Science. 1980;207:953. doi: 10.1126/science.6243420. [DOI] [PubMed] [Google Scholar]
- 4.Bloomfield VA, et al. Sausalito, California: University Science Books; 2000. [Google Scholar]
- 5.Bennett CD, et al. Biotechniques. 2003;34:1288. doi: 10.2144/03346pf01. [DOI] [PubMed] [Google Scholar]
- 6.Lyon E. Expert Rev Mol Diagn. 2001;1:92. doi: 10.1586/14737159.1.1.92. [DOI] [PubMed] [Google Scholar]
- 7.von Ahsen NM, et al. Clin Chem. 1999;45:2094. [PubMed] [Google Scholar]
- 8.Chen YJ, Huang X. Anal Biochem. 2009;384:170. doi: 10.1016/j.ab.2008.09.048. [DOI] [PMC free article] [PubMed] [Google Scholar]
- 9.Palais R, Wittwer CT. Methods Enzymol. 2009;454:323. doi: 10.1016/S0076-6879(08)03813-5. [DOI] [PubMed] [Google Scholar]
- 10.Graham R, et al. Clin Chem. 2005;51:1295. doi: 10.1373/clinchem.2005.051516. [DOI] [PubMed] [Google Scholar]
- 11.Liew MR, et al. Clin Chem. 2004;50:1156. doi: 10.1373/clinchem.2004.032136. [DOI] [PubMed] [Google Scholar]
- 12.Palais RA, et al. Anal Biochem. 2005;346:167. doi: 10.1016/j.ab.2005.08.010. [DOI] [PubMed] [Google Scholar]
- 13.Wittwer CT, et al. Clin Chem. 2003;49:853. doi: 10.1373/49.6.853. [DOI] [PubMed] [Google Scholar]
- 14.Gundry CN, et al. Clin Chem. 2003;49:396. doi: 10.1373/49.3.396. [DOI] [PubMed] [Google Scholar]
- 15.Willmore C, et al. Am J Clin Path. 2004;122:206. doi: 10.1309/4E6U-YBY6-2N2F-CA6N. [DOI] [PubMed] [Google Scholar]
- 16.Dobrowolski SF, et al. Hum Mutat. 2005;25:306. doi: 10.1002/humu.20137. [DOI] [PubMed] [Google Scholar]
- 17.Montgomery J, et al. Nat Protoc. 2007;2:59. doi: 10.1038/nprot.2007.10. [DOI] [PubMed] [Google Scholar]
- 18.Zhou L, et al. Clin Chem. 2005;51:1770. doi: 10.1373/clinchem.2005.054924. [DOI] [PubMed] [Google Scholar]
- 19.Zhou L, et al. Tissue Antigens. 2004;64:156. doi: 10.1111/j.1399-0039.2004.00248.x. [DOI] [PubMed] [Google Scholar]
- 20.Borer PN, et al. J Mol Biol. 1974;86:843. doi: 10.1016/0022-2836(74)90357-x. [DOI] [PubMed] [Google Scholar]
- 21.Breslauer KJ, et al. Proc Natl Acad Sci USA. 1986;83:3746. doi: 10.1073/pnas.83.11.3746. [DOI] [PMC free article] [PubMed] [Google Scholar]
- 22.Dimitrov RA, Zuker M. Biophys J. 2004;87:215. doi: 10.1529/biophysj.103.020743. [DOI] [PMC free article] [PubMed] [Google Scholar]
- 23.SantaLucia Jr J. Proc Natl Acad Sci U S A. 1998;95:1460. doi: 10.1073/pnas.95.4.1460. [DOI] [PMC free article] [PubMed] [Google Scholar]
- 24.SantaLuciaJr H, et al. Biochemistry. 1996;35:3555. [Google Scholar]
- 25.SugimotoS N, et al. Nucleic Acids Res. 1996;24:4501. doi: 10.1093/nar/24.22.4501. [DOI] [PMC free article] [PubMed] [Google Scholar]
- 26.King CM, Wilson AC. Science. 1975;188:107. doi: 10.1126/science.1090005. [DOI] [PubMed] [Google Scholar]
- 27.Catzeflis FM, et al. Mol Biol Evol. 1987;4:242. doi: 10.1093/oxfordjournals.molbev.a040444. [DOI] [PubMed] [Google Scholar]
- 28.Schmid CW, Marks J. J Mol Evo. 1990;30:237. doi: 10.1007/BF02099993. [DOI] [PubMed] [Google Scholar]
- 29.Sibley CG, Ahlquist JE. J Mol Evol. 1987;26:99. doi: 10.1007/BF02111285. [DOI] [PubMed] [Google Scholar]
- 30.Tanaka SPH, et al. J Phys Chem B. 2008;112:16788. doi: 10.1021/jp804634s. [DOI] [PubMed] [Google Scholar]
- 31.Gille H, Messer W. EMBO J. 1991;10:1579. doi: 10.1002/j.1460-2075.1991.tb07678.x. [DOI] [PMC free article] [PubMed] [Google Scholar]
- 32.He PA, Wang J. J Chem Inf Comput Sci. 2002;42:1080. doi: 10.1021/ci010131z. [DOI] [PubMed] [Google Scholar]
- 33.Takahashi K, et al. J Hered. 2000;91:198. doi: 10.1093/jhered/91.3.198. [DOI] [PubMed] [Google Scholar]
- 34.Blake RD, et al. Bioinformatics. 1999;15:370. doi: 10.1093/bioinformatics/15.5.370. [DOI] [PubMed] [Google Scholar]
- 35.Volker RD, et al. Biopolymers. 1999;50:303. doi: 10.1002/(SICI)1097-0282(199909)50:3<303::AID-BIP6>3.0.CO;2-U. [DOI] [PubMed] [Google Scholar]
- 36.Matlab. 2005.
- 37.Gentleman RC. J Comp Graphics. 1996;5:299–314. [Google Scholar]
- 38.Gentleman RC, et al. Genome Biol. 2004;5:R80. doi: 10.1186/gb-2004-5-10-r80. [DOI] [PMC free article] [PubMed] [Google Scholar]
- 39.Tamura K, et al. Mol Biol Evol. 2007;24:1596. doi: 10.1093/molbev/msm092. [DOI] [PubMed] [Google Scholar]
- 40.Chevenet F, et al. BMC Bioinformatics. 2006;7:439. doi: 10.1186/1471-2105-7-439. [DOI] [PMC free article] [PubMed] [Google Scholar]
- 41.Chen YZ, Prohofsky EW. Eur Biophys J. 1996;24:203. doi: 10.1007/BF00205101. [DOI] [PubMed] [Google Scholar]
- 42.Gotoh O, et al. Biopolymers. 1976;15:655. doi: 10.1002/bip.1976.360150406. [DOI] [PubMed] [Google Scholar]
- 43.Mandel M. J Marmur. 1968;12:198–206. [Google Scholar]
- 44.Schildkraut C. Biopolymers. 1965;3:195. doi: 10.1002/bip.360030207. [DOI] [PubMed] [Google Scholar]
- 45.Liu F, et al. PLoS Comput Biol. 2007;3:e93. doi: 10.1371/journal.pcbi.0030093. [DOI] [PMC free article] [PubMed] [Google Scholar]
- 46.Koehler R, Peyret TN. Comput Biol Chem. 2005;29:393. doi: 10.1016/j.compbiolchem.2005.09.002. [DOI] [PubMed] [Google Scholar]
- 47.Long DD, et al. Biophys Chem. 2004;110:25. doi: 10.1016/j.bpc.2004.01.001. [DOI] [PubMed] [Google Scholar]
- 48.Payungporn S, et al. J Virol Methods. 2004;120:131. doi: 10.1016/j.jviromet.2004.04.012. [DOI] [PubMed] [Google Scholar]
- 49.Devoe H, Tinoco Jr I. J Mol Biol. 1962;4:500. doi: 10.1016/s0022-2836(62)80105-3. [DOI] [PubMed] [Google Scholar]
- 50.Devoe H, Tinoco Jr I. J Mol Biol. 1962;4:518. doi: 10.1016/s0022-2836(62)80106-5. [DOI] [PubMed] [Google Scholar]
- 51.Tinoco Jr I. J Am Chem Soc. 1960;8:4785. [Google Scholar]
- 52.Kotin L. J Mol Biol. 1963;7:309. doi: 10.1016/s0022-2836(63)80009-1. [DOI] [PubMed] [Google Scholar]
- 53.Panjkovichand A, Melo F. Bioinformatics. 2005;21:711. doi: 10.1093/bioinformatics/bti066. [DOI] [PubMed] [Google Scholar]
Associated Data
This section collects any data citations, data availability statements, or supplementary materials included in this article.


