

Abstract
Thyroid hormone (TH) is crucial for normal brain development. TH transporters control TH homeostasis in brain as evidenced by the complex endocrine and neurological phenotype of patients with mutations in monocarboxylate transporter 8 (MCT8). We investigated the mechanisms of disease by analyzing gene expression profiles in fibroblasts from patients with MCT8 mutations. Studying MCT8 and its transcriptional context in different comprehensive spatial and temporal human brain transcriptome data sets revealed distinct region-specific MCT8 expression. Furthermore, MCT8 demonstrated a clear age-dependent decrease, suggesting its importance in early brain development. Performing comparative transcriptome analysis, we linked the genes differentially expressed (DE) in patient fibroblasts to the human brain transcriptome. DE genes in patient fibroblasts were strongly over-represented among genes highly correlated with MCT8 expression in brain. Furthermore, using the same approach we identified which genes in the classical TH signaling pathway are affected in patients. Finally, we provide evidence that the TRα2 receptor variant is closely connected to MCT8. The present study provides a molecular basis for understanding which pathways are likely affected in the brains of patients with mutations in MCT8. Our data regarding a functional relationship between MCT8 and TRα2 suggest an unanticipated role for TRα2 in the (patho)physiology of TH signaling in the brain. This study demonstrates how genome-wide expression data from patient-derived non-neuronal tissue related to the human brain transcriptome may be successfully employed to improve our understanding of neurological disease.
INTRODUCTION
Thyroid hormone (TH) is an important factor for brain development and function (1). The transcriptional actions of the bioactive hormone T3 are mediated by binding to its nuclear receptors (TRα1 and TRβ, encoded by THRA and THRB, respectively) (1). Cellular action of TH requires transport across the plasma membrane, which is facilitated by plasma membrane transporters (2,3).
Monocarboxylate transporter 8 (MCT8) is the most specific TH transporter known to date. Among different tissues, it is significantly expressed in brain (4). Its biological relevance was demonstrated in humans with psychomotor retardation and disturbed serum TH levels caused by mutations in MCT8 (5,6).
The molecular mechanisms underlying the neurological abnormalities in patients with mutations in MCT8 (for brevity hereafter called MCT8 patients) are unknown, because (i) knowledge of the normal spatial and temporal expression pattern of MCT8 in human brain is largely lacking; (ii) genes downstream of MCT8 have not been identified; (iii) Mct8 knockout (KO) mice replicate the abnormal thyroid state of MCT8 patients, but lack neurological abnormalities and are therefore not a suitable model to unravel the pathogenesis of the psychomotor retardation in MCT8 patients (7,8).
In an attempt to overcome these limitations, we first examined the gene expression profiles of human fibroblasts from MCT8 patients and controls. Next, we assessed MCT8 expression in the brain using several comprehensive human brain transcriptome data sets. Finally, comparative analysis of the transcriptomes of fibroblasts from MCT8 patients and the human brain specified the deranged molecular signature of the disease. Furthermore, the data suggest the role of the TRα2 receptor variant in the (patho)physiology of TH signaling.
The present study illustrates how genome-wide expression data of patient-derived non-neuronal tissue related to the human brain transcriptome may be successfully employed to improve our understanding of neurological diseases.
RESULTS
Transcriptome analysis of fibroblasts from MCT8 patients and controls
To assess differences in gene expression levels per se and in different thyroid states, we performed microarray analysis on fibroblasts from MCT8 patients and controls under three different conditions. We hypothesized that T3 addition would amplify differences between patients and controls, because intracellular T3 availability is decreased in fibroblasts lacking functional MCT8. Unexpectedly, PCA analysis indicated that differences between patients and controls are much larger than differences induced by T3. The genes that differed in expression after T3 treatment between patients and controls are presented in Supplementary Material, Table S1. They include AKR1C1-3 and RCAN2/ZAKI4α which have been previously identified as T3-responsive genes in fibroblasts. Validation of representative genes by qPCR is shown in Fig. 1A.
Figure 1.

Gene expression profiling in fibroblasts from patients with mutations in MCT8 and controls. (A) Verification of microarray results by qPCR. Genes which responded differently to T3 treatment were confirmed by qPCR. Results are shown as mRNA levels expressed relative to that of the house-keeping gene Cyclophilin A (ΔCt ± SEM). The black bars represent controls and the white bars represent patients. Underneath the figure are the gene names and the values obtained by microarray analysis shown as 2log ratio of the fold change in gene expression between patients and controls. #P = 0.07; ##P = 0.08. (B) Gene expression profiles of fibroblasts cultured in different thyroid states (0, 1, 10 nm T3) from patients (P) and controls (C). OmniViz Treescape showing the hierarchical clustering of 1617 unique genes (2159 probe sets) which matched the selection query. Gene expression levels: red, up-regulated genes compared with the geometric mean; green, down-regulated genes compared with the geometric mean. The color intensity correlates with the degree of change. (C) Venn diagram of DE genes between patients (P) and controls (C) per se (red), the effects of 10 versus 0 nm T3 treatment on control fibroblasts (blue; C10 versus C0), the effects of 10 versus 0 nm T3 treatment on patient fibroblasts (green; P10 versus P0) and the overlaps. (D) Verification of microarray results by qPCR. Six down-regulated (left panel) and three up-regulated (right panel) were selected from the microarray results. Results are shown as mRNA levels expressed relative to that of the house-keeping gene Cyclophilin A (ΔCt ± SEM). The black bars represent controls and the white bars represent patients. Underneath the figure are the gene names and the values obtained by microarray analysis shown as 2log ratio of the fold change in gene expression between patients and controls. *P < 0.05; **P < 0.01; ***P < 0.001. (E) GO-enrichment analysis of DE genes in fibroblasts from MCT8 patients versus controls. Enriched GO terms for biological processes were selected from the DAVID functional annotation clustering module and corrected for multiple testing (P < 0.01; see Supplementary Material, Fig. S1 and Table S10 for extensive lists). Enrichment is shown on the upper axis. P-values are represented by the red squares.
As only a limited number of genes responded differently to T3 treatment in patients versus controls, we focussed on the differentially expressed (DE) genes irrespective of thyroid state. Applying stringent selection criteria (see Supporting Information (SI) text for details), we identified 1617 unique DE genes (equaling 2159 probe sets; Supplementary Material, Table S2). Hierarchical clustering of DE genes reveals large differences between patients and controls per se and only subtle effects of T3 during 24 h incubation (Fig. 1B and C). Well-known T3 target genes in the brain such as RELN, BDNF and PTGDS were markedly decreased in MCT8 patient fibroblasts, and Ingenuity Pathway Analysis revealed an over-representation of genes in the TR/RXR pathway (data not shown). Together with our previous observations that TH uptake is impaired in fibroblasts from MCT8 patients (9), the present results suggest that fibroblasts are a suitable tool to study molecular derangements in MCT8 patients.
Validation of DE genes by qPCR
Among the DE genes, 305 unique genes were at least twice represented with different probe sets on the microarray, strengthening the present findings. To validate the microarray results, we confirmed significant changes in the expression of most of the selected genes by qPCR (Fig. 1D).
Gene ontology analysis of DE genes
Gene ontology (GO)-enrichment analysis was used to functionally characterize the DE genes (10). Figure 1E shows the most prominent biological processes identified, including specific GO categories related to cell adhesion and actin cytoskeleton processes.
Spatial and temporal MCT8 expression in human brain
Next, we assembled different microarray data sets generated from in total 381 human brain samples to explore the spatial and age-dependent expression profiles of MCT8. Data set 1 was obtained using 169 tissue samples from 30 individuals and represents gene expression profiles in 53 anatomically distinct human brain regions from at least three subjects [average age: 39.0 (19–90) years]. Data set 2 consisted of 173 samples (hippocampus, entorhinal cortex, superior-frontal gyrus and postcentral gyrus) from 55 individuals (average age 64.4 (20–99) years]. Data set 3 consisted of dorsolateral prefrontal cortex samples from 39 individuals (age range: 0.1–83 years). Full details are given in Patients and Methods and SI text). Figure 2A shows the expression pattern of MCT8 in data set 1, revealing significant MCT8 expression in distinct brain areas. As MCT8 appears crucial for the brain development, we investigated whether MCT8 expression changed with advancing age. Using data set 3, demonstrating distinct age-related gene clustering (Supplementary Material, Fig. S2A), MCT8 is prominently ranked among the subset of genes with a clear age-dependent decrease in expression (Supplementary Material, Fig. S2B). MCT8 expression rapidly declines after the first years of life (Fig. 2B). To assess the functional context of genes among which MCT8 was expressed, we investigated which GO categories were over-represented in genes correlated (r≥ 0.4) with MCT8 in the different data sets. As might be anticipated, consistently enriched GO terms were related to neuron development, axonogenesis and cell adhesion (Supplementary Material, Table S3).
Figure 2.

Spatial and temporal expression of MCT8 in human brain. (A) MCT8 expression in 53 distinct brain regions from at least three different subjects (data set 1). High MCT8 expression is observed in the amygdaloid nucleus, hippocampus, hypothalamus, caudate nucleus, nucleus basalis of Meynert and Brodmann areas 6, 11, 21–24, 28, 42 and 47. (B) Age-related MCT8 expression in 39 samples of the dorsolateral prefrontal cortex from individuals ranging from 0.1 to 83 years of age (data set 3). For hierarchical clustering of all genes in data set 3, see Supplementary Material, Fig. S2. Red, increased expression compared with the geometric mean; green, decreased expression compared with the geometric mean. The color intensity correlates with the degree of change.
Comparative analysis of DE genes in fibroblasts with the human brain transcriptome
Then, we sought to integrate the data obtained in patients' versus control fibroblasts with the normal human brain transcriptome to define molecular pathways and specify candidate genes, which are possibly deranged in the brains of MCT8 patients.
Our strategy entailed the following steps. First, to avoid potential bias, we removed from the analysis genes which were not expressed in at least one of the brain samples. Second, for all remaining genes in the brain data sets, correlations with the expression of MCT8 (or in principle any gene of interest) were calculated. Third, we selected genes that were correlated (r≥ 0.4) with MCT8 expression. Based on the association-by-guilt principle, the resulting list was likely enriched in MCT8-related genes. Fourth, we intersected this list of selected genes in brain with the DE genes of fibroblasts from MCT8 patients. Fifth, the difference between the observed versus expected frequency by chance was calculated for the overlapping genes and a P-value was calculated for the fold enrichment. This approach was performed in all data sets and was extended to the TRs.
Figure 3 illustrates this approach for MCT8 in data set 1. Out of the 44,634 genes called present in the brain samples of this data set, we selected 1172 genes that highly correlated with MCT8 expression in brain (Fig. 3A and B). From the list of 1172 selected genes, 102 were identified among the DE genes in patients' versus control fibroblasts, representing a 2.1-fold enrichment (P = 1.9 × 10⁻¹²; Fig. 3C and D, Supplementary Material, Table S4). In contrast, the same approach with 1172 randomly selected genes did not result in an over-representation.
Figure 3.

Comparative analysis of DE genes in MCT8 patient fibroblasts and the human brain transcriptome. (A) Expression of MCT8 in all 53 brain regions of data set 1 (identical to Fig. 2A). (B) Selection of genes whose expression correlates (r ≥ 0.40) with MCT8 expression across all brain regions (in total 1172 genes) are selected. (C) The 1172 selected genes shown in (B) are intersected with the 2159 DE genes in fibroblasts from MCT8 patients (obtained from Fig. 1A). The intersection results in 102 genes which are common to both selections. (D) Calculation of the representation of 1172 genes among the 2159 DE genes in fibroblasts from MCT8 patients indicates a strong and significant over-representation. The probe set IDs and gene symbols are shown for the 102 genes common to both selections and the degree of correlation with MCT8 in brain (data set 1) is indicated.
Thus, these findings indicate that genes that highly correlate with MCT8 expression in the human brain are more than twice as likely to be found among genes that differ between fibroblasts from MCT8 patients versus controls. This approach was validated using data set 2 (2.4-fold enrichment; P = 4.2 × 10⁻¹⁹; Supplementary Material, Table S4). Similarly, genes following the age-related pattern of MCT8 expression in brain were over-represented among the DE genes (data set 3; 1.5-fold enrichment; P = 1.7 × 10⁻⁴; Supplementary Material, Table S4).
Since MCT8 expression varied highly among the different brain regions (Fig. 2A), background noise might obscure the number of identified genes likely associated with MCT8. Therefore, we selected the brain regions with high versus low MCT8 expression from data set 1 and excluded samples from subjects >60 years of age to diminish age-related effects (data set 4). Theoretically, this data set should considerably increase the number and accuracy of MCT8-associated genes. Indeed, a total of 433 out of the 4152 selected transcripts were present among the DE genes, equaling a 3-fold enrichment (P = 2.9 × 10−67; Supplementary Material, Table S4). Again, categories involved in cell adhesion and actin cytoskeleton regulation were significantly over-represented.
Then, we aimed to identify genes which are consistently correlated with MCT8 among the different data sets and are DE in fibroblasts from MCT8 patients. Since the different data sets represent different brain areas, this approach precluded identification of brain region-specific genes. The search for MCT8-correlated genes in all four data sets resulted in 224 genes, of which 28 were DE in fibroblasts from MCT8 patients (2.7-fold enrichment; P = 6.5 × 10⁻⁷; Table 1). Interestingly, among these genes, two members of the plasticity-related gene family (LPPR2 and LPPR4) are highly expressed in neurons and have been implicated in axonal outgrowth (11).
Table 1.
Genes correlated with MCT8 in normal human brain are overrepresented among DE genes in MCT8 patients' fibroblasts
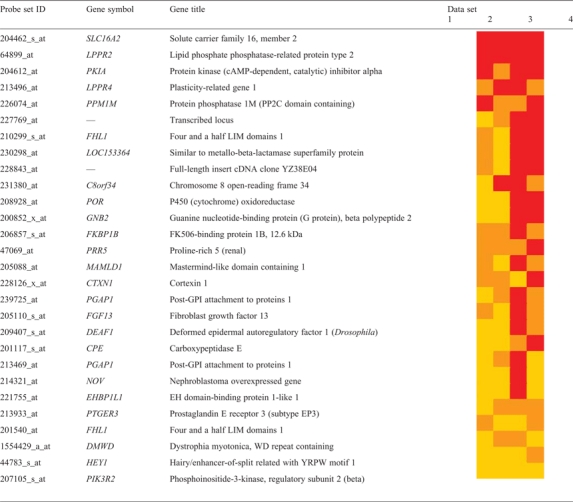 |
Taken together, the approach of selecting genes in the brain which correlate with MCT8 expression and subsequent intersection with DE genes in MCT8 patient fibroblasts resulted in significant over-representations using all different data sets (Table 2).
Table 2.
Genes consistently correlated with MCT8 in normal human brain are over-represented among DE genes in MCT8 patients fibroblasts
| Data set | Number of selected genes in human brain transcriptome data sets | Number of overlapping genes (selected genes: DE genes in MCT8 patients fibroblasts) | Enrichment | P-value |
|---|---|---|---|---|
| 1 | 1172 | 102 | 2.1 | 1.9 × 10⁻¹² |
| 2 | 1207 | 121 | 2.4 | 4.2 × 10⁻¹⁹ |
| 3 | 6418 | 413 | 1.5 | 1.7 × 10⁻⁴ |
| 4 | 4152 | 433 | 2.9 | 2.9 × 10−67 |
| 1 + 2 + 3 + 4 | 224 | 28 | 2.7 | 6.5 × 10⁻⁷ |
Comparative transcriptome analysis links TRα1 and TRβ to MCT8
We tested the current paradigm which assumes that MCT8 transports T3 across the plasma membrane, ultimately to ensure nuclear availability of T3 for the TRs. Thus, we selected genes which expression correlated highly with both MCT8 and one of the TR isoforms. A clear clustering of different probe sets for each isoform was observed in all human brain transcriptome data sets (Supplementary Material, Figs S3 and S4). Specific patterning of THRA1 and THRB was visible in line with the known expression of these genes in the brain, providing further confidence in this approach. For example, a much lower THRB expression was noticed in cerebellum compared with cortical regions (data not shown), which corresponds well with previous studies (12).
Since TRβ appears functional in fibroblasts (13), we started selecting genes that correlated with both MCT8 and THRB expression in the human brain. These lists were intersected with the DE genes in patient fibroblasts resulting in a ∼2-fold enrichment (Table 3, Supplementary Material, Table S5). An exception was data set 3, in which no genes passed the selection criteria, which is explained by the observation that THRB does not exhibit an age-related expression pattern similar to MCT8 (Fig. S4). Examining those genes likely downstream of MCT8 and TRβ revealed several known T3-responsive genes (e.g. CCND2 and RELN). Furthermore, this approach also suggested many interesting candidates for further investigation such as the LIM homeobox gene LHX2 and THY1 and a hypothetical protein encoded by the locus FLJ90757 (14).
Table 3.
Genes correlated with MCT8 and THRB in normal human brain are over-represented among DE genes in MCT8 patients' fibroblasts
| Data set | Number of selected genes in human brain transcriptome data sets | Number of overlapping genes (selected genes: DE genes in MCT8 patients fibroblasts) | Enrichment | P-value |
|---|---|---|---|---|
| 1 | 713 | 58 | 1.9 | 2.3 × 10⁻⁶ |
| 2 | 147 | 15 | 2.3 | 1.5 × 10⁻³ |
| 3 | 0 | |||
| 4 | 448 | 48 | 2.2 | 5.5 × 10⁻⁷ |
Next, we intersected genes correlated with both MCT8 and THRA1 expression in human brain with the DE genes in patient fibroblasts. As this query resulted in only a few genes in data sets 1–3, enrichment did not reach significance (data not shown). This could be explained if MCT8 and TRα1 co-expression is not brain-wide, but restricted to a few distinct brain areas. Indeed, in data set 4, genes that correlated with MCT8 and THRA1 expression were highly over-represented among the DE genes (3.7-fold enrichment; P = 1.6 × 10⁻¹¹; Supplementary Material, Table S7). In addition, we performed a similar approach using a probe set which specifically detects THRA1 mRNA with an extended 3′-UTR (Supplementary Material, Fig. S3) also resulting in a strong enrichment (11-fold; P = 4.4 × 10⁻²³; Supplementary Material, Table S6).
Taken together, our results specify genes in a functional pathway putatively downstream of MCT8 and each of the T3-binding TRs, which are dysregulated in MCT8 patients.
TRα2 appears functionally linked to MCT8
The THRA1 and THRA2 mRNAs encoding TRα1 and TRα2, respectively, result from differential splicing of the THRA gene (Supplementary Material, Fig. S3). Scrutinizing the different probe sets, we found that two probe sets specifically target the mRNA coding for TRα2 (designated as THRA2; Supplementary Material, Fig. S3). Blasting the sequence of these probes in an independent sequence database verified this finding. In addition, the intensities of the probe sets for THRA2 were 3–10-fold higher (P < 1 × 10−37 in data sets 1–3) than for THRA1, which is in perfect agreement with the previous findings of higher THRA2 than THRA1 expression in the brain (12,15). In contrast to TRα1 and TRβ, T3 does not bind to TRα2, leaving it an ‘orphan receptor’ (16).
The first striking observation was that THRA2 expression closely followed MCT8 expression in human brain, much more so than the other TR isoforms (Supplementary Material, Fig. S4, Table 4). To test the hypothesis that MCT8 and TRα2 are functionally linked, we selected genes correlating with both MCT8 and THRA2 expression in the brain. After intersection of these lists with the DE genes in patients' fibroblasts, strong and consistent enrichments (Table 5, Supplementary Material, Table S7) were found, which is illustrated in Fig. 4. We first separately identified 4152 and 4877 genes which highly correlated with MCT8 and THRA2 expression, respectively. Intersection of these lists with the DE genes in patients' fibroblasts yielded 433 and 552 overlapping genes for MCT8 and THRA2, respectively (Fig. 4A and B). Importantly, the large majority of genes were identical between these two lists (Fig. 4C, Supplementary Material, Table S7). Survey of this list uncovered not only genes important for cerebral function (e.g. NPDC1, PEA-15 and ZNF706) but also numerous genes whose function in the brain is as yet unknown (e.g. JOPS2 and CTXN1). The number of DE genes that overlapped with the genes in brain selected on the MCT8/THRA2 combination was much larger than on all other possible combinations (Fig. 4D).
Table 4.
Correlations between expression of MCT8 and the different TR isoforms expression in human brain
| Data set | Pearson's correlation | P-value |
|---|---|---|
| MCT8-THRA2 (two probe sets) | ||
| 1 | 0.38 | 2.8 × 10⁻⁷ |
| 2 | 0.47 | 1.1 × 10⁻¹⁰ |
| 3 | 0.82 | 1.1 × 10⁻¹¹ |
| 4 | 0.54 | 0.0043 |
| MCT8-THRA1 | ||
| 1 | 0.03 | NS |
| 2 | 0.05 | NS |
| 3 | 0.30 | 5.0 × 10⁻² |
| 4 | 0 | NS |
| MCT8-THRB | ||
| 1 | 0.12 | NS |
| 2 | −0.17 | 2.0 × 10⁻² |
| 3 | −0.29 | NS (6.0 × 10⁻²) |
| 4 | 0.09 | NS |
Table 5.
Genes correlated with MCT8 and THRA2 in normal human brain are over-represented among DE genes in MCT8 patients' fibroblasts
| Data set | Number of selected genes in human brain transcriptome data sets | Number of overlapping genes (selected genes: DE genes in MCT8 patients fibroblasts) | Enrichment | P-value |
|---|---|---|---|---|
| 1 | 155 | 19 | 3.0 | 3.0 × 10⁻⁶ |
| 2 | 170 | 22 | 3.1 | 3.1 × 10⁻⁷ |
| 3 | 3530 | 264 | 1.9 | 9.7 × 10⁻¹⁵ |
| 4 | 2555 | 332 | 3.5 | 1.6 × 10−84 |
Figure 4.

Comparative analysis of DE genes in MCT8 patients; fibroblasts and the human brain transcriptome (data set 4) suggests a role for TRα2. (A) Selection of genes whose expression correlates (r ≥ 0.40) with MCT8 expression in the human brain (data set 4) resulted in 4152 genes. Intersection with the 2159 DE genes in fibroblasts from MCT8 patients yielded 433 overlapping genes. (B) Selection of genes whose expression correlates (r ≥ 0.40) with expression of THRA2, encoding the orphan receptor TRα2, in the human brain (data set 4) resulted in 4877 genes. Intersection with the 2159 DE genes in fibroblasts from MCT8 patients yielded 552 overlapping genes. (C) Intersection of the genes obtained from the analysis in (A) and (B), resulted in 332 identical genes. (D) Venn diagrams representing the overlap of genes correlated with all combinations of MCT8, THRA1, THRA2 and THRB in data set 4 and DE genes in fibroblasts from MCT8 patients.
As these observations point to an unanticipated role of TRa2 in the (patho)physiology of TH signaling, we aimed to substantiate the robustness of our strategy. Therefore, genes whose expression changed only after T3 treatment in control fibroblasts were retrieved (Supplementary Material, Table S1 and Fig. S5). This list of genes was searched for correlation with the TR isoforms in brain. As might be expected, the list of T3-responsive genes was not enriched for genes highly correlated with THRA2 in brain. In contrast, a significant enrichment was noted for genes correlated with THRA1 or THRB in multiple human brain data sets (Supplementary Material, Table S8). Furthermore, a comparative analysis of T3-responsive genes in fibroblasts identified previously (13) yielded a preferential enrichment in the THRB-correlated genes. In addition, several well-known T3-responsive genes identified in the mouse brain (HR, NGRN/RC3, BTEB and BDNF) all markedly correlated with THRA1 or THRB in the human brain. Thus, T3-responsive genes were mapped to the T3-binding TRs in human brain, substantiating the validity of our approach. Finally, we performed similar analyses with MCT8 and nuclear receptors unrelated to TH signaling to substantiate our method. In contrast with the TRs, only a few genes correlated with both MCT8 and either the glucocorticoid receptor or the estrogen receptor, none of which resulted in a significant enrichment among the DE genes. Taken together, these findings strongly suggest that MCT8 and TRa2 are closely linked and may act together in controlling specific gene sets.
DISCUSSION
Understanding the neurological phenotype in MCT8 patients is currently hampered as knowledge of MCT8 expression in the human brain is limited. A few studies reported MCT8 staining in some parts of the brain, but a systematic analysis of MCT8 expression in the human brain has not been performed yet (17–19). In the present study, we explored the MCT8 mRNA expression across multiple human brain regions, using genome-wide expression profiles. The present results indicate that MCT8 is significantly expressed in the limbic system, cortical regions involved in language function and areas important for motor control. Although confirmatory studies are needed before anatomical MCT8 expression may be linked to the disease phenotype, the affected cognitive functions in patients are comprehensive if MCT8 is normally expressed in these regions in unaffected subjects. Species-specific cerebral patterning of MCT8 may partially explain the differences between humans and mice lacking functional MCT8 (8,20). Furthermore, we noted that MCT8 has a strong age-dependent expression pattern in humans, at least in the dorsolateral prefrontal cortex, which provides a basis for the hypothesis that treatment during the first years of life may improve the neurological development of MCT8 patients (21).
In the present study, we analyzed and compared the transcriptome of fibroblasts from MCT8 patients with the transcriptome of normal human brain. Microarray studies have advanced the understanding of numerous processes in normal and diseased brain (22–26). Although conventional microarray analysis has yielded novel insights, important information may be missed. Therefore, integrating data from different sources may truly increase further our understanding (26).
Recently, several studies have improved the understanding of the complexity of human brain by the application of network analysis on gene expression profiles in different brain regions, demonstrating intrinsic organizational transcription patterns (27–30). An intuitive disadvantage of analyzing gene expression in brain is that cell-type-specific gene expression levels are missed. However, Oldham et al. (29) clearly demonstrated the existence of specific modules comprising co-expressed genes, which enabled to distinguish cell-specific gene expression signatures in bulk brain tissue. Correlative analysis of gene expression in the brain more precisely defined specific functional units than based on classical morphological markers (31).
In many neurological disorders, especially rare syndromes, diseased tissue is not available for analysis. Therefore, genetically engineered mice are frequently used as models for disease. However, this approach is often limited by species differences in brain function. Alternatively, peripheral cells obtained from patients with neurological disease have been used to seek for abnormalities, which is limited by the uncertainty to which extent differences reflect abnormalities in the brain (32,33). Obviously, the absence of neurological abnormalities in the Mct8 KO mice precludes their use as models for the human brain phenotype (7,8). We aimed to overcome these difficulties by integrating and comparing the DE genes in patient cells with the human brain transcriptome. To our knowledge, the present study is the first linking a human model of neurological disease (MCT8 patients) with different large human brain transcriptome data sets from as many as 381 samples.
The current working hypothesis assumes that in MCT8 patients transport of T3 across the blood–brain barrier and/or transport of T3 into central neurons is hampered. From this, it is commonly speculated that T3 target genes important for brain development are dysregulated. However, proof of this concept is currently lacking and the molecular mechanisms underlying the neurological phenotype are elusive. By using patient-derived fibroblasts, we now demonstrate that numerous genes are dysregulated in patients. We first focussed on the direct effects of T3 addition to the cultured fibroblasts. Different T3 exposure levels resulted in distinct clustering of responsive genes with modest differences between patients and controls.
The modest response to T3 is partially related to the strict cut-off values used to exclude false-positives. Approximately half of the genes responding to T3 treatment in the present study were reported previously as T3 responsive in fibroblasts or other cells and tissues, supporting the validity of our findings (9,13,34–37). Furthermore, 24 h T3 treatment may be insufficient to induce large changes in T3-responsive genes in fibroblasts (36). It is likely that fibroblasts from MCT8 patients are in a chronic hypothyroid state, which was also suggested by the enrichment of the TR/RXR pathway among DE genes irrespective of the cultured thyroid state. Interestingly, we observed reduced levels of several genes which are known to be T3-responsive in brain. Other classical genes which are regulated by T3 in brain (MBP, NGRN/RC3 and HR) were very low or not expressed in fibroblasts, precluding T3-dependent regulation. Nevertheless, the possibility remains that MCT8 transports an as-yet-unknown ligand the absence of which affects the gene expression in patient fibroblasts.
The comparative analysis with genome-wide expression data in the human brain enabled us to explore the relevance of DE genes in patient fibroblasts for brain. The list of down-regulated genes included genes that cause mental retardation when disrupted, such as the SLC6A8, GAMT, MECP2 and NLGN4X (38). Among the up-regulated genes in MCT8 patients, the Notch-ligand JAG1 and Notch-signaling targets HES1 and HEY1 are of particular interest, because these genes are important transcriptional repressors of neurogenesis (39). Interestingly, many of these genes (e.g. HES1, HEY1, JAG1, GAMT and NLGN4X) are strongly correlated with MCT8 expression in one or more of the studied brain transcriptome data sets. This specifies them as genes likely affected in brains of MCT8 patients.
An over-representation of genes related to cell adhesion and actin skeleton processes was noted among the DE genes. As these processes are intimately linked and act together in synapse formation, dysregulation of these molecules likely affects brain development (40). Furthermore, this approach identified a number of DE genes which are highly correlated with both MCT8 and the classic TRs in brain, providing evidence for the hypothesis that deficiency in MCT8 results in insufficient T3 supply to the TRs and consequent dysregulation of T3-responsive genes. Furthermore, this method suggests the concrete identities of putative T3 target genes (e.g. CTXN1 and DEAF1), which likely underlie the neurological abnormalities as examples for future studies.
The most unexpected observation was the strong link between MCT8 and the TRα2 receptor variant. In contrast to TRα1 and TRβ, it has been established that TRα2 does not bind T3 (15,41). TRα2 is able to inhibit effects mediated by either TRα1 or TRβ, but it is unknown whether this is a biologically relevant mechanism (41,42). There are several indications to believe that TRα2 has physiological relevance beyond this antagonistic mechanism of action. First, TRα2 has a ligand-binding domain. Although it does not bind T3, this does not preclude the binding of other ligands to TRα2 which could thus be regarded as an orphan receptor. Second, brain expression of TRα2 is roughly 10-fold higher than TRα1, whereas this ratio is lower in other tissues (12). The divergent expression pattern between cerebral TRα1 and TRα2 may hint at a specific role for TRα2 in brain.
The present results add several lines of evidence suggesting a direct role of TRα2 in TH signaling in brain. First, the expression patterns of THRA2 and MCT8 were highly similar in the human brain transcriptome. Second, the functional link between MCT8 and TRα2 was suggested by our comparative analysis which demonstrated that much more DE genes in patient fibroblasts were among the selection of genes in the human brain correlated with the combination MCT8/THRA2 than with the combinations MCT8/THRA1 or MCT8/THRB. The scenario in which TRα2 antagonizes TRα1 or TRβ function does not explain the present results. Rather less than more DE genes would be expected to overlap with the selected genes in the brain correlating with the combination MCT8/THRA2.
We like to emphasize that T3-responsive genes among the DE genes in patient fibroblasts clearly overlapped with the selected genes in brain correlating with the combination MCT8/THRA1 or MCT8/THRB, but not with MCT8/THRA2. These data are perfectly in line with the current dogma of T3 binding to the classic TRs and provide further confidence in our analysis method. What could be the functional relationship between MCT8 and TRα2? It may be speculated that MCT8 transports a ligand across the plasma membrane, which subsequently binds to TRα2, thereby controlling gene transcription. Therefore, future studies may address the possible MCT8/THRA2 relationship by extending co-expression and functional studies, for example, using animal models such as the TRα2−/− mice (43). Taken together, our findings indicate a novel role for TRα2 in TH signaling in the brain, independent of the actions mediated by the T3 receptors.
In conclusion, the present study demonstrates for the first time which genes are DE in cells derived from patients with mutations in MCT8. Furthermore, we analyzed the expression of MCT8 and its transcriptional context in several comprehensive data sets of the human brain transcriptome. Comparative analysis of the transcriptome of cells from MCT8 patients with the human brain transcriptome enabled us to identify genes that are putatively dysregulated in the brains of MCT8 patients. Our approach indicated a functional relationship between MCT8 and TRα2. This may have not only implications for the understanding of the disease, but also suggests an important role for the ‘orphan receptor’ TRα2 and its relevance for TH signaling in the brain. Finally, this study exemplifies how genome-wide expression data from patient-derived non-neuronal tissue related to the human brain transcriptome may be successfully employed to improve our understanding of neurological diseases.
PATIENTS AND METHODS
Microarray analysis
Microarray analysis was performed on skin fibroblasts from patients with MCT8 mutations, which have been described previously (9). Complete data sets are available online as GEO entry GSE20538. The microarray data of data set 1 were obtained from Gene Logic Inc. (Gaithersburg, MD, USA). The microarrays used to assemble data sets 2 and 3 were collected from two published studies (44,45). Raw data from these studies are available in GSE11512 (data set 2) and GSE11882 (data set 3). For additional information on microarray processing, see SI text. qPCR was performed with SYBR Green I (Eurogentec, Maastricht, The Netherlands). For details, see the SI text.
Functional annotation
Functional annotation was done using Ingenuity Pathway Analysis (Ingenuity, Mountain View, CA, USA) and the web-based DAVID program (david.abcc.ncifcrf.gov) (10).
Comparative analysis
A Pearson-based correlation metric was used to compare the seed genes (MCT8 and the TRs) with all other probe sets present on the chip. Selected genes were intersected with DE genes in fibroblasts from MCT8 patients versus controls. Likelihood and significance of the overlap were tested using χ2-test (or the Fisher exact test if appropriate).
AUTHOR CONTRIBUTIONS
W.E.V. and T.J.V. designed research; W.E.V., Z.Ő., W.F.J.v.I. performed research; R.S. and F.W.V. contributed new reagents; W.E.V., S.M.A.S., P.J.v.d.S. and T.J.V. analyzed data and W.E.V. and T.J.V. wrote the paper.
SUPPLEMENTARY MATERIAL
FUNDING
This work was supported by grants from the Netherlands Organization for Scientific Research (W.E.V.) and the Netherlands Genomics Initiative (S.M.A.S.). Funding to pay the Open Access Charge was provided by Netherlands Organisation for Scientific Research.
Supplementary Material
ACKNOWLEDGEMENTS
We thank Fernando Rivadeneira (Erasmus MC) for excellent help with statistical analysis.
Conflict of Interest statement. None declared.
REFERENCES
- 1.Oppenheimer J.H., Schwartz H.L. Molecular basis of thyroid hormone-dependent brain development. Endocr. Rev. 1997;18:462–475. doi: 10.1210/edrv.18.4.0309. doi:10.1210/er.18.4.462. [DOI] [PubMed] [Google Scholar]
- 2.Gereben B., Zavacki A.M., Ribich S., Kim B.W., Huang S.A., Simonides W.S., Zeold A., Bianco A.C. Cellular and molecular basis of deiodinase-regulated thyroid hormone signaling. Endocr. Rev. 2008;29:898–938. doi: 10.1210/er.2008-0019. doi:10.1210/er.2008-0019. [DOI] [PMC free article] [PubMed] [Google Scholar]
- 3.Visser W.E., Friesema E.C., Jansen J., Visser T.J. Thyroid hormone transport in and out of cells. Trends Endocrinol. Metab. 2008;19:50–56. doi: 10.1016/j.tem.2007.11.003. doi:10.1016/j.tem.2007.11.003. [DOI] [PubMed] [Google Scholar]
- 4.Friesema E.C., Ganguly S., Abdalla A., Manning Fox J.E., Halestrap A.P., Visser T.J. Identification of monocarboxylate transporter 8 as a specific thyroid hormone transporter. J. Biol. Chem. 2003;278:40128–40135. doi: 10.1074/jbc.M300909200. doi:10.1074/jbc.M300909200. [DOI] [PubMed] [Google Scholar]
- 5.Friesema E.C., Grueters A., Biebermann H., Krude H., von Moers A., Reeser M., Barrett T.G., Mancilla E.E., Svensson J., Kester M.H., et al. Association between mutations in a thyroid hormone transporter and severe X-linked psychomotor retardation. Lancet. 2004;364:1435–1437. doi: 10.1016/S0140-6736(04)17226-7. doi:10.1016/S0140-6736(04)17226-7. [DOI] [PubMed] [Google Scholar]
- 6.Dumitrescu A.M., Liao X.H., Best T.B., Brockmann K., Refetoff S. A novel syndrome combining thyroid and neurological abnormalities is associated with mutations in a monocarboxylate transporter gene. Am. J. Hum. Genet. 2004;74:168–175. doi: 10.1086/380999. doi:10.1086/380999. [DOI] [PMC free article] [PubMed] [Google Scholar]
- 7.Dumitrescu A.M., Liao X.H., Galton V.A., St Germain D.L., Weiss R.E., Refetoff S. High circulating T3 in Mct8 deficient mice is an age related postnatal event dependent on the ontogeny of deiodinases. ENDO 07 (Abstr.); Toronto, Canada. 2007. [Google Scholar]
- 8.Trajkovic M., Visser T.J., Mittag J., Horn S., Lukas J., Darras V.M., Raivich G., Bauer K., Heuer H. Abnormal thyroid hormone metabolism in mice lacking the monocarboxylate transporter 8. J. Clin. Invest. 2007;117:627–635. doi: 10.1172/JCI28253. doi:10.1172/JCI28253. [DOI] [PMC free article] [PubMed] [Google Scholar]
- 9.Visser W.E., Jansen J., Friesema E.C., Kester M.H., Mancilla E., Lundgren J., van der Knaap M.S., Lunsing R.J., Brouwer O.F., Visser T.J. Novel pathogenic mechanism suggested by ex vivo analysis of MCT8 (SLC16A2) mutations. Hum. Mutat. 2009;30:29–38. doi: 10.1002/humu.20808. doi:10.1002/humu.20808. [DOI] [PubMed] [Google Scholar]
- 10.Huang da W., Sherman B.T., Lempicki R.A. Systematic and integrative analysis of large gene lists using DAVID bioinformatics resources. Nat. Protoc. 2009;4:44–57. doi: 10.1038/nprot.2008.211. [DOI] [PubMed] [Google Scholar]
- 11.Brauer A.U., Savaskan N.E., Kuhn H., Prehn S., Ninnemann O., Nitsch R. A new phospholipid phosphatase, PRG-1, is involved in axon growth and regenerative sprouting. Nat. Neurosci. 2003;6:572–578. doi: 10.1038/nn1052. doi:10.1038/nn1052. [DOI] [PubMed] [Google Scholar]
- 12.Strait K.A., Schwartz H.L., Perez-Castillo A., Oppenheimer J.H. Relationship of c-erbA mRNA content to tissue triiodothyronine nuclear binding capacity and function in developing and adult rats. J. Biol. Chem. 1990;265:10514–10521. [PubMed] [Google Scholar]
- 13.Moeller L.C., Dumitrescu A.M., Walker R.L., Meltzer P.S., Refetoff S. Thyroid hormone responsive genes in cultured human fibroblasts. J. Clin. Endocrinol. Metab. 2005;90:936–943. doi: 10.1210/jc.2004-1768. doi:10.1210/jc.2004-1768. [DOI] [PubMed] [Google Scholar]
- 14.Porter F.D., Drago J., Xu Y., Cheema S.S., Wassif C., Huang S.P., Lee E., Grinberg A., Massalas J.S., Bodine D., et al. Lhx2, a LIM homeobox gene, is required for eye, forebrain, and definitive erythrocyte development. Development. 1997;124:2935–2944. doi: 10.1242/dev.124.15.2935. [DOI] [PubMed] [Google Scholar]
- 15.Lazar M.A., Hodin R.A., Darling D.S., Chin W.W. Identification of a rat c-erbA alpha-related protein which binds deoxyribonucleic acid but does not bind thyroid hormone. Mol. Endocrinol. 1988;2:893–901. doi: 10.1210/mend-2-10-893. doi:10.1210/mend-2-10-893. [DOI] [PubMed] [Google Scholar]
- 16.Lazar M.A., Hodin R.A., Chin W.W. Human carboxyl-terminal variant of alpha-type c-erbA inhibits trans-activation by thyroid hormone receptors without binding thyroid hormone. Proc. Natl Acad. Sci. USA. 1989;86:7771–7774. doi: 10.1073/pnas.86.20.7771. doi:10.1073/pnas.86.20.7771. [DOI] [PMC free article] [PubMed] [Google Scholar]
- 17.Alkemade A., Friesema E.C., Unmehopa U.A., Fabriek B.O., Kuiper G.G., Leonard J.L., Wiersinga W.M., Swaab D.F., Visser T.J., Fliers E. Neuroanatomical pathways for thyroid hormone feedback in the human hypothalamus. J. Clin. Endocrinol. Metab. 2005;90:4322–4334. doi: 10.1210/jc.2004-2567. doi:10.1210/jc.2004-2567. [DOI] [PubMed] [Google Scholar]
- 18.Alkemade A., Friesema E.C., Kuiper G.G., Wiersinga W.M., Swaab D.F., Visser T.J., Fliers E. Novel neuroanatomical pathways for thyroid hormone action in the human anterior pituitary. Eur. J. Endocrinol. 2006;154:491–500. doi: 10.1530/eje.1.02111. doi:10.1530/eje.1.02111. [DOI] [PubMed] [Google Scholar]
- 19.Roberts L.M., Woodford K., Zhou M., Black D.S., Haggerty J.E., Tate E.H., Grindstaff K.K., Mengesha W., Raman C., Zerangue N. Expression of the thyroid hormone transporters monocarboxylate transporter-8 (SLC16A2) and organic ion transporter-14 (SLCO1C1) at the blood-brain barrier. Endocrinology. 2008;149:6251–6261. doi: 10.1210/en.2008-0378. doi:10.1210/en.2008-0378. [DOI] [PubMed] [Google Scholar]
- 20.Ceballos A., Belinchon M.M., Sanchez-Mendoza E., Grijota-Martinez C., Dumitrescu A.M., Refetoff S., Morte B., Bernal J. Importance of monocarboxylate transporter 8 for the blood-brain barrier-dependent availability of 3,5,3′-triiodo-l-thyronine. Endocrinology. 2009;150:2491–2496. doi: 10.1210/en.2008-1616. doi:10.1210/en.2008-1616. [DOI] [PMC free article] [PubMed] [Google Scholar]
- 21.Di Cosmo C., Liao X.H., Dumitrescu A.M., Weiss R.E., Refetoff S. A thyroid hormone analog with reduced dependence on the monocarboxylate transporter 8 for tissue transport. Endocrinology. 2009;150:4450–4458. doi: 10.1210/en.2009-0209. doi:10.1210/en.2009-0209. [DOI] [PMC free article] [PubMed] [Google Scholar]
- 22.Ernst C., Sequeira A., Klempan T., Ernst N., Ffrench-Mullen J., Turecki G. Confirmation of region-specific patterns of gene expression in the human brain. Neurogenetics. 2007;8:219–224. doi: 10.1007/s10048-007-0084-2. doi:10.1007/s10048-007-0084-2. [DOI] [PubMed] [Google Scholar]
- 23.Roth R.B., Hevezi P., Lee J., Willhite D., Lechner S.M., Foster A.C., Zlotnik A. Gene expression analyses reveal molecular relationships among 20 regions of the human CNS. Neurogenetics. 2006;7:67–80. doi: 10.1007/s10048-006-0032-6. doi:10.1007/s10048-006-0032-6. [DOI] [PubMed] [Google Scholar]
- 24.Khaitovich P., Muetzel B., She X., Lachmann M., Hellmann I., Dietzsch J., Steigele S., Do H.H., Weiss G., Enard W., et al. Regional patterns of gene expression in human and chimpanzee brains. Genome Res. 2004;14:1462–1473. doi: 10.1101/gr.2538704. doi:10.1101/gr.2538704. [DOI] [PMC free article] [PubMed] [Google Scholar]
- 25.Strand A.D., Aragaki A.K., Baquet Z.C., Hodges A., Cunningham P., Holmans P., Jones K.R., Jones L., Kooperberg C., Olson J.M. Conservation of regional gene expression in mouse and human brain. PLoS Genet. 2007;3:e59. doi: 10.1371/journal.pgen.0030059. doi:10.1371/journal.pgen.0030059. [DOI] [PMC free article] [PubMed] [Google Scholar]
- 26.Geschwind D.H., Konopka G. Neuroscience in the era of functional genomics and systems biology. Nature. 2009;461:908–915. doi: 10.1038/nature08537. doi:10.1038/nature08537. [DOI] [PMC free article] [PubMed] [Google Scholar]
- 27.Johnson M.B., Kawasawa Y.I., Mason C.E., Krsnik Z., Coppola G., Bogdanovic D., Geschwind D.H., Mane S.M., State M.W., Sestan N. Functional and evolutionary insights into human brain development through global transcriptome analysis. Neuron. 2009;62:494–509. doi: 10.1016/j.neuron.2009.03.027. doi:10.1016/j.neuron.2009.03.027. [DOI] [PMC free article] [PubMed] [Google Scholar]
- 28.Oldham M.C., Horvath S., Geschwind D.H. Conservation and evolution of gene coexpression networks in human and chimpanzee brains. Proc. Natl Acad. Sci. USA. 2006;103:17973–17978. doi: 10.1073/pnas.0605938103. doi:10.1073/pnas.0605938103. [DOI] [PMC free article] [PubMed] [Google Scholar]
- 29.Oldham M.C., Konopka G., Iwamoto K., Langfelder P., Kato T., Horvath S., Geschwind D.H. Functional organization of the transcriptome in human brain. Nat. Neurosci. 2008;11:1271–1282. doi: 10.1038/nn.2207. doi:10.1038/nn.2207. [DOI] [PMC free article] [PubMed] [Google Scholar]
- 30.Miller J.A., Oldham M.C., Geschwind D.H. A systems level analysis of transcriptional changes in Alzheimer's disease and normal aging. J. Neurosci. 2008;28:1410–1420. doi: 10.1523/JNEUROSCI.4098-07.2008. doi:10.1523/JNEUROSCI.4098-07.2008. [DOI] [PMC free article] [PubMed] [Google Scholar]
- 31.Lein E.S., Hawrylycz M.J., Ao N., Ayres M., Bensinger A., Bernard A., Boe A.F., Boguski M.S., Brockway K.S., Byrnes E.J., et al. Genome-wide atlas of gene expression in the adult mouse brain. Nature. 2007;445:168–176. doi: 10.1038/nature05453. doi:10.1038/nature05453. [DOI] [PubMed] [Google Scholar]
- 32.Matigian N.A., McCurdy R.D., Feron F., Perry C., Smith H., Filippich C., McLean D., McGrath J., Mackay-Sim A., Mowry B., et al. Fibroblast and lymphoblast gene expression profiles in schizophrenia: are non-neural cells informative? PLoS ONE. 2008;3:e2412. doi: 10.1371/journal.pone.0002412. doi:10.1371/journal.pone.0002412. [DOI] [PMC free article] [PubMed] [Google Scholar]
- 33.Nishimura Y., Martin C.L., Vazquez-Lopez A., Spence S.J., Alvarez-Retuerto A.I., Sigman M., Steindler C., Pellegrini S., Schanen N.C., Warren S.T., et al. Genome-wide expression profiling of lymphoblastoid cell lines distinguishes different forms of autism and reveals shared pathways. Hum. Mol. Genet. 2007;16:1682–1698. doi: 10.1093/hmg/ddm116. doi:10.1093/hmg/ddm116. [DOI] [PubMed] [Google Scholar]
- 34.Visser W.E., Heemstra K.A., Swagemakers S.M., Ozgur Z., Corssmit E.P., Burggraaf J., van Ijcken W.F., van der Spek P.J., Smit J.W., Visser T.J. Physiological thyroid hormone levels regulate numerous skeletal muscle transcripts. J. Clin. Endocrinol. Metab. 2009;94:3487–3496. doi: 10.1210/jc.2009-0782. doi:10.1210/jc.2009-0782. [DOI] [PubMed] [Google Scholar]
- 35.Miller L.D., McPhie P., Suzuki H., Kato Y., Liu E.T., Cheng S.Y. Multi-tissue gene-expression analysis in a mouse model of thyroid hormone resistance. Genome Biol. 2004;5:R31. doi: 10.1186/gb-2004-5-5-r31. doi:10.1186/gb-2004-5-5-r31. [DOI] [PMC free article] [PubMed] [Google Scholar]
- 36.Moeller L.C., Wardrip C., Niekrasz M., Refetoff S., Weiss R.E. Comparison of thyroidectomized calf serum and stripped serum for the study of thyroid hormone action in human skin fibroblasts in vitro. Thyroid. 2009;19:639–644. doi: 10.1089/thy.2008.0293. doi:10.1089/thy.2008.0293. [DOI] [PMC free article] [PubMed] [Google Scholar]
- 37.Liu Y., Fu L., Chen D.G., Deeb S.S. Identification of novel retinal target genes of thyroid hormone in the human WERI cells by expression microarray analysis. Vision Res. 2007;47:2314–2326. doi: 10.1016/j.visres.2007.04.023. doi:10.1016/j.visres.2007.04.023. [DOI] [PMC free article] [PubMed] [Google Scholar]
- 38.Chelly J., Khelfaoui M., Francis F., Cherif B., Bienvenu T. Genetics and pathophysiology of mental retardation. Eur. J. Hum. Genet. 2006;14:701–713. doi: 10.1038/sj.ejhg.5201595. doi:10.1038/sj.ejhg.5201595. [DOI] [PubMed] [Google Scholar]
- 39.Kageyama R., Ohtsuka T., Kobayashi T. Roles of Hes genes in neural development. Dev. Growth Differ. 2008;50(Suppl. 1):S97–S103. doi: 10.1111/j.1440-169X.2008.00993.x. [DOI] [PubMed] [Google Scholar]
- 40.Bamji S.X. Cadherins: actin with the cytoskeleton to form synapses. Neuron. 2005;47:175–178. doi: 10.1016/j.neuron.2005.06.024. doi:10.1016/j.neuron.2005.06.024. [DOI] [PubMed] [Google Scholar]
- 41.Koenig R.J., Lazar M.A., Hodin R.A., Brent G.A., Larsen P.R., Chin W.W., Moore D.D. Inhibition of thyroid hormone action by a non-hormone binding c-erbA protein generated by alternative mRNA splicing. Nature. 1989;337:659–661. doi: 10.1038/337659a0. doi:10.1038/337659a0. [DOI] [PubMed] [Google Scholar]
- 42.Munroe S.H., Lazar M.A. Inhibition of c-erbA mRNA splicing by a naturally occurring antisense RNA. J. Biol. Chem. 1991;266:22083–22086. [PubMed] [Google Scholar]
- 43.Salto C., Kindblom J.M., Johansson C., Wang Z., Gullberg H., Nordstrom K., Mansen A., Ohlsson C., Thoren P., Forrest D., et al. Ablation of TRalpha2 and a concomitant overexpression of alpha1 yields a mixed hypo- and hyperthyroid phenotype in mice. Mol. Endocrinol. 2001;15:2115–2128. doi: 10.1210/mend.15.12.0750. doi:10.1210/me.15.12.2115. [DOI] [PubMed] [Google Scholar]
- 44.Berchtold N.C., Cribbs D.H., Coleman P.D., Rogers J., Head E., Kim R., Beach T., Miller C., Troncoso J., Trojanowski J.Q., et al. Gene expression changes in the course of normal brain aging are sexually dimorphic. Proc. Natl Acad. Sci. USA. 2008;105:15605–15610. doi: 10.1073/pnas.0806883105. doi:10.1073/pnas.0806883105. [DOI] [PMC free article] [PubMed] [Google Scholar]
- 45.Somel M., Franz H., Yan Z., Lorenc A., Guo S., Giger T., Kelso J., Nickel B., Dannemann M., Bahn S., et al. Transcriptional neoteny in the human brain. Proc. Natl Acad. Sci. USA. 2009;106:5743–5748. doi: 10.1073/pnas.0900544106. doi:10.1073/pnas.0900544106. [DOI] [PMC free article] [PubMed] [Google Scholar]
Associated Data
This section collects any data citations, data availability statements, or supplementary materials included in this article.