Abstract
By coupling a single UPLC separation to two different types of mass spectrometer an unbiased comparison of the metabolite profiles produced by each instrument for a set of rat urine samples was obtained. The flow from the UPLC column was split equally and both streams of eluent were simultaneously directed to the inlets of the two mass spectrometers. Mass spectrometry on the eluent was undertaken using a triple quadrupole linear ion trap and a hybrid quadrupole time of flight mass spectrometer using both positive and negative ESI. Data from both mass spectrometers were subjected to multivariate statistical analysis, after applying the same data extraction software, and showed the same general pattern of correlation between the samples using both unsupervised and supervised methods of statistical analysis. Based on orthogonal partial least square discriminant analysis models a number of ions were recognized as “responsible” for the separation of the animal groups. From the peaks detected, and denoted as significant by the statistical analysis a number of ions were found to be unique to one dataset or the other, a result which may have consequences for biomarker discovery and inter-laboratory comparisons. The software package used for data analysis also had an effect on the outcome of the statistical analysis.
Keywords: UPLC-MS, QTOF, QTRAP, metabolomics, metabonomics, urine metabolite profiling, multivariate analysis
1. Introduction
There is an increasing use of mass spectrometry, particularly liquid chromatography mass spectrometry (LC-MS) based, technologies for the production of the “global” metabolic profiles required for metabonomic/metabolomic analysis (e.g. see1–9, reviewed in10–12). This expansion in the application of LC-MS reflects a number of factors, not the least of which is the greater availability of instruments with built in software packages specifically designed for the processing of the complex multivariate datasets that are generated by metabolic profiling studies13. A potential problem however, of this newfound ability to generate metabonomic data, is the difficulty of comparing the results obtained in different laboratories, generated on different mass spectrometers and with different methods of data processing, especially when differences in study design, animal strain (or species), sample acquisition, storage and preparation are overlaid on the analytical methodology employed. So, if a group of markers identified in a study in one laboratory cannot be replicated, on the same or a similar set of samples, it could be argued that this simply results from differences in the instrumentation used rather than in the samples themselves. In addition, method transfer from one laboratory to another may also be problematic if the analytical systems are not identical. In the absence of extensive studies in this area (see however, refs. 14,15) we have therefore undertaken a number of investigations to determine the extent of this potential problem, using a variety of biofluids as test samples. In the present study sample analysis was performed using two different types of mass spectrometer, a triple quadrupole linear ion trap mass spectrometer (QTRAP) and a hybrid quadrupole time of flight mass spectrometer (Q-TOF). The QTRAP offers good dynamic range, good stability, high sensitivity and MS/MS functionalities in a single instrument. TOF analysers are the most widely used mass spectrometer in metabolomics because they offer the highest scan rates, high efficiency resolution and mass accuracy.
The aim of the study was to compare the results obtained by the two MS instruments when applied to the metabolite profiling of urine samples obtained from rats treated with an antituberculosis agent in a hepatotoxicity study. Sample components were separated by gradient reversed-phase ultra performance liquid chromatography (UPLC) with the column eluent split equally to enable simultaneous analysis by two mass spectrometers. Analysis was performed in both positive and negative electrospray ionisation (ESI) modes in separate experiments. Following UPLC-MS the data derived from both mass spectrometers were subjected to multivariate statistical analysis to detect potential differences in the urinary metabolite profiles of the treated versus the control groups. Data was thoroughly examined with the vendor's own bespoke software but also with XCMS open source software in order to investigate whether both instruments detected the same ions/molecules as important markers. The similarity or complementary nature of the useful information captured by the two methodologies was also examined.
2. Experimental
2.1 Reagents and Materials
All solvents used were of HPLC grade and obtained from Fisher Scientific (Loughborough, UK). Water (18.2MΩ) was obtained from a Purelab Ultra system from Elga (Bucks, UK). All reagents were of analytical or higher grade and were obtained from Fisher Scientific or Sigma-Aldrich (Dorset, UK).
2.2 Samples
Urine samples that were previously collected for the investigation of the toxicity of isoniazid in rats were used for the analysis. Dosing was performed at RTI International, Research Triangle Park, NC as described in detail in previous communication16. Male Sprague Dawley rats (obtained from Charles River Inc., Raleigh, NC) were administered once by gavage with 0, 10 or 300 mg/kg of isoniazid in distilled water (6 rats per group). Urine was collected prior to dosing and for the periods 0–6 hr and 6–24 hr following dosing. Samples were collected over dry ice in glass metabolism chambers designed for the separate collection of urine and stored in 1.5 ml aliquots at −70°C. In this application a subset of 5 groups of urine samples (n=6) was used, formed from the 6–24h 10 mg/kg post-dose samples and the corresponding vehicle controls and from the 0–6h and 6–24h 300 mg/kg post-dose samples with the corresponding predose samples.
2.3 Sample Preparation
Urine samples were thawed and then centrifuged at 18,000g for 5 min. The supernatant was diluted with an equal volume of ultra pure water and was vortex mixed. Before analysis the diluted samples were centrifuged at 2,400g for 10 min.
As “quality control” (QC) a mixture of all the study samples was prepared by mixing 10 μL aliquots of each sample17,18. The pooled sample was then diluted with an equal volume of water, vortex mixed and centrifuged again as described above. Following UPLC-MS the data from the QC samples were carefully inspected and the further processing only undertaken when the analysis was seen to be acceptable as described elsewhere17,18.
2.4 UPLC –MS analysis
2.4.1 Ultra Performance Liquid Chromatography
An ACQUITY UPLC™ (Waters, Millford, MA, USA) system, with an Acquity BEH C18 column (2.1 × 100 mm), 1.7 μm particle size (Waters) maintained at 50°C was used. The mobile phase (A: water 0.1% formic acid and B: acetonitrile 0.1% formic acid) was delivered at 400 μl min−1, using a gradient elution program as follows: 0 min 5% B, linear increase first to 20% B (0–5 min), then to 45% B (5–8 min) and finally to 95% B (8–9.8 min), with an isocratic hold at 95% B for 1.2 min. Re-equilibration of the column occurred for 1 min prior to the next injection (10 μL of sample). The effluent from the column was split 50:50 through a PEEK T-connector and the two streams were simultaneously delivered by two red PEEK tubes (i.d. 0.125 mm) of equal length (1.0 m each) to the two different mass spectrometers.
Samples were run in a random order, with an initial set of 5 “QC” samples at the beginning of the each analytical run to ensure system equilibration and 1 QC sample every 10 test samples17,18. During the analysis the samples were kept at the autosampler at 4 °C.
2.4.2 Mass spectrometry
A Hybrid Triple Quadrupole Linear Ion Trap system (QTRAP 4000, AB/Sciex Concord, ON, Canada) was collecting enhanced mass scan data for 12 min over a range of 100 to 800 m/z with a scan rate of 1000 amu/s and a step size of 0.08 amu. ESI was applied by a Turbo VTM inlet source operating at 350 °C and ionspray voltage at ±4.5kV; curtain gas at 20 psi; auxiliary gases at 40 psi; de-clustering potential at ±30 V; entrance potential at ±10 V and the ion trap was operated in the dynamic fill time mode. Mass resolution was 0.4Da at 1000 amu/sec. Data acquisition was carried out by Analyst ® 1.4.1.
In parallel data were collected on a Q–TOF Micro mass spectrometer (Waters, Milford, USA). Operating parameters were: capillary voltage ±3.5 kV; cone voltage ±35 V; source temperature 120°C; desolvation temperature 300°C; cone gas flow-rate 10 l/ h and desolvation gas flow-rate 700 l/ h. The scan time was 0.5 s monitoring m/z values ranging from 100 to 800 (interscan time 0.1 s). Leucine enkephalin at m/z 556.2771 in positive ESI and at m/z 554.2615 amu in negative ESI was used as lock mass for exact mass measurement correction. Mass resolution higher than 5000 in the range 150–900 Da and mass accuracy lower than 5 ppm were achieved. Data acquisition was carried out with MassLynx v 4.0 software.
ESI was applied in positive and negative mode in separate experiments in both mass spectrometers..
2.5 Statistical Analysis
Multivariate statistical methods were used as an exploratory tool to uncover trends in the data and correlations between the samples. In order to compare the data from the two different mass spectrometers under equal parameters for the data extraction process, XCMS Open Source software19 (version 1.15.0, 10.2008 release) was applied to both data sets. Peak tables created were imported to Simca P 12+ (Umetrics, Umea, Sweden) for further advanced multivariate data analysis. Principal Components Analysis (PCA), Hierarchical PCA, Partial Least Squares-Discrimination Analysis (PLS-DA), but also O2 PLS was applied in order to extract further information.
In addition data acquired by Analyst® 1.4.1 software (AB Sciex) on the QTRAP 4000 were imported to MarkerView™ software 1.2.0.1(AB Sciex) and data collected from the QTOF were processed by MarkerLynx™ (Waters) in order to discover possible variation of the extracted information due to differences in software. Pareto scaling was applied in all cases. The applied parameters for all processing software are given in the supporting information.
3. Results
By using a single high resolution separation, with the eluent split equally to enable simultaneous analysis by the two mass spectrometers, many of the potential confounding factors that could arise when analysing a single sample set on different systems were, at least in theory, removed. So differences in chromatographic performance, or sample integrity and processing, were eliminated as both mass spectrometers were presented with identical eluents. Typical UPLC-MS profiles, obtained using positive ESI, for predose and 0–6h 300 mg/kg post-dose urine samples from both the QTRAP and QTOF mass spectrometers are shown in Figure SI 1a and b in the form of base peak ion current chromatograms. As was clear from these data, despite receiving exactly the same column effluent, the two mass spectrometers did not give similar profiles. This is, perhaps, not unexpected given that the two instruments differ in many ways: they are based on different mass analysers, electrospray source configurations, ion path trajectories and detector technologies (e.g. the QTOF is equipped with a multi channel plate whereas the QTRAP utilises an electron multiplier). However, whilst interesting for the qualitative examination of the data, by themselves pictures of the type shown in Figure SI 1 are not particularly informative, merely indicating differences without showing what these result from. A fuller picture can only really be obtained via more advanced data processing.
When data from these analyses were processed via the individual manufacturers peak finding/alignment algorithms a large number of variables were obtained corresponding to both endogenous and drug metabolites etc. Data extraction and alignment parameters were set to be as close as possible in the two software packages. Typically, MarkerLynx found ca. 2800 variables in positive and ca. 1400 in the negative ESI QTOF data. Similar processing of the QTRAP dataset by MarkerView gave ca. 3520 variables in positive and ca. 2000 in the ESI negative data. Next XCMS was applied, with identical parameters to both data sets. XCMS found 689 peaks for the positive and 267 peaks for the negative QTOF data and 412 peaks for the positive and 467 peaks for the negative QTRAP data. In analysing these data it is important to understand that, in addition to differences in instrument design, there are also significant differences in the way in which the collected data is processed by the respective manufacturer's software. Different MS instrument manufacturers use different raw data formats. On top of that, different algorithms are used for data processing (filtering, feature detection, alignment and normalisation). Typically these algorithms operate in a totally different manner (for a recent review of data processing of MS based metabolomics see13). A description of the operation of the data treatment software used in the present study is given in Supplementary Information.
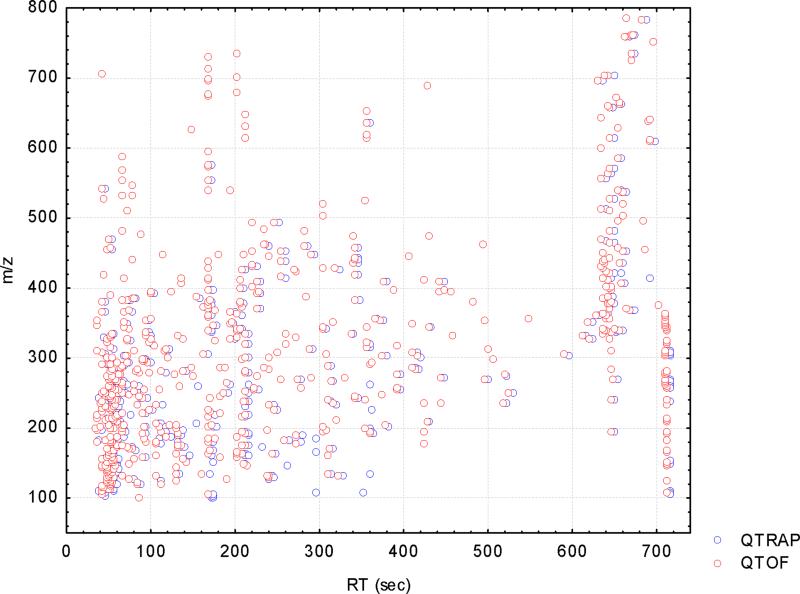
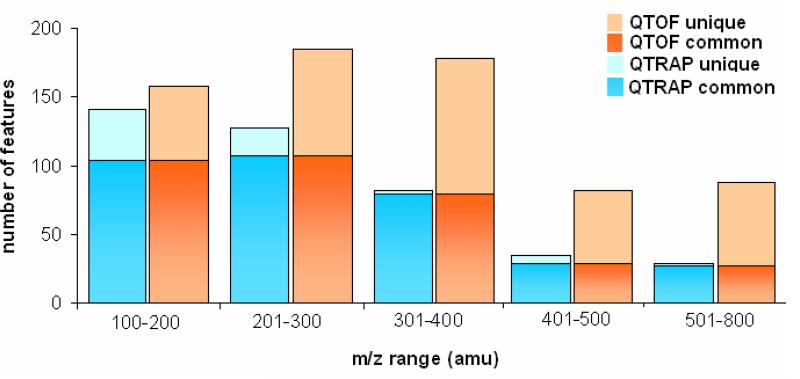
However, even taking such factors into account it is nevertheless clear that there were differences between the instruments themselves. This is shown, for example, by the different number of ions/variables found from the different mass spectrometers and the corresponding software. Moreover, even when a common method was used to extract the data, by applying the XCMS software, different numbers of peaks were detected in each case with a larger number of ions e.g. from the positive QTOF data (689) than from the positive QTRAP data (412), probably due to differences in sensitivity, mass resolution and accuracy of the two mass spectrometers. Thorough examination by manual inspection of the peak lists revealed that 347 of these ions were common between the two sets. These common features were spread through the whole retention time range. Interestingly most of these were distributed in the mass range of 100 to 400 amu. In Figure 1a features detected by XCMS from the two instruments are overlaid in retention time –mass space. Figure 1b gives the numbers of common and unique ions in separate mass ranges. It was seen that the QTRAP peak list contained unique ions in the range up to 300 amu whereas fewer ions were seen at higher masses. In the QTOF peak list in mass range higher than 300 amu, more than half of the detected ions were unique. The question is however, what effect do all of these apparent differences have on the outcome of the analysis?
Figure 1.
a) Scatter plot of the features detected in positive ESI in the QTOF (red circles) and the QTRAP (blue circles) overlaid in retention time and mass range. b) Bar plots showing the common (lower part of the bar), unique (upper part of the bar)and total (sum of the two) ions from the two instruments sorted according to mass range.
3.1 Positive ESI data
3.1.1 PCA models
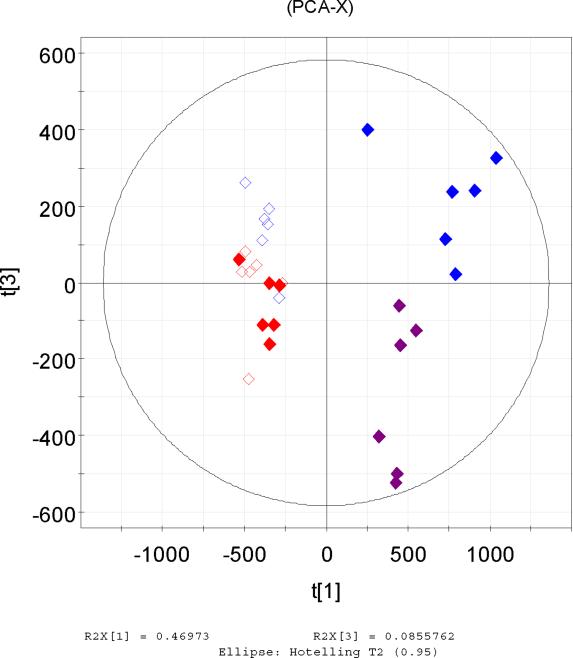
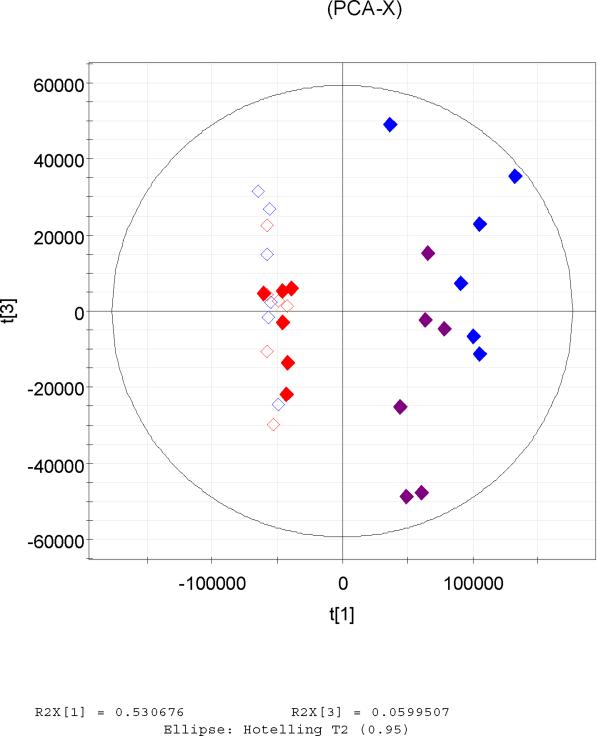
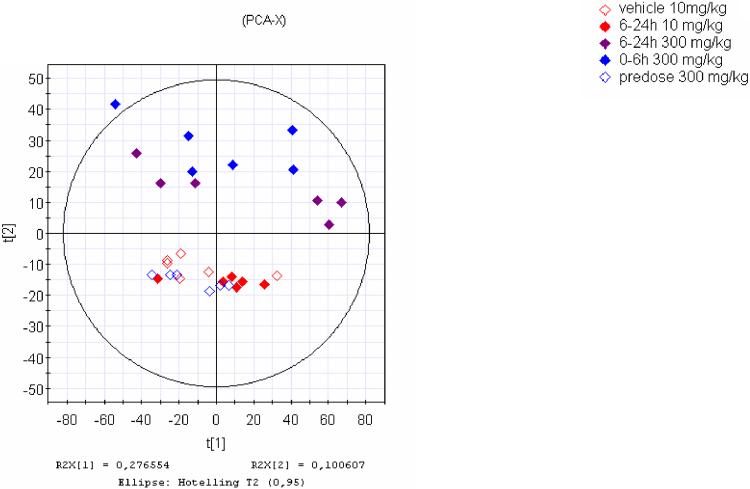
The raw spectrometric data from the two mass spectrometers, which were processed by XCMS were firstly analysed by PCA. Scores plots gave very similar patterns for the two datasets which revealed the same correlations between the analysed samples in each set. In particular it was observed that in both datasets the 300 mg/kg post-dose samples clustered away from the other three groups in t[1] vs t[3] (Figure 2a, b). It seems that differentiation of urine samples from the high dose (300 mg/kg) animals is clear, even 6–24h after dosing, in contrast to the 10 mg/kg post-dose samples which group together with the controls. The highest differentiation between the samples was thus due to the dosing of the drug which is described by the first PCA component in both cases a and b in Figure 2. Indeed as described later a number of the discriminating ions corresponded to drug metabolites.
Figure 2.
Principal Components scores t[1] vs t[3] of UPLC-MS data (positive ESI) of the same UPLC eluent analysed simultaneously by QTOF (a, left) and QTRAP (b, right) after processing by XCMS. The highest variation is expressed by the 1st PCA component and was due to the high dose of the drug. Figure 1c. PCA scores plot t[1]/t[2] of the positive ESI data acquired by the QTRAP and processed by MarkerView software showing the high degree of similarity to a and b.
When these raw datasets were also processed by the MS vendor's software they provided similar PCA plots. For example Figure 2c shows a very similar PCA pattern (t[1] vs t[2]) for the QTRAP data treated with MarkerView; the difference is that just 27% of the variation was described by t[1] compared to 47% for the XCMS-derived model. The same type of finding was also obtained for the QTOF data processed with MarkerLynx (PCA plot not shown).
In all the above datasets when the 300 mg/kg predose samples were examined by PCA, irrespective of the software used, they were not found to differ from the 10 mg/kg vehicle control samples. Also the 6–24h 10 mg/kg post-dose samples clustered together with the predose and vehicle control groups. This indicates that the urinary metabolite profile of the rats dosed with the low (“therapeutic”) dose of 10 mg/kg remained similar to those rats dosed only with the vehicle, or those that were not dosed at all.
In an attempt to detect subtle changes, separate PCA models were built for each of the two dose groups. When comparing the 10 mg/kg post-dose samples with the respective vehicles we were still unable to obtain separation of the two groups irrespective of the software used to process the MS data. These groups could not be separated even when a supervised method of analysis (PLS DA) was applied to all the datasets (no component could be calculated).
Examination of the 300 mg/kg dose group in separate models provided very clear differentiation of pre-dose from 0–6h and 6–24h post-dose samples in both QTOF and QTRAP data (XCMS processing). In these models the predose group showed greater differences with the 0–6h post-dose samples compared to the 6–24h post-dose sample. In contrast the QTRAP data extracted by MarkerView, or QTOF data extracted by MarkerLynx, showed the 0–6h and 6–24h samples mapping together (PCA results not shown).
3.1.2 PLS-DA and OPLS-DA models
“Key” ions found as major contributors to the grouping of the samples according to dose, were compared for the two positive ionisation datasets by univariate analysis (pairwise t-test) but also by applying PLS-DA or OPLS-DA to the XMCS processed data. Variables that were highlighted by scatter plots, contribution plots and S-plots and that may reflect potential markers of the effects of the drug were found to be similar, to an extent but they appeared with a different order of contribution for each set.
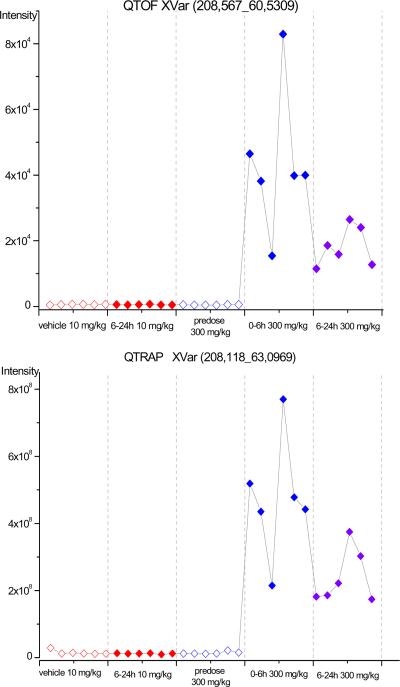
One third of these significant features were ions which were detected with higher signal intensity in the 300 mg/kg post-dose samples and were low or absent in the other three groups. Among these variables were ions derived from the drug itself (m/z 138.564, retention time (rt) 47.44 sec detected by the QTOF or m/z 138.065 rt 50.65 sec detected by the QTRAP) or ions most probably derived from drug metabolites. For example the feature m/z 180.586, rt 52.24 sec seen in the QTOF, or m/z 180.006, rt 56.14 sec detected by the QTRAP, corresponded to the acetyl-metabolite of the drug (acetylisoniazide, Mw: 179.18). Figure 3 gives a characteristic trends plot for an ion detected to be higher in the 300 mg/kg post-dose samples showing the similarity of the profile in the samples captured by the two mass spectrometers.
Figure 3.
Intensity profiles of an ion, nominal mass m/z 208, detected in positive ESI in QTOF (top) and QTRAP (bottom), showing higher intensities in the 300 mg/kg post-dose group and similar trends in both mass spectrometers: .
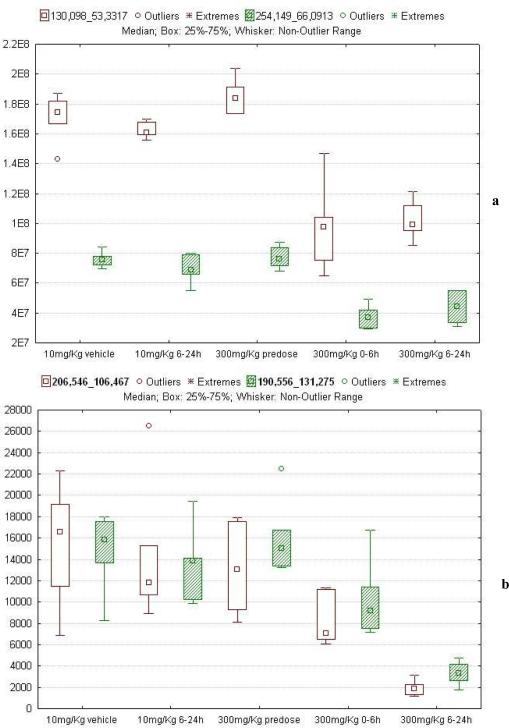
The higher number of ions that contributed to the separation of the 0–6h and 6–24h 300 mg/kg post-dose samples from the other three groups were those which were found to have lower signals in the 300 mg/kg dosed animals. Interestingly it was found that ca 70% of these ions were not highlighted as significant in both datasets Examples of such cases are given in Figure 4 a, b which provides box plots for ions whose signal was found to be significantly lower in the 300 mg/kg post-dose urine samples in only one of the datasets.
Figure 4.
Box plots for ions found to be significantly lower in the 300 mg/kg post-dose samples compared to vehicle, 10 mg/kg post-dose and 300 mg/kg predose samples. These ions were highlighted as differentiators in one of the two datasets as given here: (a) ions 130.098_53.33 and 254.149_66.09 picked in QTRAP positive ESI (b) ions 130.098_53,33 and 254.149_66.09 picked in QTOF positive ESI.
The most significant up and down regulated variables in the QTOF and in the QTRAP data, as highlighted by the S-plot of the OPLS-DA model, are listed in Table 1. Whilst some of the ions found to be significant were common to both datasets there were nevertheless a high number that were unique to each mass spectrometer. In the Venn diagrams (Table 1) the number of the significant variables found to be unique or in common between the two positive datasets is illustrated.
Table 1.
Most significant up and down regulated variables in the high dose samples highlighted by OPLS-DA model created by SIMCA P in the +ve ESI data on the QTOF and the QTRAP. Venn diagrams show the number of significant ions found in both or solely in one of the two datasets.
 |
 |
||||||
|---|---|---|---|---|---|---|---|
| (+ve ESI) QTOF | (+ve ESI) QTRAP | (+ve ESI) QTOF | (+ve ESI) QTRAP | ||||
| m/z | Rt (sec) | m/z | Rt (sec) | m/z | Rt (sec) | m/z | Rt (sec) |
| 266.550 | 60.046 | 121.079 | 59.541 | 297.592 | 91.145 | 297.124 | 94.789 |
| 180.586 | 52.243 | 138.065 | 50.657 | 190.556 | 131.275 | 162.053 | 55.153 |
| 138.564 | 47.442 | 266.102 | 68.496 | 338.501 | 168.511 | 105.016 | 173.699 |
| 208.567 | 60.531 | 122.102 | 53.994 | 162.563 | 168.342 | 338.066 | 172.631 |
| 123.558 | 48.962 | 123.096 | 55.339 | 206.546 | 106.467 | ||
| 124.561 | 47.215 | 208.118 | 63.097 | ||||
| 180.006 | 56.105 | ||||||
| 204.128 | 68.945 | ||||||
3.1.3 Hierarchical PCA models
Hierarchical PCA was applied to combine the data blocks from the QTRAP and QTOF and to avoid scaling issues. This is recommended since the raw data from the two mass spectrometers data sets had very different scales for signal intensity.
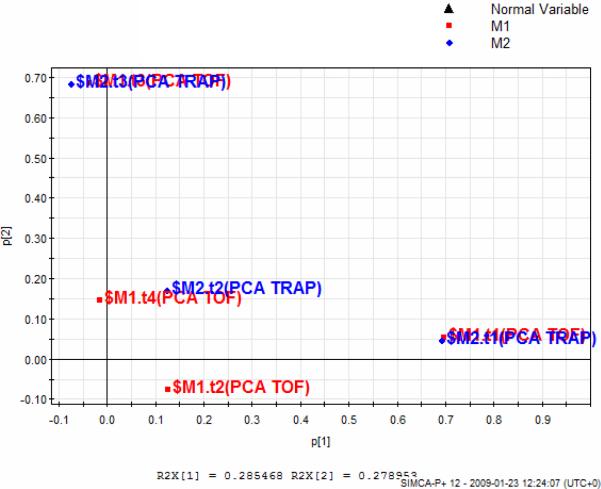
Hi-PCA enabled the similarity of the PCA component directions in the lower level PCA models to be examined. In this way the most dominant patterns-differences in the pair of datasets obtained from the two mass spectrometers are seen. In Hi-PCA the PCA scores of the QTOF and QTRAP datasets were used to build an overview model. This model, which required forcing to 2 components due to the high orthogonality of the scores, provided a Hi-PCA plot that was very similar to the individual PCA models. From the loadings plot shown in Figure 5a it was observed that the 1st and 3rd components of the two datasets contained very similar information whereas the 2nd components showed some differences (t2 of the two models are not plotted together). In the 1st component significant ions contributed mainly positively (i.e. they increased in the 300 mg/kg post-dose groups) whereas in the 3rd component the significant ions contributed both positively and negatively. When these ions were checked they were found in agreement with the OPLS DA findings. In the 2nd component mostly noise was observed.
Figure 5.
a) Loadings plot of Hi PCA models where QTOF and QTRAP datasets are combined. M1 corresponds to (+ ve ESI) QTOF data and M2 to (+ve ESI) QTRAP data. M1.t1 and M1.t3 are highly aligned with M2.t1 and M2.t3 respectively whereas M1.t2 and M2.t2 are not similar. Corresponding figures for (−ve ESI) is found in supporting information (Figure S5).
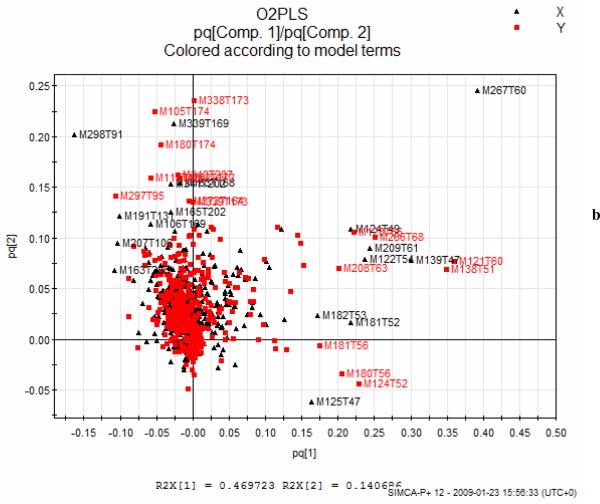
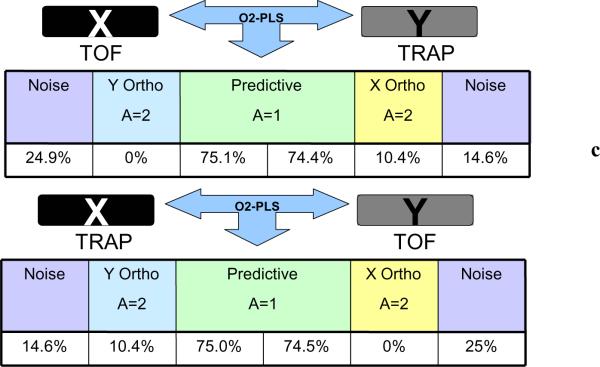
b) Loadings plot of the two joint datasets in the O2PLS model showing the features (mass-RT pairs) deriving from (+ve ESI) QTOF data in black and from (+ve ESI) QTRAP data in red, c) Overview of the constructed O2PLS models for (+ESI) ESI datasets.
Corresponding figures for (−ve ESI) is found in supporting information (Figure S6).
3.1.4 O2PLS models of QTOF vs QTRAP datasets
In addition to the above O2PLS analysis of the QTOF vs QTRAP data was performed. Such models enable the common sources of variation as well as those that are unique to each data set to be determined. In Figure 5b a pq loadings plot is given of the two joint datasets showing the mass-RT pairs from each dataset that coincide. From that model it was found that 75% of the variation of the X block (QTOF) was related to Y (QTRAP), 25% was true noise and 10.4% was unique to the Y block (QTRAP). This possibly indicates that there was more information or systematic variation in the QTRAP data. The reverse analysis was also performed and an O2PLS model was build for QTRAP (X block) vs QTOF (Y block) data in order to check for consistency in the findings. Again the conclusion was that the QTRAP dataset contained about 10% more information than QTOF dataset and this was unrelated to features in the QTOF dataset. (In Figure 5c a summary of the O2PLS models constructed is given). Since, according to the above discussion, the QTRAP data does not seem to contain more information concerning the separation of the groups (similar PCA patterns and clustering) the conclusion is that there is a systematic or instrumental effect on these data.
3.2 Negative ESI data
The negative ESI datasets were examined in the same way as the positive ESI datasets. Analysis of these data showed that the information provided by the two instruments was very similar and the findings were in accordance to those obtained from positive ESI data. These results are described in detail in the supporting information along with the appropriate Figures.
4. Discussion
The data analysis provided PCA scores derived from the two mass spectrometers that were very similar in both positive and negative ESI. However, deeper examination of the data revealed that there were differences in a number of variables that contributed to the grouping of the samples. These remained even when the data were analysed using the same software to eliminate differences that might have arisen from differences between the manufacturers own bespoke software packages. These differences were most obvious for those variables which were present in reduced amounts in the samples from the high dose group. Given that the separation “seen” by both mass spectrometers was the same, these differences must be presumed to be due to differences in design and/or operational modes between the two instruments, although the different initial format of the raw data could also have an affect on the ions that were picked-up by the XCMS software. These results are not surprising, but they may have implications for cross instrument and interlaboratory comparisons, even when supposedly identical separations are being used. Such observations also complicate moves towards standardisation in LC-MS based metabonomics/metabolomic investigations (useful discussion on the topic of standardisation is found in references14,20).
Whilst it might be anticipated that extracting the data from these two mass spectrometers using the same software package would result in similar results it is noteworthy that even when the data were processed using the vendors' software the overall PCA scores were again similar. This, despite the fact that the peak tables obtained via MakerLynx and MarkerView contained higher numbers of ions compared to XCMS.
Nevertheless, notwithstanding the differences discussed above, an important finding is that PCA alone was enough to separate the groups of animals according to the dose irrespective of the instrument or software package used. Thus, it is clearly feasible to use either mass spectrometer/software for this type of work with the expectation that differentiation of sample groups would result. That said, there were clear differences between instruments and ionisation modes with the clearest group PCA separation seen for the QTOF in positive ESI data when analysed by XCMS and in negative ESI data when analysed using MarkerLynx software. It is also noteworthy that from some models we obtained more information (e.g. clear separation of the 0–6h from the 6–24h 300 mg/kg post-dose group in the negative ESI data) from the QTOF analysed via Markerlynx than from other models where these differences were masked.
Another finding from this analysis was that the XCMS-extracted data for these samples generally provided the most robust PCA models with both a higher percent of variation explained by the model for the first components and higher predictive ability.
Finally from the O2PLS models it was concluded that the two methodologies provide data with approximately 70–80% similarity in the information present. The variation detected in the QTRAP data unrelated to QTOF data may indicate that the QTRAP is carrying 10–12% more information, but these additional data did not appear to be useful for defining differences between the groups of samples in relation to their different metabolic profiles.
5. Conclusions
Two types of mass spectrometer run in parallel and analysing the same UPLC eluent for metabonomic analysis of urine both generated data that was capable, following statistical analysis, of detecting differences and grouping the samples into predose/vehicle control and high dosed groups, with samples from animals receiving a “pharmacological” dose grouping with the control/predose samples. Examination of the loadings plots obtained by multivariate analysis of the data revealed that many of the significant ions detected by both mass spectrometers were common but nevertheless the separation was not based on exactly the same ions being detected by the two mass spectrometers. Given the design differences between instruments this is perhaps not that surprising a finding but nevertheless it raises important questions about how to evaluate data from different laboratories produced on different mass spectrometers even when (nominally) the same sample processing and chromatography have been used. It is also quite clear from this set of experiments that the data processing software used can also influence the outcome of the study. These results further underline the care that must be taken in sample analysis and data processing in metabolic profiling experiments, and highlight the difficulties facing approaches towards standardisation in metabolomics/metabonomics studies employing LC-MS-based strategies.
Supplementary Material
Acknowledgments
H.G. Gika's work was funded by a European Reintegration Grant (ERG 202132). S. Sumner's and R Snyder's work was supported through funding via an NIH Roadmap Grant and the National Institute of General Medical Sciences (Grant 5R21GM75903) The authors thank Alexandros Pechlivanis for his assistance on processing the raw data by XCMS.
References
- (1).Plumb RS, Stumpf CL, Gorenstein MV, Castro-Perez JM, Dear GJ, Anthony M, Sweatman BC, Connor SC, Haselden JN. Rapid Commun. Mass Spectrom. 2002;16:1991–1996. doi: 10.1002/rcm.813. [DOI] [PubMed] [Google Scholar]
- (2).Lenz EM, Bright J, Knight R, Westwood FR, Davies D, Major H, Wilson ID. Biomarkers. 2005;10:173–187. doi: 10.1080/13547500500094034. [DOI] [PubMed] [Google Scholar]
- (3).Yin P, Zhao X, Li Q, Wang J, Li J, Xu G. J Proteome Res. 2006;9:2135–43. doi: 10.1021/pr060256p. [DOI] [PubMed] [Google Scholar]
- (4).Lafaye A, Junot C, Ramounet-le Gall B, Fritsch P, Tabet J-C, Ezan E. Rapid Commun. Mass Spectrom. 2003;17:2541–2549. doi: 10.1002/rcm.1243. [DOI] [PubMed] [Google Scholar]
- (5).Williams RE, Lenz EM, Lowden J, Rantalainen M, Wilson ID. Mol. Biosystems. 2005;1:166–180. doi: 10.1039/b500852b. [DOI] [PubMed] [Google Scholar]
- (6).Shen Y, Zhang Y, Moore RJ, Kim J, Metz TO, Hixon KK, Zhao R, Livesay EA, Udseth HR, Smith RD. Anal. Chem. 2005;77:3090–3100. doi: 10.1021/ac0483062. [DOI] [PubMed] [Google Scholar]
- (7).Wilson ID, Nicholson JK, Castro-Perez J, Granger JH, Johnson K, Smith BW, Plumb RS. J. Proteome Res. 2005;4:591–598. doi: 10.1021/pr049769r. [DOI] [PubMed] [Google Scholar]
- (8).Wikoff WR, Anfora AT, Liu J, Schultz PG, Lesley SA, Peters EC, Siuzdak G. Proc Natl Acad Sci U S A. 2009;106:3698–703. doi: 10.1073/pnas.0812874106. [DOI] [PMC free article] [PubMed] [Google Scholar]
- (9).Ipsen A, Want EJ, Lindon JC, Ebbels TMD. Anal. Chem. 2010;82:1766–1778. doi: 10.1021/ac902361f. [DOI] [PMC free article] [PubMed] [Google Scholar]
- (10).Lenz E, Wilson ID. J. Proteome Res. 2007;6:443–458. doi: 10.1021/pr0605217. [DOI] [PubMed] [Google Scholar]
- (11).Lu X, Zhao X, Bai C, Zhao C, Lu G, Xu GJ. Chrom B. 2008;866:64–76. doi: 10.1016/j.jchromb.2007.10.022. [DOI] [PubMed] [Google Scholar]
- (12).Theodoridis G, Gika HG, Wilson ID. TRAC Trends Anal Chem. 2008;27:251–260. [Google Scholar]
- (13).Katajamaa M, Oresic MJ, Chromatogr A. J. Chromatogr. A. 2007;1158:318–328. doi: 10.1016/j.chroma.2007.04.021. [DOI] [PubMed] [Google Scholar]
- (14).Theodoridis G, Gika HG, Wilson I,D, Mass Spectrom Rev. 2010 doi: 10.1002/mas.20306. in press. [DOI] [PubMed] [Google Scholar]
- (15).Pandher R, Ducruix C, Eccles SA, Raynaud FI. J. Chromatogr. B. 2009;877:1352–1358. doi: 10.1016/j.jchromb.2008.12.001. [DOI] [PubMed] [Google Scholar]
- (16).Sumner SJ, Burges JP, Snyder RW, Popp JA, Fennell TR. Metabolomics. 2010;6:238–249. doi: 10.1007/s11306-010-0197-8. [DOI] [PMC free article] [PubMed] [Google Scholar]
- (17).Gika HG, Theodoridis G, Wingate JE, Wilson ID. J. Proteome Res. 2007;6:3291–3303. doi: 10.1021/pr070183p. [DOI] [PubMed] [Google Scholar]
- (18).Gika HG, Macpherson E, Theodoridis G, Wilson ID. J. Chromatogr. B. 2008;871:299–305. doi: 10.1016/j.jchromb.2008.05.048. [DOI] [PubMed] [Google Scholar]
- (19).Smith CA, Want EJ, O'Maille G, Abagyan R, Siuzdak G. Anal. Chem. 2006;78:779–787. doi: 10.1021/ac051437y. [DOI] [PubMed] [Google Scholar]
- (20).Verpoorte R, Choi YH, Kim HK. Phytochem. Anal. 2010;21:2–3. doi: 10.1002/pca.1191. [DOI] [PubMed] [Google Scholar]
Associated Data
This section collects any data citations, data availability statements, or supplementary materials included in this article.


