

Abstract
Tracer-based metabolomics is a systems biology tool that combines advances in tracer methodology for physiological studies, high throughput “-omics” technologies and constraint based modeling of metabolic networks. It is different from the commonly known metabolomics or metabonomics in that it is a targeted approach based on a metabolic network model in cells. Because of its complexity, it is the least understood among the various “-omics”. In this review, the development of concepts and practices of tracer-based metabolomics is traced from the early application of radioactive isotopes in metabolic studies to the recent application of stable isotopes and isotopomer analysis using mass spectrometry; and from the modeling of biochemical reactions using flux analysis to the recent theoretical formulation of the constraint based modeling. How these newer experimental methods and concepts of constraint-based modeling approaches can be applied to metabolic studies is illustrated by examples of studies in determining metabolic responses of cells to pharmacological agents and nutrient environment changes.
Introduction
Recent developments in high throughput technologies have enabled profiling of mRNA, proteins and metabolites giving rise to the fields of transcriptomics, proteomics and metabolomics. Metabolomics (metabonomics) being the latest addition to the “-omics” was initially conceived by an industrial and academic consortium (Consortium for Metabonomic Toxicology; COMET) for rapid screening of drug toxicity using nuclear magnetic resonance (NMR) technology [1, 2]. The formation of metabolites being the final manifestation of gene expressions makes the profiling of these metabolic products a useful tool for characterization of phenotype. For such reasoning, metabolomics (metabolite profiling) has found its use in genotype-phenotype correlations and biomarker discoveries in addition to its use in toxicology and drug development [3, 4]. In the intervening years since COMET, improvement in the sensitivity and mass accuracy in mass spectrometry has made mass spectrometry the choice instrumentation in compound identification and quantitation of metabolites in biological samples [5, 6]. Significant progress in metabolomics has been made in the first publication of the human metabolome and the establishment of many reference databases such as Human Metabolome Database [7] (www.hmdb.ca) and LIPIDMAP (www.lipidmap.org). Other web-based tools for data processing and data presentation have been developed. [8-10].
Despite successes in improved compound identification and quantitation, there still remain conceptual challenges and technical limitations typical to the use of mass spectrometry in quantitative analysis [11, 12]. For non-targeted analyses, the wide range of metabolite concentrations from millimolar to picomolar range requires conscious choices to either develop algorithms to increase the number of compounds detected, or narrowing the profile to compounds in a pre-determined range of molecular weights or classes. For targeted analyses, in the absence of isotope recovery standards, issues such as matrix effect and ion-suppression present huge challenges to quantitative analysis. There are also considerations that are common to other biological investigations such as experimental design, sampling procedure, sample preparation and convention in data presentation (dimension or unit of measure). Given these limitations, results from metabolomics are mostly semiquantitative in nature and are useful for analysis by principal component analysis (PCA) for identifying special features of a metabolic phenotype, and partial least squares analysis (PLS) for comparison of two phenotypes [13, 14].
Tracer-based metabolomics is a special form of targeted metabolomics in which the distribution of 13C from a labeled precursor among various metabolic intermediates is determined [15-17]. The use of stable isotope tracers and mass isotopomer analysis helps to define the metabolic intermediates relevant to the objective of the study. The known metabolic pathways allow interpretation of precursor-product relationship of compounds, and the distribution of 13C allows the determination of quantitative relationship between precursor and product [18]. The data from tracer-based metabolomics can be analyzed and interpreted using constraint based modeling and phenotypic phase plane analysis [16, 17] providing tracer-based metabolomics the capability of quantitative comparison of phenotypes making it a truly systems biology approach. In this review, the concepts of tracer-based metabolomics are outlined, and examples of its application in studies of metabolic responses of cells to pharmacological agents and nutrient environment changes are presented.
Application of stable isotope tracers and mass isotopomer analysis
Radioactive and non-radioactive isotopes have been the principal tools for the study of kinetics of biochemical reactions. Traditionally, radioisotopes have been used for their high sensitivity. Many of these radioisotope applications such as incorporation of radioactive thymidine in determining DNA synthesis are still in use today. The appearance of radioactivity in the product or the disappearance of radioactivity in the precursors over time is used to determine the rate of reaction of enzymes [19]. However, it has long been recognized that in metabolic studies in cells culture or in whole animals, the precursor specific activity is often unknown through dilution by unlabeled precursor or recycling of the tracer through other metabolic intermediates [20]. The dilution of tracer along the path of synthesis greatly complicates the determination of substrate fluxes. Various techniques have been used to overcome such difficulties using specifically (recyclable and non-recyclable) labeled precursor, or performing detailed chemical degradation of the product to identify the product of a specific pathway [21]. For example, since tritium in [3-3H]-glucose, a non-recyclable tracer, is lost in the triose phosphates step of glycolytic/gluconeogenic pathways while 14C from [U-14C]-glucose, a recyclable tracer, is retained, [3-3H]- and [U-14C]-glucose have been used in the determination of direct and indirect pathways of glycogen synthesis [22]. The ratio of 3H to14C activities in glycogen glucose reflects the ratio of direct/indirect pathways of glycogen synthesis. Another approach is to use position specific labeled substrate and chemical degradation of the product to trace the redistribution of the tracer in the product. When [1-14C]-glucose was also used in the determination of direct and indirect pathways of glycogen synthesis, the 14C label in carbon 1 and carbon six of glycogen glucose could be determined after chemical degradation, and the ratio of 14C in C1 to C6 positions was used to reflect the contribution of direct and indirect pathways in glycogen synthesis [23]. With the advent of stable isotope and mass isotopomer analysis, positional isotopomers from isotope exchange and dilution through intersecting pathways can be estimated without the need for chemical degradation. Stable isotope and mass isotopomer analysis has essentially replaced radioactive tracers in complex metabolic studies. Thus, [U-13C6] glucose has been used as a single tracer in the study of direct/indirect pathways of glycogen synthesis (23); [1, 2-13C2]-glucose has replaced [1-14C]- and [6-14C]-glucose as a single tracer in the study of pentose cycle pathways [24]; and [U-13C6] glucose or [U-13C3] lactate have replaced the use of specifically labeled lactate in the study of gluconeogenesis and tricarboxylic acid (TCA) cycle metabolism [25-27].
One key advantage of stable isotope application is the generation of positional and mass isotopomers from 13C labeled precursors which can be determined without purification and chemical degradation. Positional isotopomer refers to isomers with 13C substitution in a specific carbon position and mass isotopomer, isomers with specific number of 13C substitutions in the compound. These definitions allow the distinction between 13C labels in multiple positions in the same molecule. For example [1, 2-13C2]-glucose and [1,6-13C2]-glucose are both m21 mass isotopomers but different positional isotopomers. The formation of mass/positional isotopomers in metabolic intermediates from the distribution of 13C of a specifically labeled precursor depends on the biosynthetic pathway and the relative dilution of intermediates. This is illustrated by the example of labeling of 3-carbon, 4-carbon and 5 carbon intermediates of the TCA cycle (Figure 1). Examples of 3-carbon intermediates are: lactate, pyruvate, glycerol and alanine; examples of 4-carbon intermediates: oxaloacetate, malate and aspartate, and examples of 5 carbon intermediates: α-ketoglutarate, glutamate, proline and ornithine. In Figure 1, [2, 3-13C2]-pyruvate is carboxylated to [2, 3-13C2]-oxaloacetate which combines with unlabeled acetyl-CoA to form citrate and the resultant [2, 3-13C2]-α-ketoglutarate (steps 1and 2). In the completion of the first turn of the TCA cycle (step 3), the oxaloacetate is labeled in the 1 and 2 or 3 and 4 positions, which then becomes [1-13C]- or [3-13C]- α-ketoglutarate (steps 4, 5 and 6). The 13C carbon is essentially lost to dilution after several turns of the TCA cycle. In the direct synthesis of oxaloacetate from [2, 3-13C2]-pyruvate, only [2, 3-13C2]-oxaloacetate is produced. However, if the production of oxaloacetate is sampled for a longer time period than the turn of TCA cycle, other m2 and m1 isotopomers can be found. The distribution of mass and position isotopomers in 3-carbon, 4-carbon and 5-carbon intermediates reflects the complex contribution of anaplerotic flux. The time dependent appearance of these isotopomers and the respective labeling positions provide pathway information and dynamic fluxes through the multiple reactions of TCA cycle, which is not available to non-tracer-based metabolomics approaches. The pathway dependent position and mass isotopomer information for central glucose metabolism has been well studied using 13C labeled glucose [28-30]. Starting with [U-13C6]-glucose, 13C label can be found in non-essential amino acids, glycogen, ribose, fatty acids and lactate. The isotopomer distributions in these products reflect one-carbon metabolism, the pentose cycle, TCA cycle and glycolytic/gluconeogenic pathways in the cell. Similar information on 13C labeling of amino acids from [U-13C6]-glucose in yeast and bacteria is well known and available in the literature [31, 32]. Therefore, it is possible to systematically investigate the cellular metabolic network using appropriately designed tracers and quantitation of mass isotopomers in multiple metabolites.
Figure 1.
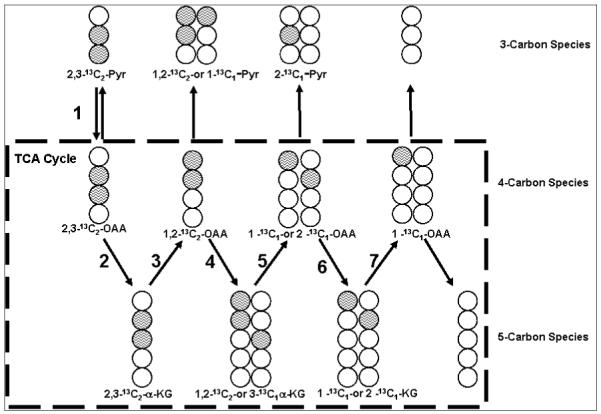
Labeling of 3-carbon-, 4-carbon and 5-carbon metabolic intermediates from [1,2-13C2]-glucose or [2, 3-13C2]-lactate through the TCA cycle. Open circles represent 12C carbons and shaded circles represent 13C carbons. The direction of flow of TCA cycle substrates is indicated by the numbered arrow. Pyr stands for pyruvate, OAA for oxaloacetate and KG for ketoglutarate.
The formation of mass isotopomers is a unique feature of stable isotope incorporation in compounds with repeating units such as saturated fatty acids. The analysis of mass isotopomer distribution (MIDA) in fatty acids which has repeating 2-carbon (ethyl) units has been exploited in the study of fatty acid de novo synthesis [33, 34]. The mass isotopomer distribution in newly synthesized fatty acids is a function of both precursor (acetyl-CoA) enrichment and fraction of new synthesis. Thus, mass isotopomer distribution analysis potentially can give information on the precursor enrichment as well as fraction of new synthesis of non-essential fatty acids. The use of perdeuterated or uniformly 13C labeled fatty acids has been used to study chain elongation and chain shortening [35, 36]. Since many 2-carbon or three carbon metabolic intermediates are precursors of acetyl-CoA, study of fatty acid synthesis provides a window to the utilization carbohydrate and fatty acids in cellular metabolism [37].
Quantitative aspects of isotopomer analysis
In quantitative analysis, the unit of measure (dimension) is important in the calculation of synthesis or degradation rate. The unit of measure used in tracer-based metabolomics is expressed in terms of isotopomer molar fraction (or ratios), and isotopic enrichment per molecule (or per carbon atom) of metabolites rather than relative concentrations (activities) of metabolites in a sample as in many metabolomics studies. In cases where absolute concentration of a metabolite is determined, the concentration of the metabolite can be used together with the isotopomer information for the calculation of net 13C incorporation (net flux) in the compound [38]. There are several concepts that are common to stable isotope and radioisotope tracer studies [19]. In radioisotope application, there are two important units of measure: specific activity (activity per molecule and activity per carbon atom) and total activity, which is the product of specific activity and concentration. The knowledge of the denominator of the specific activity (SA) unit is important for the interpretation of results. For example, when [1-14C]-glucose is used to study glycolysis, the activity per carbon of the precursor (glucose) is the same as the activity per carbon of the product (lactate). On the other hand, the activity per molecule in glucose is twice that of activity per molecule of lactate. As pointed out by Des Rosiers et al., when such units of measure are not clearly applied, error in the calculation of synthesis based on isotope data can result [39]. In stable isotope applications with 13C labeled precursor in metabolic studies, the corresponding units are: enrichment per molecule (molar fraction) and average enrichment per mole or per carbon [38, 40]. Molar fraction of an isotopomer is the fraction of the isotopomer (mi) as a fraction of total number of molecules, and the sum of all mi equals to 1. Average enrichment per molecule is given by sum of the product of molar fraction and the number of isotope substitution given by . The expression of molar percent excess (MPE) used in isotope ratio mass spectrometry is given by average enrichment per molecule divided by the number of atoms (carbon, nitrogen or hydrogen depending on the isotope used) in the molecule, . The use of these units of measure in quantitative analysis of isotopomer has further implication in terms of determining dilution of precursor or product by unlabeled compounds. This is illustrated by the following example. Let us assume that glucose is synthesized by the combination of two [2-13C]-glycerol molecules. The enrichments of [2-13C]-glycerol precursors are 10% and 20% ([2-13C]-glycerol/mole). In the experiment with 20% enriched [2-13C]-glycerol, the product glucose is also diluted by an equal amount of 12C-glucose. The distribution of mass isotopomers in glucose is given by the coefficients of a binomial distribution when there is no dilution in the product. The labeled fraction is proportionally diluted by the unlabeled glucose [38]. The various mass isotopomer measurements and ratios are presented in Table 1. The results of the above example show that dilution of precursor enrichment affects the distribution of labeled isotopomer. Thus, m2/m1 ratio changes with precursor enrichment. The example also shows that product dilution does not alter the relationship among the labeled species, and (m1)/(Σm), (m2)/(Σm) and m2/m1 remain unchanged by product dilution. The ability to exploit mass isotopomer ratios such as (m1)/(Σm), (m2)/(Σm) and m2/m1 for the determination of precursor enrichment, and the calculation of Σmn for the determination of total dilution through the entire metabolic process is a unique feature of mass isotopomer analysis and tracer-based metabolomics.
Table 1.
An Illustration of the Use of Enrichment (Σmn), Molar Fraction (m), and Isotopomer Ratio (m/Σm)
| [2-13C]-glycerol enrichment |
Glycerol (m0) |
Glycerol (m1) |
Glucose (m0)* |
Glucose (m1) |
Glucose (m2) |
(m2)/(m1) | (m1)/(Σm)& | (m2)/(Σm) | (Σmn)# |
|---|---|---|---|---|---|---|---|---|---|
| 0% | 1.0 | 0 | 1.0 | 0 | 0 | na | na | 0 | |
| 10% | 0.9 | 0.1 | 0.81 | 0.18 | 0.01 | 1/18 | 0.01/0.19 | 0.18/0.19 | 0.20 |
| 20% | 0.8 | 0.2 | 0.64 | 0.32 | 0.04 | 1/8 | 0.04/0.36 (1/9) |
0.32/0.36 (8/9) |
0.40 |
| 20% with dilution by 50% unlabeled glucose |
0.82 | 0.16 | 0.02 | 1/8 | 0.02/0.18 (1/9) |
0.16/0.18 (8/9) |
0.20 |
m0 stands for the fraction of molecule having no 13C; m1 fraction of molecule with one 13C and m2, two 13C substitution. The sum of m0+m1+m2 = 1. The molar fractions for m0, m1 and m2 are the coefficients of a binomial distribution (p+q)^2 where q is the enrichment of [2-13C]-glycerol and p=1-q.
(m1)/(Σm) and (m2)/(Σm) are m1 and m2 expressed as a fraction of molecules having 13C substitution. Σm is the abbreviation for . (m0) is not included in the Σm. The ratios (m1)/(Σm) and (m2)/(Σm) are not affected by the product dilution.
(Σmn) stands for and is the sum of the products of the mass isotopomer fraction multiplied by the number of 13C substitutions - m0*0+m1*1+m2*2. It reflects the number of 13C per molecule in glucose. Thus dilution by unlabeled glucose also dilutes the corresponding Σmn.
Constraint based modeling and phenotypic phase plane analysis
In the past decade, the combination of pathway analysis and flux balance analysis has been applied in metabolic studies [41-43]. Such a combined approach is known as constraint-based modeling [44]. There are three basic meanings of constraint-based modeling. The first meaning is derived from the fact that every reaction in a cell is connected to another reaction of the network. Thus every biochemical reaction is constrained by every other reaction through shared co-factors, substrates or enzymes. The second meaning is the use of published values of reaction kinetics of known biochemical reactions to constrain the solution of the set of differential equations of the metabolic network. The third meaning is the use of an objective function as optimization criterion to allow solution of an underdetermined set of equations using linear programming under a set of constraints. It is generally true that most metabolic pathways in cells are coupled in that a high energy substrate is consumed in the forward reaction which is then regenerated from an energy producing reaction forming a futile cycle. Figure 2 shows such a futile cycle of a kinase reaction in which high energy substrate for example ATP is converted to ADP, and the high energy phosphate bond is regenerated by a separate reaction. The consequence of a futile cycle is that the kinase reaction converting a protein (A) to its phosphor-protein (B) is constrained by the availability of ATP, the production of which depends on the reaction converting C to D. In general, biochemical reactions, including signaling pathways by phosphorylation, acetylation and glycosylation of proteins, are constrained because of shared enzymes, substrates, and cofactors. Therefore, metabolic reactions within a cell are regulated through their connections to every other reaction leading to the phenomenon of metabolic regulation or “cross-talk”. The study of metabolic regulation using constraint-based modeling is a natural extension of the traditional study of biochemical reactions as individual linear pathways to the study of metabolic functions of cells in the context of an integrated network of biochemical reactions.
Figure 2.
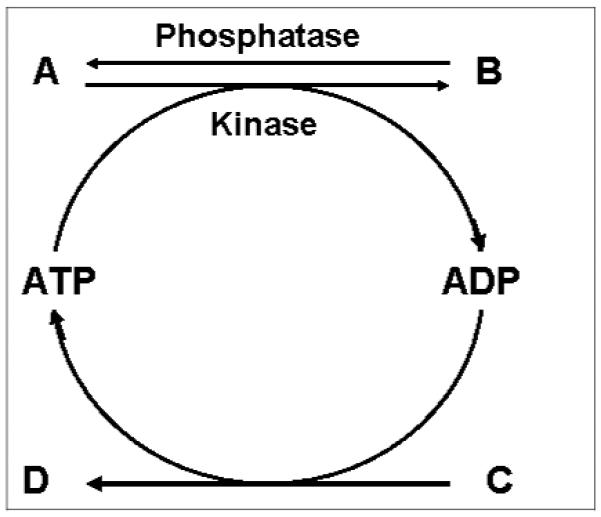
A kinase reaction as an example of futile cycle and a constraint pathway. In this example, the kinase pathway from A to B is constrained by availability of ATP and the reaction of C to D.
Constraint-based analysis has been applied to the study of metabolic systems for more than a decade [44]. In constraint-based modeling, activity of a metabolic reaction or a signaling pathway has to be interpreted in the context of the network and its environment. A metabolic network is defined not only by the members of metabolites and biochemical reactions, but also by a system boundary. Reactions of the network can be separated into three groups: the internal fluxes (v’s), the exchange fluxes (b’s) and the extreme pathways (P’s) (Figure 3). The internal fluxes are fluxes occurring within the cell boundary, and are internal properties of the metabolic network. The exchange fluxes are substrate fluxes in and out of the cell, and represent the interactions between the network (system) and its environment. The extreme pathways as indicated by the P’s in Figure 3 capture the interaction between the internal and exchange fluxes and best represent the metabolic phenotype of the cell [45]. The concept of extreme pathway is the consequence of the definition of a boundary, and is a unique feature of constraint based modeling [45].
Figure 3.
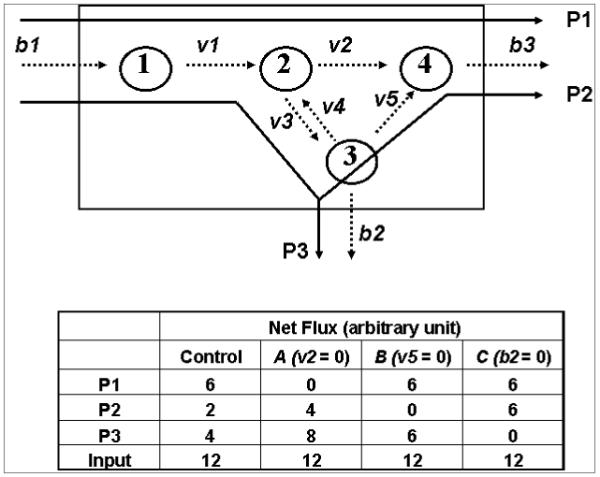
An example of a metabolic network showing reactions as internal and external fluxes; and “extreme pathways” (from Lee [16] with permission). Internal fluxes are indicated by v’s, exchange fluxes by b’s and the extreme pathways by P’s. The metabolic network can be viewed as a simplified model of pentose synthesis, where substrate (1) stands for glucose, (2) for glucose-6-P, (3) fructose-6-P, and (4) ribose-P. b1 stands for glucose uptake; b2 for glycolysis and b3 for nucleic acid synthesis. For illustration purposes, the numerical values of P1, P2, and P3 are constructed using the following hypothetical rules: b1 = 12, v2=v3, v3>>v4, and b2=2v5. Reactions v2, v5, and b2 are set to zero for phenotype A, B, and C respectively.
Features distinguishing constraint-based modeling from the traditional flux analysis can be illustrated by the example in Figure 3. The metabolic system in Figure 3 is a simplified model of pentose synthesis with 4 metabolites (substrate 1, 2, 3 and 4) and 7 biochemical reactions (b1, v1, v2, v3, v4, v5, b2 and b3). The reaction sequence b1→ v1→ v2 → b3 stands for the reactions of oxidative pathways. Glucose is transported into the cell (b1) and subsequently phosphorylated to glucose-6-phosphate (v1). Glucose-6-phosphate dehydrogenase converts glucose-6-phosphate to pentose (v2) which is deposited in nucleic acid (b3). The reaction sequence b1→v1→v3→v5 stands for the non-oxidative branch of the pentose cycle. Glucose-6-phosphate is isomerized to fructose-6-phosphate (v4, v3) and through the non-oxidative pathways to pentose (v5). In this illustration, b2 stands for glycolysis. The dynamic properties can be expressed as a set of rate equations for each metabolic intermediate. In constraint-based modeling, the set of rate equations are rewritten to include the dynamic properties of the products according to the pathway of synthesis (“extreme pathways”: P1, P2, and P3). When an objective function is specified, the system of equations can be solved for P1, P2, or P3 using linear programming2 [41, 44]. The solution of the balance flux equations by linear programming gives a solution space which is bounded by vectors of “extreme pathways” in the form of a high dimension space of a convex solution cone, and the predicted metabolic phenotype (line of optimality) lies within the solution space [46]. In experimental studies, the observed phenotype has to conform to the mathematical solution of a constraint set of reactions. When P1, P2, and P3 are determined experimentally using tracer-based metabolomics, the metabolic phenotype is given by a single point represented by the coordinate (P1, P2, P3) in the high dimension space.
The results from flux balance analysis can be presented graphically in phenotypic phase plane analysis [47] showing the relationship among the extreme pathways and substrate uptake and production [48]. A phenotypic phase plane is a plane through the vertex of the cone of solution. Phenotypic phase plane analysis is based on the quantitative relationship of two “extreme pathways” of the metabolic network. Using the example of Figure 3, we can plot the input (glucose) against the production of glycolytic products (P3) shown in Figure 4a, which describes graphically the relationship between glucose input and the production of glycolytic products in the cell of the control, A, B, and C phenotypes. The plot of input against output divides the phase plane into four regions corresponding to decreasing glycolytic product production for the same input of glucose from region 1 to region 4. Each point on the phenotypic phase plane (except the origin) represents a specific metabolic phenotype (control, A, B, and C). The four lines represent the optimal performance of the cells for each of the phenotype (experimentally determined line of optimality). Each region of the phenotypic phase plane is associated with alteration of all other connected pathways, which can be demonstrated by different phenotypic phase plane analysis as illustrated in a previous review [15, 47]. Therefore, the precise operation of the metabolic system can be summarized by a set of phenotypic phase planes corresponding to net fluxes shown in the insert of Figure 3.
Figure 4a.
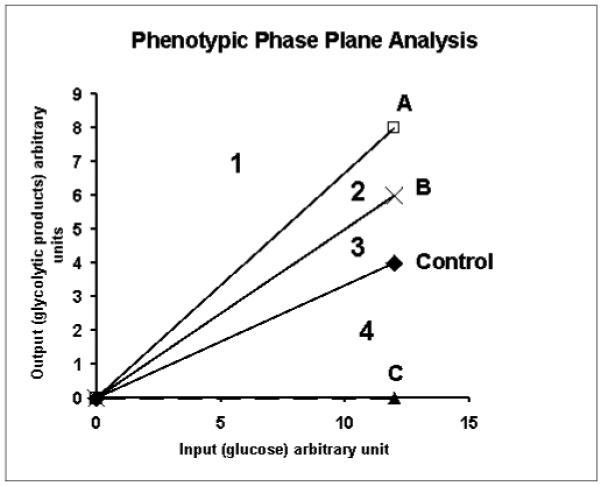
Phenotypic phase plane analysis of metabolic system of Figure 3 demonstrating the use of phenotypic phase plane analysis for metabolic phenotyping. The vectors representing phenotypes of control, A, B, and C divide the phenotypic phase plane in to four regions.
Phenotypic phase plane analysis can also be used to demonstrate the quantitative relationship between two metabolic phenotypes using the concept of isocline. The relationship of phenotypes A and B relative to the “control” is illustrated in Figure 4b. In Figure 4b, line of optimality3 (LO) representing the “control” phenotype is scaled according to the production of pentose from both oxidative and non-oxidative pathways (P1+P2) giving rise to the (P1+P2) axis. Since phenotype A is associated with P1+P2 = 4 (described in Figure 3), the line joining A and 4 on the P1+P2 plane represents the isocline. The isocline expresses the differences in glycolytic product production and glucose input between Phenotype A and the control for the production of the same amount of end products (P1+P2), thus providing a quantitative comparison between phenotype A and the control. The slope of the isocline gives the contribution of glucose to excess glycolytic products without affecting the formation of pentose (P1+P2). In this example, phenotype A utilized 6 units of glucose to produce 4 units of (P1+P2), while the rest of the glucose (6 units) were used to produce 6 extra units of glycolytic products (for a total of 8 units P3 products) in comparison to the control. In a linear system, the phenotypic phase plane plot predicts that when the glucose input is increased to 24, 8 units of pentose are produced for phenotype A. This is shown by drawing an isocline from A’ intersecting the P1+P2 axis. Similar interpretations apply to phenotype B where glucose is used for products other than those from glycolysis, and 6 units of glucose is used to produce 6 units of pentose. The effect of increasing glucose to point B’ on the production of pentose is shown by the isocline at point B’. However, it should be noted that the experimentally determined phenotype does not prove or imply linearity of the system. The extension of the phenotype vector as shown in Figure 4b is only valid when the entire system is proportionally scaled.
Figure 4b.
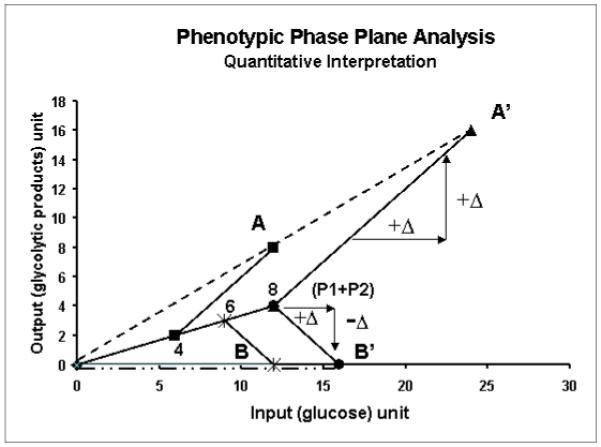
Phenotypic phase plane analysis of metabolic system of Figure 3 demonstrating the use of isocline for comparing metabolic differences between two phenotypes. The quantity of (P1+P2) is scaled onto the control vector to form the (P1+P2) axis. The slope of an isocline indicates the changes in the “extreme pathways” as compared to control for the same result in the output (P1+P2).
Modeling of mass isotopomer data in tracer-based metabolomics
The use of stable isotope in tracer-based metabolomics generates a large amount of isotopomer data. Each isotopomer of a metabolite is essentially a measure of an “extreme pathway”. Therefore, tracer-based metabolomics is a quantitative analysis of metabolic phenotypes among the various approaches in metabolomics [15-17]. Unlike the application of stable isotope as recovery standards [49], the use of 13C labeled precursor to trace metabolic pathways to their final product provides a much needed common denominator in the interpretation of results. The common denominator comes in the form of precursor enrichment (both as isotopomer fraction (m/Σm), and excess enrichment (Σmn)), and product enrichment (Table 1). When absolute concentration is determined using recovery standards, the exact quantity of isotopomer and the total 13C enrichment can be determined. Excess enrichment (Σmn) in the product relative to that of the precursor is the contribution of the precursor carbon to the product. Isotopomer fraction (m/Σm) gives the fraction of new molecules generated from a particular pathway (see Tables 1 and 2). In an experiment with [1, 2-13C2]-glucose, singly labeled ribose (m1) is the product of oxidative pentose cycle and the m2 is the product of non-oxidative pathway. For example, one may find isotopomers in ribose as the following: m0=0.75, m1=0.15, and m2= 0.1. The m1/Σm is 0.6 and m2/Σm, 0.4, and the Σmn, 0.35. Since m1/Σm, m2/Σm and Σmn are relative measurements of these extreme pathways, they can be used in the quantitative characterization of a metabolic phenotype using phenotypic phase plane analysis. These parameters of oxidative and non-oxidative pathways have been used previously to distinguish metabolic phenotype differences in cells in tissue culture. The distribution of oxidative and non-oxidative pathways in ribose synthesis has been applied in the investigation of thiamine responsive megalobastic anemia [50], effect of genistein in a pancreatic cancer cell line, effect of tranfection of specific mutation of ras oncogene in fibroblasts [51] and the effect of TGF beta on a lung cancer cell line [52]. The use of mass isotopomer data in characterizing metabolic phenotypes has been discussed in previous reviews [16-18].
Phenotypic phase plane analysis is an effective way of comparing metabolic phenotypes. It is a graphical presentation of tracer-based metabolomics data which not only demonstrates the differences among phenotypes, but also the quantitative implications of substrate utilization through the pathways in a metabolic network. Because of its novelty, phenotypic phase plane analysis has not been routinely used in tracer-based metabolomics. An example of its use is shown in a recent study of the response of methotrexate resistant HT29 colon cancer cell line to several chemotherapeutic agents and their combinations [53]. Figure 5 (Figure 5b from reference [53]) is a plot of observed m1 (oxidative pentose pathway) to m2 (non-oxidative pentose pathway) of pentose from methotrexate resistant HT29 cells under various treatment conditions. Point #1 represents the “control” phenotype of untreated cells, which divides the phenotypic phase plane into two halves. Point #4 is the phenotype of methotrexate (MTX) treated cells, which is located on one side of the phenotypic phase plane and phenotype of oxythiamine treatment (point #2) on the other. The location of the phenotype #4 in response to MTX specifically indicates a different mechanism of action between MTX and oxythiamine and its lack of efficacy in killing MTX resistant HT29 cells. Oxythiamine (OT) treatment results in reduced m2 (non-oxidative transketolase/transaldolase pathways (point #2), and dehydroepiandrosterone (DHEA) treatment results in decrease of both oxidative and non-oxidative pathways (point #3). When percent cell survival is projected onto the control phenotype represented by the distance between the origin and point #1 (LO), the series of isoclines projected from the treatment phenotypes to the LO roughly corresponds to observed decreasing order of cell survival.
Figure 5.
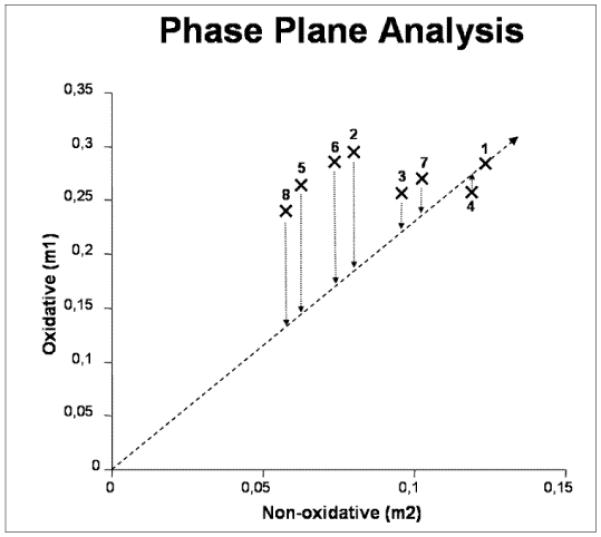
An example of the use of phenotypic phase plane analysis in a study of drug resistance HT29. The observed m1 (oxidative pentose pathway) to m2 (non-oxidative pentose pathway) of cell treated with different combination of drugs are plotted (from Ramos-Montoya et al. [53] with permission). Point #1 is the “control” phenotype of untreated cells; phenotype of oxythiamine (OT) treatment, point #2; dehydroepiandrosterone (DHEA) treatment, point #3 and methotrexate (MTX) treatment, point #4. Phenotypes of the combined treatment are point #5 combined OT+DHEA treatment; point #6 and #7 are for (OT+MTX) and (DHEA+MTX); and point #8, treatment with (OT+DHEA+MTX). Superimposing cell viability on the control phenotype vector creates a new viability axis. The isoclines are lines connecting the degree of cell viability to the metabolic phenotype characterized by (m1, m2).
In general, cellular metabolism depends on the nutrient environment and cellular functions can be altered by changes in the environment. When cells are incubated in different buffers with different composition of substrates, all tracer-based metabolomics data can be used in phenotypic phase plane analysis of cells to quantitatively determine the metabolic responses to these environmental changes. The metabolic phenotypes determined under these conditions lie within the cone of solution. The metabolic phenotypes of isolated hepatocytes in response to changes in incubation medium were reported in a study by Marin et al [54]. Glycogen synthesis was increased when incubation medium was supplemented with glutamine, lactate and pyruvate, or fructose [53] (Figure 6). Balance of flux analysis for glucose-6-phosphate showed increased glucose uptake and gluconeogensis balanced by increased glucose efflux, glycogen synthesis, and lactate production (Table 4 of reference 54). These specific changes can be used in phenotypic phase plane analysis as shown in Figures 7a, 7b, and 7c.
Figure 6.
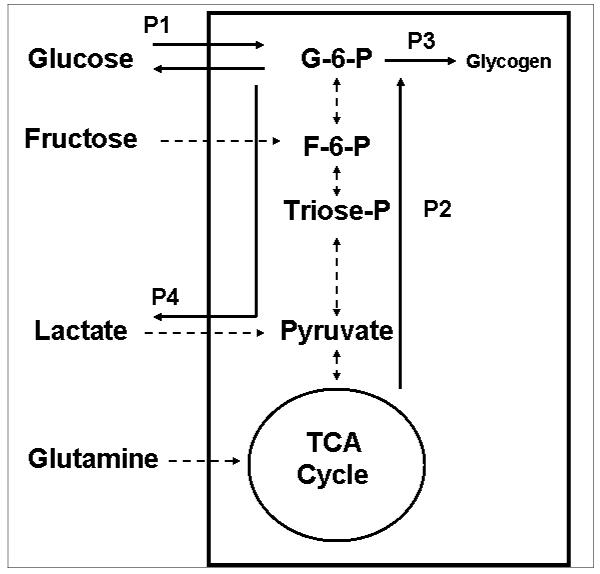
Glucose metabolic network in hepatocytes. The glycolytic and gluconeogenic pathways of hepatocytes were studied by modifying the culture medium conditions, namely, glucose only, glucose + fructose, glucose + lactate and glucose + glutamine. The balance of flux analysis was carried out around glucose-6-phosphate [54]. The resultant extreme pathways are indicated as P1, P2, P3, and P4. The extreme pathways include many internal and external fluxes indicated by the broken arrows.
Figure 7a.
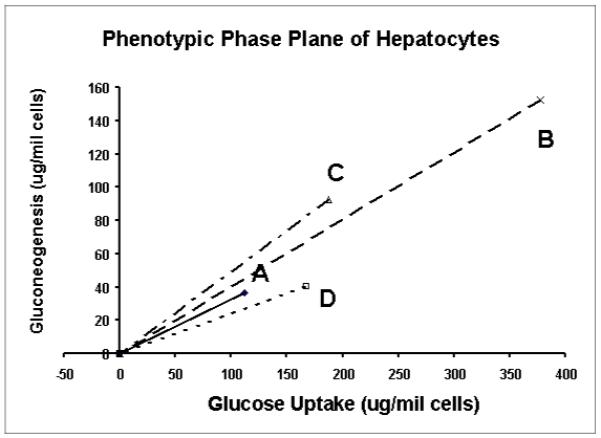
An example of the use of phenotypic phase plane analysis in a study of metabolic responses of isolated hepatocytes to substrate environment changes (data are from reference 54). Vector A represents the phenotype under glucose only medium, B, C, and D are phenotypes of cells with the addition of wither fructose, lactate or glutamine in the incubation medium respectively. In this and subsequent figures, the symbol Δ stands for the condition of added lactate, x for the condition of added fructose, □ for the condition of added glutamine, and ◇ for the control (glucose only condition).
Figure 7b.
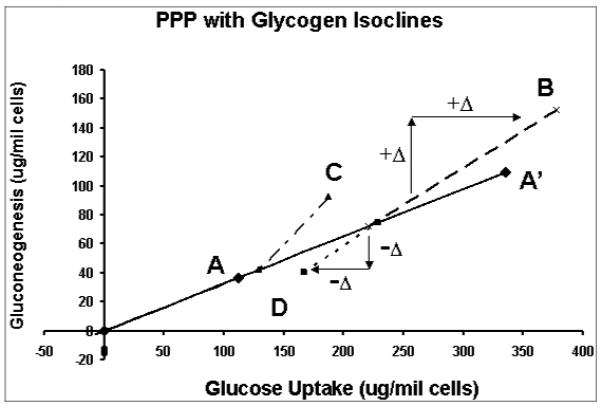
Quantitative comparison of metabolic responses of isolated hepatocytes using glycogen isoclines. The quantities of glycogen produced in the hepatocytes under the different conditions are scaled onto the control vector to construct the isoclines.
Figure 7c.
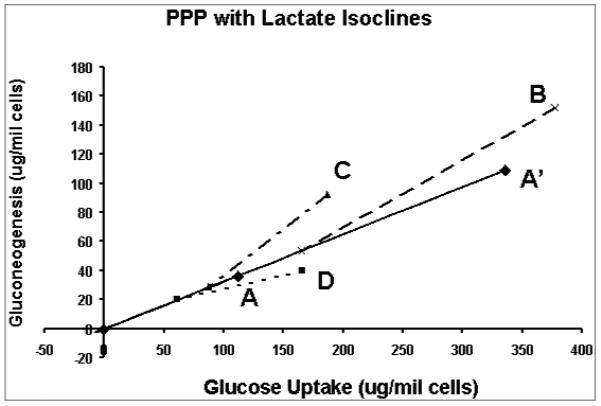
Quantitative comparison of metabolic responses of isolated hepatocytes using lactate isoclines. The quantities of lactate produced from the hepatocytes under the different conditions are scaled onto the control vector to construct the isoclines.
Vector A in Figure 7a represents the glucose uptake (P1) and gluconeogenesis (P2) of hepatocytes treated with glucose only (control phenotype) which divides the phenotypic phase plane into two regions. The region above vector A contains all phenotypes that have relative excess of gluconeogenesis or relative deficiency of glucose uptake in comparison with the control phenotype. Vice versa, the region below vector A represents phenotypes with relative excess of glucose uptake. The (P1, P2) phenotypes in response to fructose, lactate and glutamine are represented by the vectors B, C and D respectively. The phenotypes in response to treatment with fructose (B) and lactate (C) lie above vector A (control phenotype), indicating excess gluconeogenesis relative to glucose uptake. On the other hand, the phenotype of glutamine treatment lies below vector A indicating deficient gluconeogenesis relative to glucose uptake compared to the control. The relationship of these phenotypes to glycogen synthesis is shown in Figure 7b where the quantities of glycogen synthesized (P3) under the various conditions are scaled onto the vector representing the control phenotype to form the glycogen axis. The lines connecting the points of the phenotypes to the points representing the relative amounts of glycogen synthesized on the control vector are the isoclines. The slope of an isocline provides the quantitative relationship between changes in glucose uptake and gluconeogenesis as compared to the control for the production of the same quantity of glycogen. For example, phenotypes B and C have increased gluconeogenesis and glucose uptake, which are not used for glycogen synthesis, while phenotype D has decrease both in glucose uptake and increased gluconeogenesis from lactate compared to control phenotype for the same amount of glycogen synthesized. From the glycogen isoclines, one can draw the conclusion that increased glycogen synthesis is due to increased glucose uptake and gluconeogenesis in varying proportions. The phenotypic phase plane with lactate (P4) isoclines is shown in Fig 7c, which summarizes differences in glucose uptake and gluconeogenesis relative to lactate production. These isoclines also show that there are other products that are produced when medium is supplemented with glutamine, lactate or fructose. In the experiment cited, glucose efflux and glycolysis were the major pathways in response to changes in the incubation medium beside glycogen synthesis. Thus application of phenotypic phase plane analysis to tracer-based metabolic data allows qualitative and quantitative comparison of metabolic phenotypes and their changes in response to substrate environment changes, or alteration of metabolic pathways due to enzyme inhibitors or signaling pathways.
The use of stable isotopes introduces 13C label into a large array of metabolic intermediates, and the quantitation of the respective isotopomers potentially generates an equally large dataset for analysis of metabolic phenotype. Such data set can be presented as a heat-map such as the SIDMAP® array [55, 56], which is a powerful tool in displaying differences in drug activities. It is clear that the data contained in a SIDMAP® array can be used in a pair-wise fashion to construct multiple phenotypic phase planes. By expanding the number of phenotypic phase plane analyses, specific differences of drug metabolism can be demonstrated.
Currently, the glucose metabolic network which includes pathways of glycolysis/gluconeogenesis, pentose cycle, TCA cycle linking with energy metabolism, has been the main focus for tracer-based metabolomics. However, the concepts and analytical methodology of tracer-based metabolomics can also be applied to studies of many other metabolic systems such as essential amino acids, essential fatty acids and nucleic acids. Labeling methodology for such studies remains to be further developed and validated.
Concluding remarks
Metabolomics, proteomics, and transcriptomics are technology-driven profiling approaches that provide method dependent4 “quantitative” data. Metabolomics (metabolite profiling), just as other profiling –omics, is a systems biology approach, where the system is defined by the collection of elements (metabolites) sampled and its biological relevance is defined by the correlations of the individual components. The results are analyzed using principal component analysis (PCA) or partial least square regression analysis (PLSA) to draw conclusion on association of metabolite components with variations in phenotypes. Unlike other -omics, tracer-based metabolomics is a quantitative tool for the analysis of metabolic phenotype. It differs from the traditional metabolomics in several respects: 1) In tracer-based metabolomics, the system is defined by the collection of metabolites that are linked by 13C distribution through metabolic pathways that transfer the 13C carbon from precursors to specific end products. 2) The relevant biochemical pathways of a living cell are the processes that distribute 13C label among metabolites. 3) In addition to the metabolic pathways linked by 13C labeled metabolites, the system is defined by a cellular boundary which allows the definition of “extreme pathways”. 4) The concentrations of the unlabeled compounds constitute the complementary domain of the system. The cellular (system) boundary further separates metabolites belonging to the cell (finger print) and metabolites belonging to the environment (foot print). Traditional metabolite profiling and tracer-based metabolomics are complementary to each other, and the combined data should describe completely the interaction between the cellular metabolic network with its nutrient environment. Even though the use of labeled precursors is common to flux analysis and tracer-based metabolomics in the determination of fluxes of individual reactions, tracer-based metabolomics differs from fluxomics [57-59] in that ‘extreme pathways” that represent inputs and outputs from the cell are emphasized. As demonstrated in preceding paragraphs, the determinations of these “extreme pathways” have implications on the operation of the system in both qualitative and quantitative terms. Isotopomers of metabolites form the database of tracer-based metabolomics which can be organized as a one-dimensional array. The individual data points can be analyzed pair-wise in phenotypic phase plane analysis giving rise to a high dimension phenotypic characterization of quantitative metabolic phenotypes. For n number of unique isotopomers, there can be (n)(n-1)(n-2)/3! number of phenotypic phase planes (including isocline analysis)5. Tracer-based metabolomics potentially can quantitatively distinguish a large number of metabolic phenotypes of cells in response to nutrient environment changes.
In the post-genomic era, the search for molecular mechanisms of cell proliferation, differentiation and apoptosis, and small molecules that either inhibit or activate the mechanisms has been the main focus of biomedical research. It is clear that these molecular mechanisms and small molecules are parts of the cellular metabolic network [60, 61]. The workings of these mechanisms and small molecules are constrained by their sharing enzymes, substrates and co-factors with other reactions of the network. Thus, the network of metabolic enzymes within a cell regulates its response to nutrient environment changes through a network of constrained pathways. Additionally, these constrained pathways are subject to modification by external signals through a series of kinases and phosphatases and other post-translational modifications, which are also parts of a larger system of constrained pathways. Further metabolic adaptation in cells can be effected through gene expressions leading to cell differentiation and a new integrated network of metabolic, translational, post-translational and transcriptional pathways. Therefore, the responses in cellular metabolism to nutrient environment or cell signaling changes are important factors that determine the phenotype of cells in cell proliferation, differentiation and apoptosis [62]. For such a complex biological system, constraint-based modeling provides the theoretical basis for metabolic regulation, and tracer-based metabolomics, the experimental approach to the study of metabolic phenotype of cells in response to environmental changes. Tracer-based metabolomics and phenotypic phase plane analysis is therefore an important tool that has many applications yet to be explored in future biomedical research.
Acknowledgements
Supported by the Biomedical Mass Spectrometry Laboratory of the GCRC (PHS M01-RR00425) and the Metabolomics Core Laboratory of the UCLA Center of Excellence in Pancreatic Diseases (P01 AT003960).
Footnotes
Publisher's Disclaimer: This is a PDF file of an unedited manuscript that has been accepted for publication. As a service to our customers we are providing this early version of the manuscript. The manuscript will undergo copyediting, typesetting, and review of the resulting proof before it is published in its final citable form. Please note that during the production process errors may be discovered which could affect the content, and all legal disclaimers that apply to the journal pertain.
m0, m1, and m2 or m+0, m+1 or m+2 are notations for molecules with 0, 1, 2, … number of 13C or 2H substitutions.
For in silico modeling of bacterial metabolic network, an objective function is required for solving an underdetermined set of equations, and the result is the vector known as the “line of optimality (LO)”. The objective function is often arbitrary and the resultant LO depends on the choice of the objective function. In tracer-based metabolomics, the observed “extreme pathways” are determined experimentally and represent optimal solution for the metabolic system in the context of its nutrient environment.
Line of optimality (LO) is the observed relationship between the two extreme pathways in the “control” cell. The “control” phenotype lies on the LO. If one assumes that the system’s function is to maximized pentose synthesis as in cell proliferation, the LO can be scaled according to observed pentose synthesis (P1+ P2).
Except in cases where isotope recovery standards are used, the results are dependent on ionization efficiency, matrix effect and sample recovery of the individual components.
n(n-1)(n-2)/3! is the formula to calculate the number of combinations from choosing 3 objects out of a total of n objects without repetition.
References
- [1].Lindon JC, Nicholson JK, Holmes E, Antti H, Bollard ME, Keun H, Beckonert O, Ebbels TM, Reily MD, Robertson D, Stevens GJ, Luke P, Breau AP, Cantor GH, Bible RH, Niederhauser U, Senn H, Schlotterbeck G, Sidelmann UG, Laursen SM, Tymiak A, Car BD, Lehman-McKeeman L, Colet JM, Loukaci A, Thomas C. Contemporary Issues in Toxicology The Role of Metabonomics in Toxicology and Its Evaluation by The COMET Project. Toxicol Appl Pharmacol. 2003;187:137–146. doi: 10.1016/s0041-008x(02)00079-0. [DOI] [PubMed] [Google Scholar]
- [2].Lindon JC, Keun HC, Ebbels TM, Pearce JM, Holmes E, Nicholson JK. The Consortium for Metabonomic Toxicology (COMET): Aims, Activities and Achievements. Pharmacogenomics. 2005;6:691–699. doi: 10.2217/14622416.6.7.691. [DOI] [PubMed] [Google Scholar]
- [3].Nicholson JK, Connelly J, Lindon JC, Holmes E. Metabonomics: A Platform For Studying Drug Toxicity and Gene Function. Nat Rev Drug Discov. 2002;1:153–161. doi: 10.1038/nrd728. [DOI] [PubMed] [Google Scholar]
- [4].Raamsdonk LM, Teusink B, Broadhurst D, Zhang N, Hayes A, Walsh MC, Berden JA, Brindle KM, Kell DB, Rowland JJ, Westerhoff HV, van Dam K, Oliver SG. A Functional Genomics Strategy That Uses Metabolome Data to Reveal The Phenotype of Silent Mutations. Nat. Biotechnol. 2001;19:45–50. doi: 10.1038/83496. [DOI] [PubMed] [Google Scholar]
- [5].Dettmer K, Aronov PA, Hammock BD. Mass Spectrometry-Based Metabolomics. Mass Spectrom Rev. 2007;26:51–78. doi: 10.1002/mas.20108. [DOI] [PMC free article] [PubMed] [Google Scholar]
- [6].Hollywood K, Brison DR, Goodacre R. Metabolomics: Current Technologies and Future Trends. Proteomics. 2006;6:4716–4723. doi: 10.1002/pmic.200600106. [DOI] [PubMed] [Google Scholar]
- [7].Wishart DS, Knox C, Guo AC, Eisner R, Young N, Gautam B, Hau DD, Psychogios N, Dong E, Bouatra S, Mandal R, Sinelnikov I, Xia J, Jia L, Cruz JA, Lim E, Sobsey CA, Shrivastava S, Huang P, Liu P, Fang L, Peng J, Fradette R, Cheng D, Tzur D, Clements M, Lewis A, De Souza A, Zuniga A, Dawe M, Xiong Y, Clive D, Greiner R, Nazyrova A, Shaykhutdinov R, Li L, Vogel HJ, Forsythe I. HMDB: A Knowledgebase For The Human Metabolome. Nucleic Acids Res. 2009;37:D603–610. doi: 10.1093/nar/gkn810. Database issue. [DOI] [PMC free article] [PubMed] [Google Scholar]
- [8].Gomase VS, Changbhale SS, Patil SA, Kale KV. Metabolomics. Current Drug Metabolism. 2008;9:89–98. doi: 10.2174/138920008783331149. [DOI] [PubMed] [Google Scholar]
- [9].Kell DB. Systems Biology, Metabolic Modelling and Metabolomics in Drug Discovery and Development. Drug Discov Today. 2006;11:1085–1092. doi: 10.1016/j.drudis.2006.10.004. [DOI] [PubMed] [Google Scholar]
- [10].Go EP. Database Resources in Metabolomics: An Overview. J Neuroimmune Pharmacol. 2010;5:18–30. doi: 10.1007/s11481-009-9157-3. [DOI] [PubMed] [Google Scholar]
- [11].Griffiths WJ, Wang Y. Mass spectrometry: From Proteomics to Metabolomics and Lipidomics. Chem Soc Rev. 2009;38:1882–1896. doi: 10.1039/b618553n. [DOI] [PubMed] [Google Scholar]
- [12].Katajamaa M, Oresic M. Data Processing for Mass Spectrometry-Based Metabolomics. J Chromatogr A. 2007;1158:318–328. doi: 10.1016/j.chroma.2007.04.021. [DOI] [PubMed] [Google Scholar]
- [13].Lindon JC, Holmes E, Nicholson JK. Metabonomics Techniques and Applications to Pharmaceutical Research and Development. Pharm Res. 2006;23:1075–1088. doi: 10.1007/s11095-006-0025-z. [DOI] [PubMed] [Google Scholar]
- [14].Wishart DS. Current Progress in Computational Metabolomics. Brief Bioinform. 2007;8:279–293. doi: 10.1093/bib/bbm030. [DOI] [PubMed] [Google Scholar]
- [15].Lee WN, Go VL. Nutrient-Gene Interaction: Tracer-Based Metabolomics. J Nutr. 2005;135:3027S–3032S. doi: 10.1093/jn/135.12.3027S. [DOI] [PubMed] [Google Scholar]
- [16].Lee WN. Characterizing Metabolic Phenotype Using Tracer-Based Metabolomics. Metabolomics. 2006;2:31–39. doi: 10.1007/s11306-006-0017-3. [DOI] [PMC free article] [PubMed] [Google Scholar]
- [17].Maguire G, Boros LG, Lee P. Development of Tracer-Based Metabolomics and Its Implications for The Pharmaceutical Industry. Int J Pharm Med. 2007;21:217–224. [Google Scholar]
- [18].Boros LG, Cascante M, Go VLW, Heber D, Hidvégi M, Lee WNP. Metabolic Profiling of Cell Growth and Death in Cancer: Applications In Drug Discovery. Drug Discovery Today. 2002;7:366–374. doi: 10.1016/s1359-6446(02)02179-7. [DOI] [PubMed] [Google Scholar]
- [19].Wolfe RR. Radioactive and Stable Isotope Tracers in Medicine. Wiley-Liss; New York: 1992. pp. 377–416. [Google Scholar]
- [20].Hellerstein MK, Neese RA. Mass Isotopomer Distribution Analysis at Eight Years: Theoretical, Analytic, and Experimental Considerations. Am J Physiol. 1999;276:E1146–E1170. doi: 10.1152/ajpendo.1999.276.6.E1146. [DOI] [PubMed] [Google Scholar]
- [21].Katz J, Grunnet N. Estimation of Metabolic Pathways in Steady State In Vitro. Rates of Tricarboxylic Acid and Pentose Cycles. In: Kornberg HL, editor. Techniques in Metabolic Research. Elsevier; Amsterdam: 1979. pp. 1–18. [Google Scholar]
- [22].Katz J, McGarry JD. The Glucose Paradox: Is Glucose a Substrate for Liver Metabolism? J. Clin. Invest. 1984;74:1901–1909. doi: 10.1172/JCI111610. [DOI] [PMC free article] [PubMed] [Google Scholar]
- [23].Katz J, Lee WP. The Application of Mass Isotopomer Analysis in The Determination of Pathways of Glycogen Synthesis. Am. J. Physiol. 1991;259:E757–E762. doi: 10.1152/ajpendo.1991.261.3.E332. [DOI] [PubMed] [Google Scholar]
- [24].Lee WNP, Boros LG, Puigjaner J, Bassilian S, Lim S, Cascante M. Investigation of The Pentose Cycle Using [1, 2-13C2]-Glucose and Mass Isotopomer Analysis: Estimation of Transketolase and Transaldolase Activities. Am. J. Physiol. 1998;274:E843–E851. doi: 10.1152/ajpendo.1998.274.5.E843. [DOI] [PubMed] [Google Scholar]
- [25].Katz J, Lee WNP, Wals PA, Bergner EA. Studies of Glycogen Synthesis and the Krebs Cycle by Mass Isotopomer Analysis with U-13C-Glucose in Rats. J. Biol. Chem. 1989;264:12994–13001. [PubMed] [Google Scholar]
- [26].Katz J, Wals PA, Lee WP. Determination of Pathways of Glycogen Synthesis and Dilution of the 3-Carbon Pool with [U-13C6]-Glucose. Proc. Natl. Acad. Sci. 1991;88:2103–2107. doi: 10.1073/pnas.88.6.2103. [DOI] [PMC free article] [PubMed] [Google Scholar]
- [27].Katz J, Wals PA, Lee WP. Isotopomer Studies of Gluconeogenesis and the Krebs Cycle with 13C Labeled Lactate. J. Biol. Chem. 1993;268:25511–25521. [PubMed] [Google Scholar]
- [28].Lee WNP. Appendix: Analysis of Tricarboxylic Acid Cycle Using Mass Isotopomer Ratios. J. Biol. Chem. 1993;268:25522–25526. [PubMed] [Google Scholar]
- [29].Lee WP, Edmond J, Bassilian S, Morrow J. Mass Isotopomer Study of Glutamine Oxidation and Synthesis in Primary Culture of Astrocytes. Develop. Neurosci. 1996;18:469–477. doi: 10.1159/000111442. [DOI] [PubMed] [Google Scholar]
- [30].Fu TF, Rife JP, Schirch V. The Role of Serine Hydroxymethyltransferase Isozymes in One-Carbon Metabolism in MCF-7 Cells as Determined by (13)C NMR. Arch Biochem Biophys. 2001;393:42–50. doi: 10.1006/abbi.2001.2471. [DOI] [PubMed] [Google Scholar]
- [31].Solà A, Maaheimo H, Ylönen K, Ferrer P, Szyperski T. Amino Acid Biosynthesis and Metabolic Flux Profiling of Pichia Pastoris. Eur J Biochem. 2004;271:2462–2470. doi: 10.1111/j.1432-1033.2004.04176.x. [DOI] [PubMed] [Google Scholar]
- [32].Maaheimo H, Fiaux J, Cakar ZP, Bailey JE, Sauer U, Szyperski T. Central Carbon Metabolism of Saccharomyces Cerevisiae Explored by Biosynthetic Fractional (13)C Labeling of Common Amino Acids. Eur J Biochem. 2001;268:2464–2479. doi: 10.1046/j.1432-1327.2001.02126.x. [DOI] [PubMed] [Google Scholar]
- [33].Lee WNP, Bassilian S, Guo ZK, Schoeller DA, Edmond J, Bergner EA, Byerley LO. Measurement of Fatty Acids and Cholesterol Synthesis Rates Using Deuterated Water (D2O) and Mass Isotopomer Analysis. Am. J. Physiol. 1994;266:E372–E383. doi: 10.1152/ajpendo.1994.266.3.E372. [DOI] [PubMed] [Google Scholar]
- [34].Lee WNP, Bassilian S, Ajie H, Schoeller DA, Edmond J, Bergner EA, Byerley LO. In Vivo Measurement of Fatty Acids and Cholesterol Synthesis Using Deuterated Water (D2O) and Mass Isotopomer Analysis. Am. J. Physiol. 1994;266:E699–E708. doi: 10.1152/ajpendo.1994.266.5.E699. [DOI] [PubMed] [Google Scholar]
- [35].Ajie HO, Connor MJ, Lee WNP, Bassilian S, Bergner EA, Byerley LO. In Vivo Study of the Biosynthesis of Long Chain Fatty Acids (LCFA) Using Deuterated Water (D2O) Am. J. Physiol. 1995;269:E247–E252. doi: 10.1152/ajpendo.1995.269.2.E247. [DOI] [PubMed] [Google Scholar]
- [36].Wong DA, Bassilian S, Lim S, Paul Lee WN. Coordination of Peroxisomal Beta-Oxidation and Fatty Acid Elongation in HepG2 Cells. J Biol Chem. 2004;279:41302–41309. doi: 10.1074/jbc.M406766200. [DOI] [PubMed] [Google Scholar]
- [37].Edmond J, Higa TA, Korsak RA, Bergner EA, Lee WNP. Fatty Acid Transport and Utilization for the Developing Brain. J Neurochem. 1998;70:1227–1234. doi: 10.1046/j.1471-4159.1998.70031227.x. [DOI] [PubMed] [Google Scholar]
- [38].Lee WNP, Guo ZK, Bergner EA. Mass Isotopomer Pattern and Precursor-Product Relationship. Biol. Mass Spectrom. 1992;21:114–122. doi: 10.1002/bms.1200210210. [DOI] [PubMed] [Google Scholar]
- [39].Des Rosiers C, Landau BR, Brunengraber H. Interpretation of Isotopomer Patterns in Tracing Glycogen Synthesis and Glucose Recycling Using [13C6]Glucose. Am J Physiol. 1990;259:E757–E762. doi: 10.1152/ajpendo.1990.259.5.E757. [DOI] [PubMed] [Google Scholar]
- [40].Lee WNP, Byerley LO, Bergner EA, Edmond J. Mass Isotopomer Analysis: Theoretical and Practical Considerations. Biol. Mass Spectrom. 1991;20:451–458. doi: 10.1002/bms.1200200804. [DOI] [PubMed] [Google Scholar]
- [41].Schilling CH, Palsson BO. The Underlying Pathway Structure of Biochemical Reaction Networks. Proc Natl Acad Sci. 1998;95:4193–4198. doi: 10.1073/pnas.95.8.4193. [DOI] [PMC free article] [PubMed] [Google Scholar]
- [42].Schilling CH, Schuster S, Palsson BO, Heinrich R. Metabolic Pathway Analysis: Basic Concepts and Scientific Applications in the Post-Genomic Era. Biotechnol Prog. 1999;15:296–303. doi: 10.1021/bp990048k. [DOI] [PubMed] [Google Scholar]
- [43].Schilling CH, Letscher D, Palsson BO. Theory for the Systemic Definition of Metabolic Pathways and Their Use in Interpreting Metabolic Function From a Pathway-Oriented Perspective. J Theor Biol. 2000;203:229–248. doi: 10.1006/jtbi.2000.1073. [DOI] [PubMed] [Google Scholar]
- [44].Price ND, Papin JA, Schilling CH, Palsson BO. Genome-Scale Microbial In Silico Models: The Constraints-Based Approach. Trends Biotechnol. 2003;21:162–169. doi: 10.1016/S0167-7799(03)00030-1. [DOI] [PubMed] [Google Scholar]
- [45].Papin JA, Price ND, Palsson BO. Extreme Pathway Lengths and Reaction Participation in Genome-Scale Metabolic Networks. Genome Res. 2002;12:1889–1900. doi: 10.1101/gr.327702. [DOI] [PMC free article] [PubMed] [Google Scholar]
- [46].Papin JA, Price ND, Wiback SJ, Fell DA, Palsson BO. Metabolic Pathways in the Post-Genome Era. Trends Biochem Sci. 2003;28:250–258. doi: 10.1016/S0968-0004(03)00064-1. [DOI] [PubMed] [Google Scholar]
- [47].Edwards JS, Ramakrishna R, Palsson BO. Characterizing the Metabolic Phenotype: a Phenotype Phase Plane Analysis. Biotechnol Bioeng. 2002;77:27–36. doi: 10.1002/bit.10047. [DOI] [PubMed] [Google Scholar]
- [48].Huang X, Regnier FE. Differential Metabolomics Using Stable Isotope Labeling and Two-Dimensional Gas Chromatography With Time-of-Flight Mass Spectrometry. Anal Chem. 2008;80:107–114. doi: 10.1021/ac071263f. [DOI] [PubMed] [Google Scholar]
- [49].Schilling CH, Edwards JS, Letscher D, Palsson BO. Combining Pathway Analysis With Flux Balance Analysis for the Comprehensive Study of Metabolic Systems. Biotechnol Bioeng. 2000-2001;71:286–306. [PubMed] [Google Scholar]
- [50].Boros LG, Steinkamp MP, Fleming JC, Lee WNP, Neufeld EJ. Defective RNA Ribose Synthesis in Thiamine-Responsive Megaloblastic Anemia (TRMA): Mechanism for the Syndrome. Blood. 2003;102:3556–3561. doi: 10.1182/blood-2003-05-1537. [DOI] [PubMed] [Google Scholar]
- [51].Vizan P, Boros LG, Figuerasy A, Capellay G, Bassilian S, Lim S, Lee WNP, Cascante M. K-Ras Codon-Specific Mutations Produce Distinctive Metabolic Phenotypes in NIH3T3 Fibroblasts. Cancer Res. 2005;65:5512–5515. doi: 10.1158/0008-5472.CAN-05-0074. [DOI] [PubMed] [Google Scholar]
- [52].Boros LG, Torday JS, Lim S, Bassilian S, Cascante M, Veech RL, Lee WNP. TGF-β2 Promotes Glucose Carbon Incorporation Into Nucleic Acid Ribose Through the Nonoxidative Pentose Cycle in Lung Epithelial Carcinoma Cells. Cancer Research. 2000;60:1183–1185. [PubMed] [Google Scholar]
- [53].Ramos-Montoya A, Lee WN, Bassilian S, Lim S, Trebukhina RV, Kazhyna MV, Ciudad CJ, Noé V, Centelles JJ, Cascante M. Pentose Phosphate Cycle Oxidative and Nonoxidative Balance: A New Vulnerable Target for Overcoming Drug Resistance in Cancer. Int J Cancer. 2006;119:2733–2741. doi: 10.1002/ijc.22227. [DOI] [PubMed] [Google Scholar]
- [54].Marin S, Lee WNP, Bassilian S, Ahmed S, Boros LG, Centelles J, Fernandez JM, Cascante M. Dynamic Profiling of the Glucose Metabolic Network in Fasted Rat Hepatocytes Using [1,2-13C2]Glucose. Biochem J. 2004;381:287–294. doi: 10.1042/BJ20031737. [DOI] [PMC free article] [PubMed] [Google Scholar]
- [55].Boros LG, Serkova NJ, Cascante MS, Lee WNP. Use of Metabolic Pathway Flux Information in Targeted Cancer Drug Design. Drug Discovery Today: Therapeutic Strategies. 2004;1:435–443. [Google Scholar]
- [56].Harrigan GG, Colca J, Szalma S, Boros LG. PNU-91325 Increases Fatty Acid Synthesis From Glucose and Mitochondrial Long Chain Fatty Acid Degradation: A Comparative Tracer-Based Metabolomics Study with Rosiglitazone and Pioglitazone in HepG2 Cells. Metabolomics. 2006;2:21–29. doi: 10.1007/s11306-006-0015-5. [DOI] [PMC free article] [PubMed] [Google Scholar]
- [57].Selivanov VA, Puigjaner J, Sillero A, Centelles JJ, Ramos-Montoya A, Lee PW, Cascante M. An Optimized Algorithm for Flux Estimation From Isotopomer Distribution in Glucose Metabolites. Bioinformatics. 2004;20:3387–3397. doi: 10.1093/bioinformatics/bth412. [DOI] [PubMed] [Google Scholar]
- [58].Selivanov VA, Meshalkina LE, Solovjeva ON, Kuchel PW, Ramos-Montoya A, Kochetov GA, Lee PW, Cascante M. Rapid Simulation and Analysis of Isotopomer Distributions Using Constraints Based on Enzyme Mechanisms: An Example From HT29 Cancer Cells. Bioinformatics. 2005;21:3558–3564. doi: 10.1093/bioinformatics/bti573. [DOI] [PubMed] [Google Scholar]
- [59].Selivanov VA, Marin S, Lee PW, Cascante M. Software for Dynamic Analysis of Tracer-Based Metabolomic Data: Estimation of Metabolic Fluxes and Their Statistical Analysis. Bioinformatics. 2006;22:2806–2812. doi: 10.1093/bioinformatics/btl484. [DOI] [PubMed] [Google Scholar]
- [60].Zhang H, Cao R, Lee WN, Deng C, Zhao Y, Lappe J, Recker R, Yen Y, Wang Q, Tsai MY, Go VL, Xiao GG. Inhibition of Protein Phosphorylation in MIA Pancreatic Cancer Cells: Confluence of Metabolic and Signaling Pathways. J Proteome Res. 2010;9:980–989. doi: 10.1021/pr9008805. [DOI] [PMC free article] [PubMed] [Google Scholar]
- [61].Alcarraz-Vizán G, Boren J, Lee WN, Cascante M. Histone deacetylase inhibition results in a common metabolic profile associated with HT29 differentiation. Metabolomics. 2010:229–237. doi: 10.1007/s11306-009-0192-0. [DOI] [PMC free article] [PubMed] [Google Scholar]
- [62].Boros LG, Lee WNP, Go VLW. A Metabolic Hypothesis of Cell Growth and Death in Pancreatic Cancer. Pancreas. 2002;24:26–33. doi: 10.1097/00006676-200201000-00004. [DOI] [PubMed] [Google Scholar]