

Abstract
Lactococcus lactis NZ9000 and its parent MG1363 are the most commonly used lactic acid bacteria for expression and physiological studies. We noted unexpected but significant differences in the growth behaviors of both strains. We sequenced the entire genomes of the original NZ9000 and MG1363 strains using an ultradeep sequencing strategy. The analysis of the L. lactis NZ9000 genome yielded 79 differences, mostly point mutations, with the annotated genome sequence of L. lactis MG1363. Resequencing of the MG1363 strain revealed that 73 out of the 79 differences were due to errors in the published sequence. Comparative transcriptomic studies revealed several differences in the regulation of genes involved in sugar fermentation, which can be explained by two specific mutations in a region of the ptcC promoter with a key role in the regulation of cellobiose and glucose uptake.
The mesophilic homofermentative bacterium Lactococcus lactis is an important industrial microorganism, which has GRAS (generally regarded as safe) status. In addition to its traditional use in food fermentations, this Gram-positive lactic acid bacterium (LAB) is increasingly being used in modern biotechnological applications. Its economical importance has prompted the development of genetic engineering tools and molecular characterization of the organism (9, 12, 15, 24). The availability of technology for genetic and metabolic engineering of L. lactis combined with a long history of safe usage opened a range of new opportunities for applications even beyond the food industry. L. lactis was also recently used as the first living genetically modified organism for the treatment of a human disease (4).
A number of genome sequences of L. lactis strains are available, including strains from L. lactis subsp. lactis, such as IL1403 (3) and KF147 (28), as well as strains from L. lactis subsp. cremoris, such as MG1363 (33) and SK11 (22). L. lactis subsp. cremoris MG1363 is the international prototype for LAB genetics; it is a plasmid-free progeny of the dairy starter strain NCDO712 (8). A derivative of MG1363 was created by the integration of the nisRK genes (involving the “NICE” system for nisin-controlled protein overexpression) into the pepN gene, yielding L. lactis NZ9000 (14). Since then, L. lactis NZ9000 has been distributed to laboratories and strain collections worldwide and has become the “laboratory workhorse” for expression and various types of physiological studies (1, 16, 18, 23). We and others have noted physiological differences between L. lactis strains MG1363 and NZ9000, which were not anticipated and which prompted us to (re)sequence both strains. Here, we present the revised genome sequence of L. lactis MG1363, the first genome sequence of L. lactis NZ9000, and comparative transcriptomics and growth studies.
MATERIALS AND METHODS
Bacterial strains and growth conditions.
L. lactis strains NZ9000 and MG1363 were grown as standing cultures at 30°C in M17 medium (Oxoid, Basingstoke, United Kingdom) or in chemically defined medium (CDM) (27), both supplemented with 1% (wt/vol) glucose unless stated otherwise. To estimate the maximum specific growth rate (μmax) and other growth parameters, cultures of 200 μl were grown for 48 h at 30°C in 96-well microtiter plates and monitored with a PowerWave microplate spectrophotometer (BioTek Instruments). Next, the growth curves were analyzed with the Gompertz model (34).
Genome sequencing and data analysis.
Genomic DNA was purified by using the Qiagen genomic DNA purification kit (Qiagen Ltd., Crawley, United Kingdom). Shotgun DNA libraries were generated according to the manufacturer's sample preparation protocol for genomic DNA. Briefly, 1 to 5 μg of genomic DNA was randomly sheared by using a nebulizer (Invitrogen, Carlsbad, CA), and the ends were repaired by using polynucleotide kinase and Klenow enzyme. The 5′ ends of the DNA fragments were phosphorylated, and a single adenine base was added to the 3′ ends using Klenow Exo+ (Illumina, San Diego, CA). Following the ligation of a pair of Illumina adaptors to the repaired ends, the DNA was amplified in 10 cycles using adaptor primers (Illumina, San Diego, CA), and fragments of around 250 bp were isolated from an agarose gel. Sequencing libraries were quantified with a Bio-Rad Experion analyzer using a 12K DNA kit (Bio-Rad, Hercules, CA) as well as the Picogreen fluorescence assay (Invitrogen, Carlsbad, CA). Cluster generations were performed on an Illumina cluster station using 4 pmol of sequencing libraries. A total of 76 cycles of sequencing were carried out by using the Illumina Genome Analyzer II system according to the manufacturer's specifications. Sequence analysis was first done by using the Illumina analysis pipeline. The output of the Illumina analysis was fed into CLC Bio-Software. At the assembly stage, sequence reads were aligned to the previously assembled L. lactis MG1363 genome sequence (GenBank accession number AM406671).
DNA microarray experimental procedures.
DNA microarrays containing amplicons of 2,457 annotated genes in the genome of L. lactis subsp. cremoris MG1363 were designed and made as described previously (31). Samples used for RNA isolation were obtained from mid-exponential-phase cultures grown in M17 medium or CDM supplemented with glucose (GM17 and GCDM, respectively). Cell disruption, RNA isolation, RNA quality control, cDNA (target) synthesis, indirect labeling, and hybridization were performed as described previously (32). Dual-channel array images were acquired with a GeneTac LS IV confocal laser scanner (Genomics Solutions, Huntingdon, United Kingdom) and analyzed with ArrayPro 4.5 software (Media Cybernetics Inc., Bethesda, MD). Slide data were processed by using MicroPreP as described previously (10). Prior to the analysis, automatically and manually flagged spots and spots with very low background-subtracted signal intensities (5% of the weakest spots [sum of Cy3 and Cy5 net signals]) were filtered out. Net signal intensities were calculated by using grid-based background subtraction. In postprep, negative and empty values were eliminated, and outliers were removed by the deviation test. Differential expression tests were performed by using a Cyber-T Student's t test for paired data (19). A gene was considered differentially expressed when the P value was <0.001 and the false discovery rate was <0.05. Fold change cutoffs of 2 for the GCDM arrays and 1.5 for the GM17 arrays were applied.
Accession numbers.
The nucleotide sequence of the L. lactis NZ9000 strain described in this paper has been deposited in the GenBank database (accession number CP002094), and potential protein-coding genes were identified by the Prokaryotic Genomes Automatic Annotation Pipeline (PGAAP) of the National Center for Biotechnology Information. The microarray data have been deposited in the NCBI Gene Expression Omnibus (GEO) database (http://www.ncbi.nlm.nih.gov/geo/) under GEO series accession number GSE21759.
RESULTS
Ultradeep genome sequencing.
In this work, we sequenced L. lactis strain NZ9000 using the Illumina ultradeep sequencing technology (17, 21, 29) to obtain a 200-fold average coverage (standard deviation [SD], ∼60-fold) across the entire genome sequence. The reads were assembled and mapped onto the previously published L. lactis MG1363 reference sequence (33). A major genomic difference between strains NZ9000 and MG1363 is the deletion of 1,821 nucleotides of the pepN-napC locus due to the insertion of nisR-nisK (plus some flanking regions from nisP and nisF) by gene replacement. To the best of our knowledge, the exact sequence of the nisR-nisK insertion site has not been reported previously. In addition to this anticipated difference, we observed 79 single-nucleotide variations and/or deviations between strain NZ9000 and strain MG1363 (Table 1). The threshold for a reliable single-nucleotide polymorphism (SNP) in the primary sequence data was set to be a coverage of at least 100-fold and a minimum variant frequency of 0.9.
TABLE 1.
Single-nucleotide differences in L. lactis MG1363, revised relative to the previously published genomeb
| Reference positiona | Variation type | Nucleotide change | Region and/or gene or product | Amino acid change or frameshift | ORF |
|---|---|---|---|---|---|
| 26455 | SNP | T→C | Intergenic | ||
| 218270 | DIP | —→C | Gene CDS, hypothetical protein | Change frameshift | llmg_0227 |
| 311626 | SNP | T→C | Gene CDS, lmrC | Cys→Arg | llmg_0324 |
| 549522 | DIP | —→T | Intergenic | ||
| 589181 | DIP | —→C | Intergenic | ||
| 594325 | SNP | T→A | Gene CDS, recJ | Ile→Lys | llmg_0606 |
| 617310 | SNP | A→C | Gene CDS, divalent cation transport-related protein | Synonymous | llmg_0628 |
| 672541 | SNP | A→T | Gene CDS, hypothetical protein | Synonymous | llmg_0681 |
| 672705 | SNP | T→G | Intergenic | ||
| 674847 | DIP | A→— | Intergenic | ||
| 876869 | SNP | C→G | Gene CDS, amtB | His→Asp | llmg_0910 |
| 894625 | DIP | —→G | Gene CDS, hypothetical protein | Change frameshift | llmg_0924 |
| 912618 | SNP | T→A | Gene CDS, hypothetical protein | Leu→Gln | llmg_0944 |
| 912718 | SNP | T→A | Gene CDS, hypothetical protein | Asn→Lys | llmg_0944 |
| 977526 | DIP | C→— | Gene CDS, lplA | Change frameshift | llmg_1011 |
| 1007288 | SNP | C→T | Gene CDS, bglP | Synonymous | llmg_1045 |
| 1061785 | SNP | A→T | Gene CDS, putative secreted protein | Ile→Asn | llmg_1101 |
| 1093300 | DIP | —→C | Gene CDS, cell wall surface anchor family protein | Change frameshift | llmg_1127 |
| 1093563 | DIP | —→C | Gene CDS, hypothetical protein | Change frameshift | llmg_1128 |
| 1167414 | SNP | T→G | Intergenic | ||
| 1210279 | DIP | —→A | Pseudogene | llmg_pseudo_39 | |
| 1223555 | DIP | G→— | Intergenic | ||
| 1277684 | SNP | T→A | Gene CDS, hypothetical protein | Asn→Ile | llmg_1306 |
| 1492365 | SNP | T→A | Gene CDS, kinE | Synonymous | llmg_1518 |
| 1500910 | SNP | C→A | Gene CDS, hypothetical protein | Asp→Glu | llmg_1528 |
| 1532424 | SNP | G→C | Gene CDS, stress-induced DNA-binding protein | Pro→Arg | llmg_1560 |
| 1572256 | SNP | T→A | Intergenic | ||
| 1572258 | SNP | G→A | Intergenic | ||
| 1588193 | SNP | T→G | Gene CDS, ugd | Gln→Pro | llmg_1616 |
| 1588245 | SNP | T→A | Gene CDS, ugd | Thr→Ser | llmg_1616 |
| 1588246 | SNP | A→T | Gene CDS, ugd | Asn→Lys | llmg_1616 |
| 1588356 | SNP | T→A | Gene CDS, ugd | Asn→Tyr | llmg_1616 |
| 1610761 | SNP | T→C | Gene CDS, hypothetical protein | Ile→Val | llmg_1634 |
| 1614129 | DIP | —→T | Gene CDS, mleP | Change frameshift | llmg_1637 |
| 1660050 | DIP | —→T | Intergenic | ||
| 1681037 | SNP | T→C | Gene CDS, pepV | Glu→Gly | llmg_1706 |
| 1731090 | SNP | T→C | Gene CDS, hypothetical protein | Synonymous | llmg_1749 |
| 1826407 | SNP | A→G | Gene CDS, metal-dependent hydrolase | Synonymous | llmg_1845 |
| 1826460 | DIP | —→T | Intergenic | ||
| 1838903 | SNP | T→C | Gene CDS, rmaB | Thr→Ala | llmg_1860 |
| 1853472 | SNP | C→A | Gene CDS, glgP | Met→Ile | llmg_1871 |
| 1854998 | SNP | T→A | Gene CDS, glgA | Synonymous | llmg_1872 |
| 1891450 | SNP | C→A | Gene CDS, hypothetical protein | Trp→Leu | llmg_1911 |
| 1916379 | DIP | T→— | Pseudogene | llmg_pseudo_59 | |
| 1921434 | DIP | T→— | Gene CDS, hypothetical protein | Change frameshift | llmg_1941 |
| 1921461 | DIP | C→— | Gene CDS, hypothetical protein | Change frameshift | llmg_1941 |
| 1921473 | DIP | C→— | Gene CDS, hypothetical protein | Change frameshift | llmg_1941 |
| 1921516 | SNP | C→T | Intergenic | ||
| 1921529 | DIP | T→— | Intergenic | ||
| 1921636 | DIP | T→— | Intergenic | ||
| 1921651 | DIP | T→— | Intergenic | ||
| 1921655 | DIP | G→— | Intergenic | ||
| 1921664 | DIP | T→— | Intergenic | ||
| 1921674 | DIP | A→— | Intergenic | ||
| 1921680 | DIP | T→— | Intergenic | ||
| 1921693 | DIP | G→— | Intergenic | ||
| 1921702 | DIP | A→— | Intergenic | ||
| 1921707 | DIP | T→— | Intergenic | ||
| 1921717 | DIP | T→— | Intergenic | ||
| 1921724 | DIP | A→— | Intergenic | ||
| 1921743 | DIP | T→— | Intergenic | ||
| 1921753 | DIP | A→— | Intergenic | ||
| 1921776 | DIP | T→— | Intergenic | ||
| 1921788 | DIP | G→— | Intergenic | ||
| 1933214 | SNP | G→C | Gene CDS, atpB | Synonymous | llmg_1951 |
| 1933215 | SNP | C→G | Gene CDS, atpB | Gly→Ala | llmg_1951 |
| 1935399 | DIP | T→— | Pseudogene, comEC | llmg_pseudo_60 | |
| 1942432 | SNP | T→C | Gene CDS, hypothetical protein | Ile→Val | llmg_1960 |
| 1942730 | SNP | C→A | Intergenic | ||
| 2112671 | DIP | —→T | Intergenic | ||
| 2122554 | SNP | G→A | Gene CDS, cfa | Ser→Leu | llmg_2161 |
| 2122558 | SNP | C→T | Gene CDS, cfa | Ala→Thr | llmg_2161 |
| 2230258 | DIP | A→— | Gene CDS, hypothetical protein | Change frameshift | llmg_2272 |
Location is based on the previously published genome sequence of L. lactis MG1363 (GenBank accession number AM406671).
Abbreviations: SNP, single-nucleotide polymorphism; DIP, single-nucleotide indel; CDS, coding sequence; ORF, open reading frame; —, gap.
To determine whether these SNPs reflect true differences between the strains or possible sequencing errors, we resequenced the original MG1363 strain used previously by Wegmann and coworkers (33). Indeed, 73 out 79 differences turned out to be sequencing errors in the published genome sequence. Of the 73 alterations, 37 are SNPs and 36 are single-base indels (DIPs), randomly distributed over the chromosome. Twenty-four SNPs are transversions, and 13 SNPs are transitions. Globally, 30 differences are located in intergenic regions, 3 are located in pseudogenes, and 40 are located in coding regions (8 are synonymous substitutions, 22 cause an amino acid change, and 10 lead to frameshifts). The consequences of these frameshifts for the annotated sequence are as follows: three proteins have a C terminus that is shorter than originally described, and there are four fewer open reading frames (ORFs) due to the fact that consecutive annotated genes are combined in a unique ORF (llmg_0227 and llmg_0228; llmg_1011 and llmg_1012; and llmg_1127, llmg_1128, and llmg_1129). Three different single-nucleotide deletions were identified in the same gene (llmg_1941), resulting in frameshifts and consequently a (partly) wrong protein sequence.
Importantly, we identified six SNPs reflecting genuine differences between strains MG1363 and NZ9000; these SNPs were subsequently verified by PCR amplification of genomic DNA and dideoxy sequencing (Table 2). These nucleotide substitutions affect the following genes: gltX, aroD, pepF, ptcC, and groEL, all encoding basal functions of the cell. ptcC encodes the IIC component of the cellobiose-specific phosphotransferase system (PTS), involved in glucose and cellobiose transport and metabolism (5, 13). The chaperonin GroEL is an HSP60 family protein involved in the productive folding of proteins under stressful conditions (e.g., elevated temperatures) (6). The remaining three genes encode proteins related to amino acid metabolism. AroD is a type I 3-dehydroquinate dehydratase involved in aromatic amino acid biosynthesis, pepF encodes an M3B oligoendopeptidase F (11, 25), and GltX is a glutamyl-tRNA synthetase that charges glutamine to its corresponding tRNA during protein translation. The mutations may have appeared after the construction of strain NZ9000 by independent evolution. These differences were not observed for other sequenced strains of L. lactis, such as SK11 and IL1403.
TABLE 2.
Single-nucleotide mutations in L. lactis NZ9000 relative to L. lactis MG1363 and other sequenced L. lactis strains (IL1403 and SK11)
| Reference positiona | Gene | Nucleotide |
Coverageb | Frequency (%)c | |||
|---|---|---|---|---|---|---|---|
| MG1363 | NZ9000 | IL1403 | SK11 | ||||
| 404128 | groEL | T | G | T | T | 151 | 100 |
| 430174 | ptcC | C | T | C | C | 202 | 100 |
| 430179 | ptcC | T | G | T | T | 208 | 100 |
| 770829 | aroD | G | A | G | G | 200 | 100 |
| 1887895 | pepF | G | T | G | G | 205 | 99.51 |
| 2291986 | gltX | G | A | G | G | 237 | 99.58 |
Location is indicated as described in Table 1.
Coverage is the number of reads for a given position.
Frequency is the occurrence (percent) of the indicated nucleotide in NZ9000.
Global analysis of L. lactis MG1363 and NZ9000 transcriptomes.
To identify patterns of differential expression between L. lactis strains MG1363 and NZ9000, the transcription profiles of both strains were determined for cells grown in GM17 medium and GCDM. Samples used for RNA isolation were taken in the mid-exponential phase of growth (optical density [OD] at 600 nm [OD600] of 0.6); the data are presented in Table 3. Taking strain MG1363 as a reference, the downregulation of genes in strain NZ9000 occurred more frequently than did upregulation. To interpret the data more globally, the genes were grouped on the basis of the putative functions of the encoded proteins (30). Under both conditions, growth in GM17 medium and growth in GCDM, most of the affected genes were in the COG functional category “carbohydrate transport and metabolism.” Most significantly, a downregulation of the large cluster malR-mapA-agl-amyY-maa-dexA-dexC-malEFG in NZ9000 was observed. The corresponding proteins are involved in the breakdown of polysaccharides and starch (amylose and amylopectin) to glucose and maltose and the subsequent uptake (e.g., via the maltose transporter) and intracellular conversion by α-glucosidases and α-amylases. Other genes involved in starch degradation (glgP and apu, encoding glycogen phosphorylase and amylopullulanase, respectively) were also significantly downregulated in NZ9000 (both in GM17 medium and GCDM). Other carbon source-related genes that were downregulated in NZ9000 include the mtlARFD operon, involved in mannitol uptake (7), and the trehalose utilization operon of llmg_0454 and trePP. The genes for further downstream steps of carbohydrate utilization, such as pfk, pyk, ldh, and pgiA, and those for galactose (galPMKTE) and fructose metabolism (fruACR) were not differentially expressed.
TABLE 3.
Genes with significantly different expression profiles in L. lactis strains NZ9000 and MG1363 grown in GCDM or GM17 mediuma
| Functional category and gene | Fold change in expression |
||
|---|---|---|---|
| GCDM | GM17 | Global | |
| Carbohydrate transport and metabolism | |||
| Maltose, dextrose, and amylose | |||
| mapA | −75.73 | −32.52 | −49.63 |
| dexA | −57.91 | −16.42 | −30.83 |
| amyY | −58.69 | −13.23 | −27.87 |
| malE | −15.10 | −15.11 | −15.11 |
| agl | −29.56 | −4.67 | −11.75 |
| maa | −27.98 | −10.30 | |
| dexC | −17.36 | −6.02 | −10.23 |
| malF | −12.46 | −5.24 | −8.81 |
| malR | −2.10 | −4.31 | −3.01 |
| malG | −2.52 | −2.30 | |
| apu | −11.74 | −6.26 | |
| glgP | −10.67 | −5.27 | −6.99 |
| llmg_1868 | −4.77 | −3.46 | |
| Cellobiose PTS system | |||
| ptcA | −2.41 | −1.97 | −2.18 |
| ptcC | 49.84 | 13.25 | 25.69 |
| bglA | 41.68 | 21.03 | |
| Mannitol PTS system | |||
| mtlR | −55.37 | −16.32 | |
| mtlA | −14.34 | −16.08 | −15.31 |
| mtlF | −7.76 | ||
| mtlD | −5.53 | ||
| Trehalose metabolism | |||
| llmg_0454 | −2.53 | −2.19 | |
| trePP | −2.35 | −2.96 | |
| Other | |||
| msmK | −5.24 | −13.96 | −8.55 |
| Amino acid transport and metabolism | |||
| pepN | −32.40 | −8.65 | −16.74 |
| argG | −2.86 | ||
| argH | −2.54 | ||
| argE | −2.22 | ||
| argB | −2.17 | ||
| argF | −2.11 | ||
| gltS | −2.09 | ||
| Nucleotide metabolism | |||
| nrdH | 3.05 | 1.55 | 2.18 |
| nrdI | 3.04 | ||
| nrdE | 2.89 | 1.97 | 2.38 |
| nrdF | 2.69 | ||
| nrdG | 2.22 | ||
| nucA | 4.01 | ||
| napC | 12.81 | 5.62 | |
Ratios of the intensity of the respective gene spots on the microarray slides are indicated. Positive values indicate upregulation in NZ9000, and negative values indicate downregulation (relative to MG1363).
As anticipated from the genome sequences, differences in the expression of genes of the cellobiose-specific phosphoenolpyruvate (PEP)-dependent PTS were observed. Although ptcA was somewhat downregulated in NZ9000, the genes for the structural components of cellobiose transport and metabolism, ptcC and celA (bglA), were highly upregulated in NZ9000. Most likely, this is caused by the two mutations in the promoter region of the ptcC-celA operon in NZ9000 (see Fig. 2A). The data suggest that these mutations result in the constitutive expression of the cellobiose-specific PTS in NZ9000.
Besides the heretofore described carbon (carbohydrate) source-related genes, very few others were differentially expressed. Examples are the genes for the arginine biosynthetic pathway, gltS-argE, argGH, and argBF, an effect that was observed exclusively for GCDM-grown cells, and the nrdH-nrdE genes, involved in deoxynucleoside triphosphate (dNTP) biosynthesis. The upregulation of the gene encoding the putative multidrug efflux transporter (napC) in NZ9000 may be related to the insertion of the nisR-nisK genes, which truncates the 3′ end of the napC gene (Fig. 1).
FIG. 1.
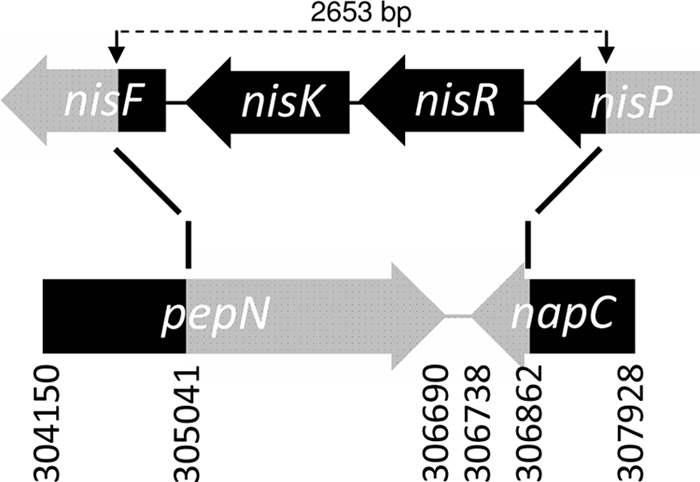
Schematic representation of the nisin gene cluster in L. lactis NZ9000. A DNA fragment, including the nisR-nisK genes, the 3′ part of nisP (117 residues), and the 5′ end of nisF (36 residues), was integrated into the chromosome by gene replacement (14). As a result, a large part of pepN and the last 123 nucleotides of napC were removed. The integrated fragment is indicated in black, and the removed sequence is indicated in grey. Numbers indicate the reference positions in the annotated genome sequence of L. lactis MG1363 (33).
Growth of MG1363 and NZ9000 on different sugars.
The fact that the majority of transcriptomic differences between MG1363 and NZ9000 were observed for (clusters of) genes involved in sugar metabolism prompted us to analyze the growth of the strains on a wide range of carbohydrates and sugar alcohols as carbon and energy sources (mannose, sucrose, arabitol, maltose, fructose, xylose, dextran, cellobiose, glucose, raffinose, trehalose, and mannitol). For this purpose, CDM was used instead of M17 medium, as residual growth was observed with this complex broth, that is, without added sugar. Growth on mannose or glucose was the fastest (μmax = 0.84 h−1) and much faster than that on trehalose or maltose (μmax = 0.33 h−1). The growth on fructose was extremely slow (μmax < 0.2 h−1), and the yields were low (final OD of 0.2). In contrast, no growth in CDM supplemented with sucrose, arabitol, xylose, dextran, raffinose, or mannitol was observed. Although the differences between NZ9000 and MG1363 were small, NZ9000 grew consistently and significantly faster in GCDM than did MG1363 (Fig. 2 B). The most prominent differences were observed for growth on cellobiose (Fig. 2C). Starting from precultures grown in GCDM, strain MG1363 required incubation periods longer than 25 h to reach the mid-exponential phase. The lag time was reduced from more than 20 h to only a few hours in NZ9000. In addition to the lag time, the maximum specific growth rates on cellobiose were 0.69 h−1 for NZ9000 and 0.49 h−1 for MG1363. The long lag phase was not observed for MG1363 when the precultures were already grown on cellobiose (data not shown); the constitutive expression of the cellobiose-specific genes was also seen in media with both glucose and cellobiose as carbon and energy sources (Fig. 2D).
FIG. 2.

(A) Genetic organization of the L. lactis cellobiose operon. The putative −35 and −10 boxes in the promoter region of the L. lactis MG1363 catabolite-controlled ptcC gene are underlined. ptcB, cellobiose-specific PTS IIB component; ptcA, cellobiose-specific PTS IIA component; llmg_0439, putative DNA-binding transcriptional regulator; ptcC, cellobiose-specific PTS IIC component; bglA (annotated as celA), phospho-β-glucosidase. The putative cre site is indicated in the box. Asterisks indicate the mutations mapped in L. lactis NZ9000. (B to D) Typical growth profiles of L. lactis NZ9000 (•) and MG1363 (○) cultivated in CDM supplemented with 1% glucose (B), 1% cellobiose (C), or 1% cellobiose plus 0.1% glucose (D). All cultures were grown as biological triplicates, and average values are plotted.
DISCUSSION
We present the genome sequences of L. lactis NZ9000 and L. lactis MG1363. The sequence of the latter genome was published previously (33). By using ultradeep sequence technology, we obtained an almost-50-fold-higher sequence coverage and, consequently, a much higher fidelity of the sequence than that previously reported. The 73 differences between the published and resequenced MG1363 genomes must reflect sequencing errors rather than strain variations, as they are present in our in-house MG1363 and its derivative NZ9000, which were obtained at different times and via different routes. From the relatively low number of errors, we conclude that the previously published genome sequence was very accurate (Phred quality score of 45.4). Forty of the 73 errors are in coding regions. L. lactis NZ9000 carries another six mutations compared to the revised MG1363 genome sequence. To our knowledge, there is no reason to think that the creation of these mutations is associated with the integration of nisRK. Either these mutations appeared after the construction of strain NZ9000 by independent evolution, or they occurred in an MG1363 strain different from the one sequenced. Strain MG1363 was propagated for many generations after it was used to construct NZ9000 in 1998 (14) and before it was subjected to the sequencing effort in 2007 (33). The mutations in groEL, pepF, aroD, and gltX correspond to conservative substitutions (i.e., Leu to Ile in pepF, Val to Ile in aroD, and Ala to Val in gltX), and these substitutions are not likely to affect the functioning of the proteins. A more drastic effect was anticipated (and indeed observed) for the two mutations located in the ptcC promoter.
Cellobiose belongs to the group of plant-derived β-glucoside sugars. This disaccharide [two glucose molecules linked via a β(1-4) bond] is transported via a PEP-dependent cellobiose-specific PTS (13). The phospho-β-glucosidase is responsible for the intracellular cleavage of cellobiose-6-phosphate to glucose and glucose-6-phosphate. As observed for the transcriptomic data, the genes encoding the cellobiose-specific PTS IIC component (ptcC) and phospho-β-glucosidase (bglA) were highly upregulated in strain NZ9000 compared to strain MG1363, both in GCDM and in GM17 medium. In fact, the growth experiments presented in Fig. 2 confirm that the mutations in the ptcC promoter of strain NZ9000 led to a constitutive expression of the cellobiose-specific genes. It is noteworthy that the two mutations in the ptcC promoter are present in the putative cre site, the binding site of carbon catabolite control protein A (CcpA) (Fig. 2A). CcpA regulates carbon metabolism in Gram-positive bacteria, often by repressing genes involved in the utilization of other carbon sources when a rapidly metabolizable carbon source such as glucose is available. The known targets of CcpA in L. lactis are the gal operon for galactose utilization (20), the fru operon for fructose utilization (2), and the ptcABC operon for cellobiose utilization (35). In addition to cellobiose, the ptcABC-encoded cellobiose-specific PTS of L. lactis also facilitates the uptake of glucose. In fact, one of the consequences of the disruption of the glk (glucokinase) and ptnABCD (glucose/mannose PTS) genes in L. lactis NZ9000 was the transcriptional upregulation of the cellobiose-specific PTS operon (26), which is entirely consistent with the data presented here (Fig. 2). The downregulation of the genes related to the transport and metabolism of maltose, dextrose, amylose, mannitol, and trehalose may thus be related to a general catabolite-repressing effect, i.e., as a result of an increased capacity of NZ9000 to take up glucose. The small increase in the growth rate of NZ9000 may have had its impact on the expression of genes involved in nucleotide biosynthesis. We and others have noted that a slight change in the growth rate has an immediate effect on the expression of these genes. We cannot rule out the possibility that the disruption of pepN in NZ9000, i.e., as consequence of the integration of the nisRK genes, had an effect on the expression of genes involved in amino acid transport and metabolism, as PepN is the major aminopeptidase in L. lactis.
In summary, we present new genome sequencing data for two L. lactis strains that are the paradigms for research on lactic acid bacteria. The physiological differences of L. lactis strains NZ9000 and MG1363 can be rationalized on the basis of the differences in the genome sequences and should be taken into account in future -omics and cell physiology studies. The small but significant increase in the growth rate of L. lactis NZ9000 in the presence of glucose as the sole carbon and energy source might be explained by the increased transport capacity for glucose; that is, the cellobiose-specific PTS is coexpressed even in the presence of glucose. The improved fitness of strain NZ9000 on glucose may have been a determining factor in the selection for the mutations in the promoter region of the cellobiose-specific PTS.
Acknowledgments
We thank Anne de Jong for expert assistance with the DNA microarray technology and analyses and Peter van der Vlies for expert assistance with the genomic sequencing.
D.M.L. was supported by an FICYT fellowship from the Gobierno del Principado de Asturias. This research work was further supported by the Netherlands Proteomics Centre (NPC), the European Membrane Protein Consortium EDICT, and the Netherlands Science Foundation (NWO) (Chemical Sciences Top Subsidy to B.P. [grant 700-56-302]).
Footnotes
Published ahead of print on 16 July 2010.
REFERENCES
- 1.Bahey-El-Din, M., C. G. Gahan, and B. T. Griffin. 2010. Lactococcus lactis as a cell factory for delivery of therapeutic proteins. Curr. Gene Ther. 10:34-45. [DOI] [PubMed] [Google Scholar]
- 2.Barrière, C., M. Veiga-da-Cunha, N. Pons, E. Guédon, S. A. van Hijum, J. Kok, O. P. Kuipers, D. S. Ehrlich, and P. Renault. 2005. Fructose utilization in Lactococcus lactis as a model for low-GC Gram-positive bacteria: its regulator, signal, and DNA-binding site. J. Bacteriol. 187:3752-3761. [DOI] [PMC free article] [PubMed] [Google Scholar]
- 3.Bolotin, A., P. Wincker, S. Mauger, O. Jaillon, K. Malarme, J. Weissenbach, S. D. Ehrlich, and A. Sorokin. 2001. The complete genome sequence of the lactic acid bacterium Lactococcus lactis ssp. lactis IL1403. Genome Res. 11:731-753. [DOI] [PMC free article] [PubMed] [Google Scholar]
- 4.Braat, H., P. Rottiers, D. W. Hommes, N. Huyghebaert, E. Remaut, J. P. Remon, S. J. van Deventer, S. Neirynck, M. P. Peppelenbosch, and L. Steidler. 2006. A phase I trial with transgenic bacteria expressing interleukin-10 in Crohn's disease. Clin. Gastroenterol. Hepatol. 4:754-759. [DOI] [PubMed] [Google Scholar]
- 5.Castro, R., A. R. Neves, L. L. Fonseca, W. A. Pool, J. Kok, O. P. Kuipers, and H. Santos. 2009. Characterization of the individual glucose uptake systems of Lactococcus lactis: mannose-PTS, cellobiose-PTS and the novel GlcU permease. Mol. Microbiol. 71:795-806. [DOI] [PubMed] [Google Scholar]
- 6.Desmond, C., G. F. Fitzgerald, C. Stanton, and R. P. Ross. 2004. Improved stress tolerance of GroESL-overproducing Lactococcus lactis and probiotic Lactobacillus paracasei NFBC 338. Appl. Environ. Microbiol. 70:5929-5936. [DOI] [PMC free article] [PubMed] [Google Scholar]
- 7.Gaspar, P., A. R. Neves, A. Ramos, M. J. Gasson, C. A. Shearman, and H. Santos. 2004. Engineering Lactococcus lactis for production of mannitol: high yields from food-grade strains deficient in lactate dehydrogenase and the mannitol transport system. Appl. Environ. Microbiol. 70:1466-1474. [DOI] [PMC free article] [PubMed] [Google Scholar]
- 8.Gasson, M. J. 1983. Plasmid complements of Streptococcus lactis NCDO712 and other lactic streptococci after protoplast-induced curing. J. Bacteriol. 154:1-9. [DOI] [PMC free article] [PubMed] [Google Scholar]
- 9.Geertsma, E. R., and B. Poolman. 2007. High-throughput cloning and expression in recalcitrant bacteria. Nat. Methods 4:705-707. [DOI] [PubMed] [Google Scholar]
- 10.Hendriksen, W. T., H. J. Bootsma, S. Estevão, T. Hoogenboezem, A. de Jong, R. de Groot, O. P. Kuipers, and P. W. Hermans. 2008. CodY of Streptococcus pneumoniae: link between nutritional gene regulation and colonization. J. Bacteriol. 190:590-601. [DOI] [PMC free article] [PubMed] [Google Scholar]
- 11.Kleine, L. L., V. Monnet, C. Pechoux, and A. Trubuil. 2008. Role of bacterial peptidase F inferred by statistical analysis and further experimental validation. HFSP J. 2:29-41. [DOI] [PMC free article] [PubMed] [Google Scholar]
- 12.Kok, J., G. Buist, A. L. Zomer, S. A. van Hijum, and O. P. Kuipers. 2005. Comparative and functional genomics of lactococci. FEMS Microbiol. Rev. 29:411-433. [DOI] [PubMed] [Google Scholar]
- 13.Kowalczyk, M., M. Cocaign-Bousquet, P. Loubiere, and J. Bardowski. 2008. Identification and functional characterisation of cellobiose and lactose transport systems in Lactococcus lactis IL1403. Arch. Microbiol. 189:187-196. [DOI] [PubMed] [Google Scholar]
- 14.Kuipers, O. P., P. G. de Ruyter, M. Kleerebezem, and W. M. de Vos. 1998. Quorum sensing-controlled gene expression in lactic acid bacteria. J. Biotechnol. 64:15-21. [Google Scholar]
- 15.Kuipers, O. P., A. de Jong, R. J. Baerends, S. A. van Hijum, A. L. Zomer, H. A. Karsens, C. D. den Hengst, N. E. Kramer, G. Buist, and J. Kok. 2002. Transcriptome analysis and related databases of Lactococcus lactis. Antonie Van Leeuwenhoek 82:113-122. [PubMed] [Google Scholar]
- 16.Kunji, E. R., D. J. Slotboom, and B. Poolman. 2003. Lactococcus lactis as host for overproduction of functional membrane proteins. Biochim. Biophys. Acta 1610:97-108. [DOI] [PubMed] [Google Scholar]
- 17.Linares, D. M., E. R. Geertsma, and B. Poolman. 2010. Evolved Lactococcus lactis strains for enhanced expression of recombinant membrane proteins. J. Mol. Biol. 401:45-55. [DOI] [PubMed] [Google Scholar]
- 18.Liu, S., K. M. Bischoff, N. Qureshi, S. R. Hughes, and J. O. Rich. 2010. Functional expression of the thiolase gene thl from Clostridium beijerinckii P260 in Lactococcus lactis and Lactobacillus buchneri. New Biotechnol. 27:283-288. [DOI] [PubMed] [Google Scholar]
- 19.Long, A. D., H. J. Mangalam, B. Y. Chan, L. Tolleri, G. W. Hatfield, and P. Baldi. 2001. Improved statistical inference from DNA microarray data using analysis of variance and a Bayesian statistical framework. Analysis of global gene expression in Escherichia coli K12. J. Biol. Chem. 276:19937-19944. [DOI] [PubMed] [Google Scholar]
- 20.Luesink, E. J., R. E. van Herpen, B. P. Grossiord, O. P. Kuipers, and W. M. de Vos. 1998. Transcriptional activation of the glycolytic las operon and catabolite repression of the gal operon in Lactococcus lactis are mediated by the catabolite control protein CcpA. Mol. Microbiol. 30:789-798. [DOI] [PubMed] [Google Scholar]
- 21.MacLean, D., J. D. Jones, and D. J. Studholme. 2009. Application of next-generation sequencing technologies to microbial genetics. Nat. Rev. Microbiol. 7:287-296. [DOI] [PubMed] [Google Scholar]
- 22.Makarova, K., A. Slesarev, Y. Wolf, A. Sorokin, B. Mirkin, E. Koonin, A. Pavlov, N. Pavlova, V. Karamychev, N. Polouchine, V. Shakhova, I. Grigoriev, Y. Lou, D. Rohksar, S. Lucas, K. Huang, D. M. Goodstein, T. Hawkins, V. Plengvidhya, D. Welker, J. Hughes, Y. Goh, A. Benson, K. Baldwin, J. H. Lee, I. Diaz-Muniz, B. Dosti, V. Smeianov, W. Wechter, R. Barabote, G. Lorca, E. Altermann, R. Barrangou, B. Ganesan, Y. Xie, H. Rawsthorne, D. Tamir, C. Parker, F. Breidt, J. Broadbent, R. Hutkins, D. O'Sullivan, J. Steele, G. Unlu, M. Saier, T. Klaenhammer, P. Richardson, S. Kozyavkin, B. Weimer, and D. Mills. 2006. Comparative genomics of the lactic acid bacteria. Proc. Natl. Acad. Sci. U. S. A. 103:15611-15616. [DOI] [PMC free article] [PubMed] [Google Scholar]
- 23.Margolles, A., J. A. Moreno, L. Ruiz, B. Marelli, C. Magni, C. G. de Los Reyes-Gavilán, and P. Ruas-Madiedo. 2010. Production of human growth hormone by Lactococcus lactis. J. Biosci. Bioeng. 109:322-324. [DOI] [PubMed] [Google Scholar]
- 24.Mierau, I., and M. Kleerebezem. 2005. 10 years of the nisin-controlled gene expression system (NICE) in Lactococcus lactis. Appl. Microbiol. Biotechnol. 68:705-717. [DOI] [PubMed] [Google Scholar]
- 25.Monnet, V., M. Nardi, A. Chopin, M. C. Chopin, and J. C. Gripon. 1994. Biochemical and genetic characterization of PepF, an oligopeptidase from Lactococcus lactis. J. Biol. Chem. 269:32070-32076. [PubMed] [Google Scholar]
- 26.Pool, W. A., A. R. Neves, J. Kok, H. Santos, and O. P. Kuipers. 2006. Natural sweetening of food products by engineering Lactococcus lactis for glucose production. Metab. Eng. 8:456-464. [DOI] [PubMed] [Google Scholar]
- 27.Poolman, B., and W. N. Konings. 1988. Relation of growth of Streptococcus lactis and Streptococcus cremoris to amino acid transport. J. Bacteriol. 170:700-707. [DOI] [PMC free article] [PubMed] [Google Scholar]
- 28.Siezen, R. J., J. Bayjanov, B. Renckens, M. Wels, S. A. van Hijum, D. Molenaar, and J. E. van Hylckama Vlieg. 2010. Complete genome sequence of Lactococcus lactis subsp. lactis KF147, a plant-associated lactic acid bacterium. J. Bacteriol. 192:2649-2650. [DOI] [PMC free article] [PubMed] [Google Scholar]
- 29.Srivatsan, A., Y. Han, J. Peng, A. K. Tehranchi, R. Gibbs, J. D. Wang, and R. Chen. 2008. High-precision, whole-genome sequencing of laboratory strains facilitates genetic studies. PLoS Genet. 4:e1000139. [DOI] [PMC free article] [PubMed] [Google Scholar]
- 30.Tatusov, R. L., N. D. Fedorova, J. D. Jackson, A. R. Jacobs, B. Kiryutin, E. V. Koonin, D. M. Krylov, R. Mazumder, S. L. Mekhedov, A. N. Nikolskaya, B. S. Rao, S. Smirnov, A. V. Sverdlov, S. Vasudevan, Y. I. Wolf, J. J. Yin, and D. A. Natale. 2003. The COG database: an updated version includes eukaryotes. BMC Bioinformatics 4:41. [DOI] [PMC free article] [PubMed] [Google Scholar]
- 31.van Hijum, S. A., A. de Jong, G. Buist, J. Kok, and O. P. Kuipers. 2003. UniFrag and GenomePrimer: selection of primers for genome-wide production of unique amplicons. Bioinformatics 19:1580-1582. [DOI] [PubMed] [Google Scholar]
- 32.van Hijum, S. A., A. de Jong, R. J. Baerends, H. A. Karsens, N. E. Kramer, R. Larsen, C. D. den Hengst, C. J. Albers, J. Kok, and O. P. Kuipers. 2005. A generally applicable validation scheme for the assessment of factors involved in reproducibility and quality of DNA-microarray data. BMC Genomics 6:77-86. [DOI] [PMC free article] [PubMed] [Google Scholar]
- 33.Wegmann, U., M. O'Connell-Motherway, A. Zomer, G. Buist, C. Shearman, C. Canchaya, M. Ventura, A. Goesmann, M. J. Gasson, O. P. Kuipers, D. van Sinderen, and J. Kok. 2007. Complete genome sequence of the prototype lactic acid bacterium Lactococcus lactis subsp. cremoris MG1363. J. Bacteriol. 189:3256-3270. [DOI] [PMC free article] [PubMed] [Google Scholar]
- 34.Winsor, C. P. 1932. The Gompertz curve as a growth curve. Proc. Natl. Acad. Sci. U. S. A. 18:1-8. [DOI] [PMC free article] [PubMed] [Google Scholar]
- 35.Zomer, A. L., G. Buist, R. Larsen, J. Kok, and O. P. Kuipers. 2007. Time-resolved determination of the CcpA regulon of Lactococcus lactis subsp. cremoris MG1363. J. Bacteriol. 189:1366-1381. [DOI] [PMC free article] [PubMed] [Google Scholar]