Abstract
Carcinogenesis is a complex, multistep, multipath process often described as “somatic evolution.” Conventional models of cancer progression are typically based on the genetic and epigenetic changes observed in malignant and premalignant tumors. We have explored an alternative approach that emphasizes the selection forces within adaptive landscapes governing growth and evolution in in-situ, microinvasive, and metastatic cancers. In each environment, specific barriers to proliferation act as strong selection forces that determine the optimal phenotypic properties that permit tumor growth and invasion. Thus, the phenotypic properties or “hallmarks” of cancer can be viewed as successful adaptations to these microenvironmental selection forces. In turn, these selection pressures are not static but will dynamically change as a result of tumor population growth and evolution.
Here, we emphasize the role of hypoxia and acidosis in the progression of tumor from in-situ to invasive cancer. This is a consequence of early tumor cell proliferation on epithelial surfaces, which are separated from the underlying blood supply by the intact basement membrane. As tumor cells proliferate further away from the basement membrane, the diffusion-reaction kinetics of substrate and metabolite flow to and from the blood vessels result in regional hypoxia and acidosis. Cellular adaptation to the former include upregulation of glcyolysis and to the latter include upregulation of Na+/H+ exchangers (NHE1) and other acid-regulating proteins such as carbonic anhydrase. We propose this phenotype is critical for subsequent malignant growth of primary and metastatic cancers.
Keywords: hypoxia, acidosis, HIF1α, carcinogenesis, glycolysis
Introduction
Invasive cancer develops over a prolonged period through accumulation of multiple heritable genetic changes – a process often characterized as “somatic evolution.” Early researchers inducing skin tumors in animal models noted that tumorigenesis progresses through distinct and predictable phases. The first step (initiation) follows application of a mutagenic agent such as radiation. This produces no visible tissue change and the resulting phenotype is usually not distinguishable from normal cells. Nevertheless, the initiation step permanently predisposes the treated skin to development of cancer, but initiation alone is typically insufficient for tumor formation and exposure of the skin to irritants such as tar (the promotion step) is required to induce growth of visible lesions. This growth, however, remains self-limited and the pre-cancerous carcinomas will typically regress after withdrawal of the promoting agent. Development of an invasive cancer requires additional prolonged, repeated stimulation by non-carcinogenic, genotoxic agents, such as turpentine (the progression step) [1].
Here, we will review carcinogenesis as a multistage process, and consider the metabolic constraints placed on a developing pre-invasive tumour, as well as the subsequent adaptations that are proposed to occur, in a predictable fashion, in the evolution of an invasive cancer.
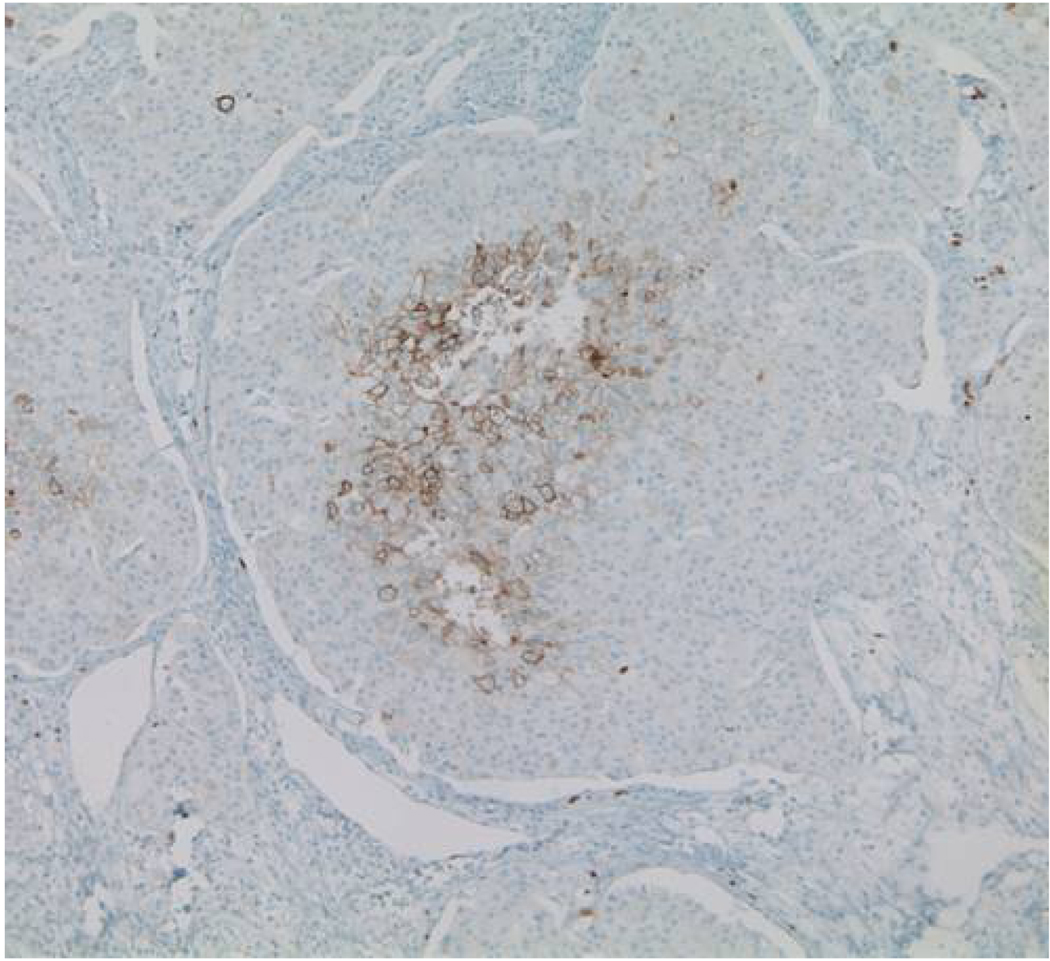
In healthy tissue, constraints to tumorigenesis exist in the form of hard-wired barriers that prevent disruption of tissue architecture and function by inappropriate cellular proliferation. These controls include highly-regulated activation by specific pro-growth signals and growth-inhibitory barriers through anoikis and interactions with other cells and the extracellualr matrix. Finally, cellular hyperproliferation on epithelial surfaces creates a spatially limited milieu – as with a pre-invasive carcinoma in situ (CIS), discussed below – that will increase local metabolic demands beyond the sustainability of surrounding tissue causing a decrease in concentrations of available nutrients and a build-up of potentially toxic waste products (Figure 1) [2,3].
Figure 1.
Immunohistochemical staining for GLUT-1 in ductal carcinoma in situ showing evidence of regional hypoxia with central necrosis and upregulation of GLUT-1 in cells furthest from the basement membrane
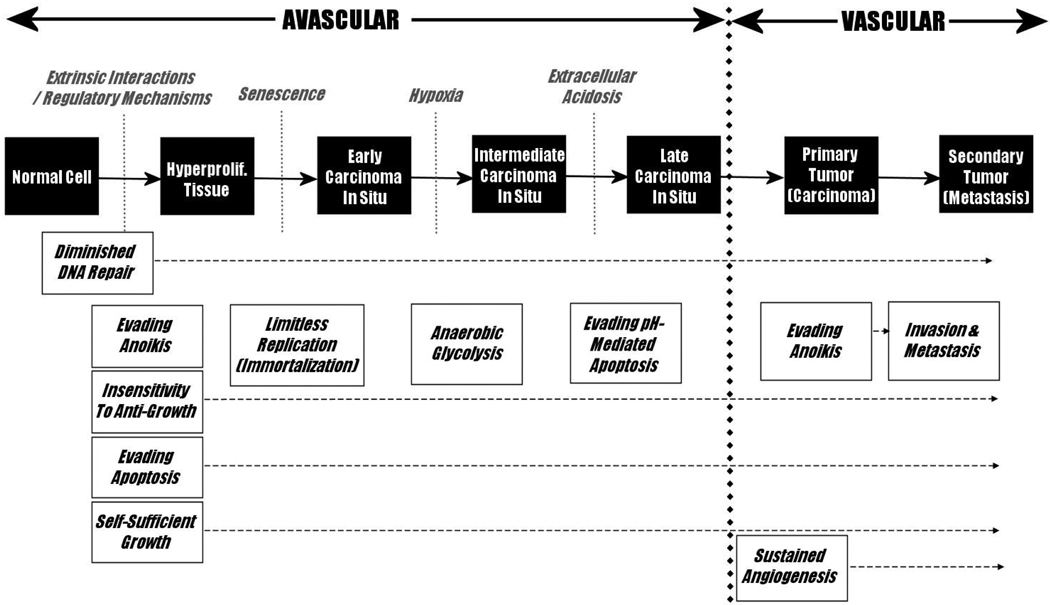
During the course of carcinogenesis, these barriers to proliferation must be overcome to permit the unconstrained cell growth characteristic of cancer. Hanahan and Weinberg [4] proposed that these obstacles would direct the progression of carcinogenesis such that all carcinomas – regardless of their diverse tissue origins and specific genomic changes – would evolve at least six predictable hallmark features that must be present in any carcinoma in order to sustain tumour growth: 1) insensitivity to anti-growth signals, 2) evasion of apoptosis, 3) self-sufficient growth signals, 4) limitless replicative potential (immortalization), 5) sustained angiogenesis, and 6) invasion and metastasis. Gatenby and Gillies [3] expanded upon these six hallmarks by proposing two more: 1) evasion of anoikis – cell death signals mediated by loss of cell-ECM contact, and 2) increased glucose consumption, through to increased glycolysis, and resistance to the toxicity of subsequent local acidification. They also emphasized the critical role of a sequence of specific external (microenvironmental) obstacles that must be overcome for carcinogenesis to proceed. These cancer hallmarks can be mapped onto the observed progression from normal tissue to metastatic cancer to produce a teleologically-derived model for carcinogenesis (Figure 2). A key prediction of this model is that regions of hypoxia and acidosis will inevitably develop in CIS lesions and that adaptations to these microenvironmental forces are critical for the transition from in situ to invasive cancer. As outlined in Figure 1, this previously unrecognized era in carcinogenesis is due to the separation of proliferating intraluminal tumor cells from the underlying blood vessels by the intact basement membrane. This constrains delivery of substrates to diffusion over increasingly long distances as the tumor expands into the lumen. The diffusion-reaction kinetics are predicted to result in hypoxia and acidosis in tumor regions even within a few cell layers of the basement membrane.
Figure 2.
A Model of Carcinogenesis, adapted from Gillies & Gatenby (2007). Carcinogenesis is presented with tumorigenic barriers and proposed timing of hallmark events.2,4 The specific order of occurrence for each carcinogenic hallmark may differ from cancer to cancer. Although not originally listed as a hallmark event, diminished DNA repair is included here because it can be considered a necessary step for subsequent carcinogenesis.
Background
Diffusion-reaction models of substrate flow
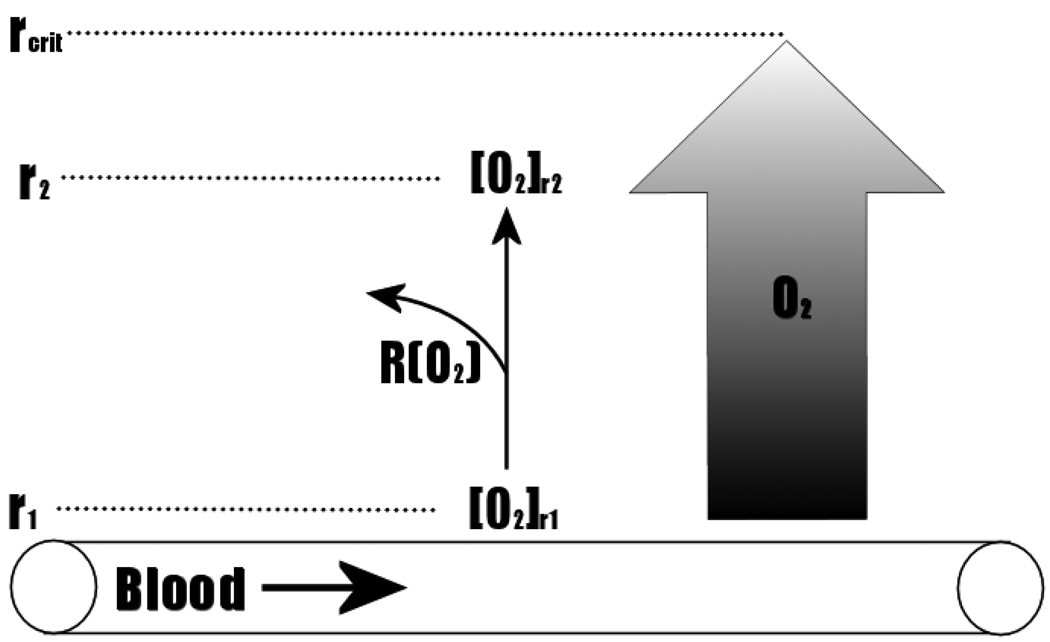
Te first test the hypothesized model of CIS maturation, we use mathematical models to examine substrate flow in pre-invasive tumors. As demonstrated in Figure 1, tumor cells in CIS grow away from the basement membrane thus increasing their distance from the blood vessels which remain on the opposite side of the membrane. The diffusion of O2 from blood vessel to surrounding tissue (Figure 3) can be mathematically modeled using a reaction-diffusion equation based on Fick’s second law of diffusion. Once O2 has exited a blood vessel ([O2]r1), changes in O2 along the axis perpendicular to the vessel can be calculated using the equation below:
| (1) |
Figure 3.
Diffusion of O2 From a Blood Vessel To Surrounding Tissue Extends to a Maximal Distance (rcrit) Due To Loss of O2 From Metabolism. Extrapolation of rcrit along the length of the vessel forms a cylinder representing the functional extent of oxygenation by the vessel.
[O2] is the concentration of O2 in the axis perpendicular to the blood vessel, and r is the distance along the axis perpendicular to the blood vessel. D is the diffusion coefficient of O2 and R(O2) is the rate of oxygen consumption by metabolic reactions in the surrounding tissue.
Assuming a negligible loss of O2 by diffusion off the axis perpendicular to the blood vessel, the amount of O2 that diffuses to point r2 ([O2]r2) perpendicular from the vessel will equal the concentration of O2 at point r1 ([O2]r1), less any O2 that has been consumed in metabolic reactions. From the reaction-diffusion equation above, a critical distance (rcrit) can be calculated, which represents the distance at which there is no further change in O2 concentration with distance (∂ [O2]/ ∂r = 0). Thus, as Krogh proposed in 1919 [5], the attrition of O2 by metabolic consumption establishes a cylindrical gradient of oxygenation surrounding a blood vessel, with a radius (rcrit), which represents the region of surrounding tissue that will be normoxic. Indeed, Krogh noted that the vascular density in striated muscles will produce overlapping cylinders with radius, rcrit, [5] allowing uniformly normoxic microenvironmental conditions. Based on this theory, tumor hypoxia was originally thought to be due to low tumor vascularity [6]. However, Helmlinger and colleagues reported that tumour pHe and pO2 profiles were heterogeneous – with large regions of hypoxia and acidosis – despite the presence of an extensive blood vessel network [7] suggesting that blood flow rather than vascular density is the primary limitation in tumor oxygenation.
In a CIS or invasive carcinoma, rcrit may be viewed as the distance from the basement membrane in which tumor cells may remain normoxic. Using typical values and the Krogh equation, this distance is calculated to be about 100 microns but might be decreased due to the increased metabolic demand from highly proliferating pre-cancerous cells. These predictions are consistent with experimental observations of hypoxia in the central region of tumor spheroids and clinical specimens of breast ductal CIS (DCIS) (Figure 1) as well as upregulation of hypoxia-inducible gene products, GLUT1 and Carbonic Anhydrase IX, in the central regions of DCIS [8,9].
Normal cellular responses to hypoxia
Normal tissues in well-oxygenated environments typically rely on highly efficient forms of aerobic metabolism to generate ATP. Glucose is the main source of energy and enters the cell through a family of glucose transporters (primarily GLUT-1 through 4). Pyruvate is generated by the first steps of glucose metabolism. Under aerobic conditions, pyruvate typically enters the mitochondria and is metabolized to CO2 and H2O in the Krebs cycle producing 38 moles of ATP per mole of glucose. However, under anaerobic conditions, the lack of O2 to act as the final electron acceptor in the electron transport chain prevents aerobic metabolism from progressing. The pyruvate is reduced to lactate to re-generate oxidized nicotinamide adenine dinucleotide, NAD+ from reduced NADH, thus producing only 2 moles of ATP per mole of glucose. Because of the significantly increased efficiency of aerobic metabolism of glucose, glycolysis is less active under oxygenated conditions and upregulated under anaerobic conditions – a phenomenon referred to as the Pasteur Effect. As described below, the Pasteur Effect is coordinately regulated by energy, redox and activation of transcription factors.
Adenosine nucleotides are the core of the cellular energy sensor that determines the switch between aerobic and anaerobic metabolic processes [10]. The classical mechanism underlying the Pasteur Effect was derived from the observation that Adenosine Monophosphate (AMP) allosterically activates phosphofructokinase [11], an enzyme involved in conversion of fructose 6-phosphate to fructose 1,6-bisphosphate during glycolysis. ATP competitively inhibits AMP’s effect on phosphofructokinase, downregulating glycolysis during periods of high energy availability [11]. During hypoxia, loss of available O2 diminishes aerobic metabolism, resulting in an increase in the AMP/ATP ratio, promoting allosteric activation of phosphofructokinase by AMP and activation of the glycolytic pathway. In ischemic cardiac muscle, AMP also activates the highly-sensitive AMP-activated protein kinase (AMPK) pathway (both allosterically and via activation of upstream kinases). Activated AMPK phosphorylates a number of metabolic enzymes that can induce changes in gene expression [12]. Among the targets of AMPK phosphorylation is 6-phosphofructo-2-kinase (6PF2K), which induces the activation of fructose-2,6-bisphosphatase (F26BP) which in turn causes the activation of phosphofructokinase and increases glycolysis [13]. AMPK also increases expression of the glucose transporters, which may further aid in upregulation of glycolysis [12,14].
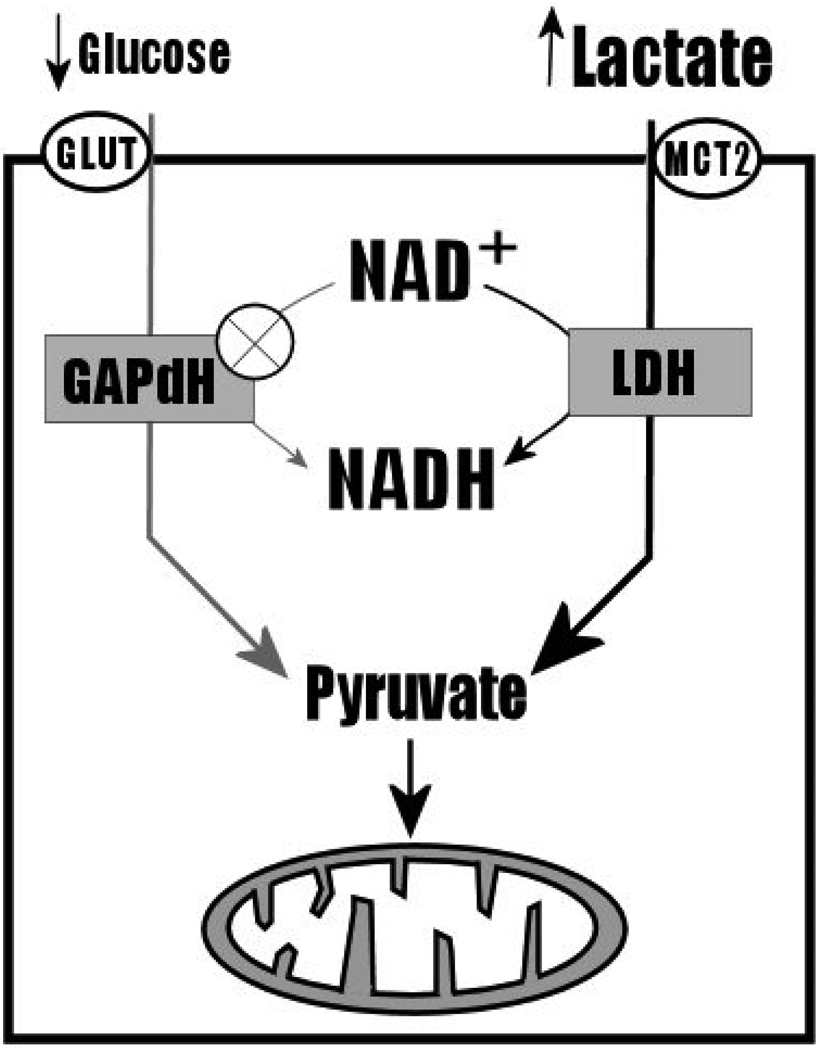
Another mechanism that has been proposed to be involved in the Pasteur effect is the “redox switch hypothesis”. This model proposes that NADH plays a critical role in hypoxia-sensitivity of glycolysis. NADH is a reducing agent that is recycled by the action of NADH dehyrogenases. Oxidative metabolism of glucose efficiently recycles NADH from NAD+ by the action of glyceraldehyde phosphate dehydrogenase (GAPdH), producing 6 NADH molecules that can be used to generate ATP by the mitochondrial electron transport chain. GAPdH is the only enzyme of the glycolytic pathway that recycles NADH, and functions in the presence of cytosolic glucose. Under hypoxic conditions, extracellular lactate increases while glucose availability decreases with resulting upregulation of lactate transport into the cell. The redox switch hypothesis postulates that cytosolic lactate accumulation results in the preferential competition for NAD+ recycling by lactate dehyrogenase, LDH, over GAPdH, thereby further reducing or inhibiting glycolytic flux under aerobic conditions, contributing to the hypoxia-sensitivity of glycolysis [15] (Figure 4, reproduced from [15]).
Figure 4.
Diagram of the “Redox Switch Hypothesis”, adapted from Cerdan et al. (2006). Briefly, lactate dehydrogenase (LDH) competes with GAPdH for NAD+, following accumulation of cytosolic lactate under anaerobic conditions. This upregulates lactate metabolism and reduces or eliminates glycolytic flux.
The Warburg Effect and its molecular mechanisms
Unlike in normal tissues, glycolysis is typically constitutively upregulated in carcinomas and persists even under normoxic conditions - a phenomenon termed the “Warburg Effect” [16]. In the past several years, much progress has occurred in understanding genetic pathways that yield this phenotypic property.
There is abundant evidence of upregulation of components of the glycolytic pathway in cancer cells. For example, an isoform of 6PF2K containing the conserved sequence targeted by AMPK is expressed in several cancer samples [17]. Control of the glycolytic pathway appears to be multifactoral, but critical upstream effectors include the c-myc family of proteins, the hypoxia sensitive transcription factor, HIF-1α, and other proteins beyond the scope of this discussion.
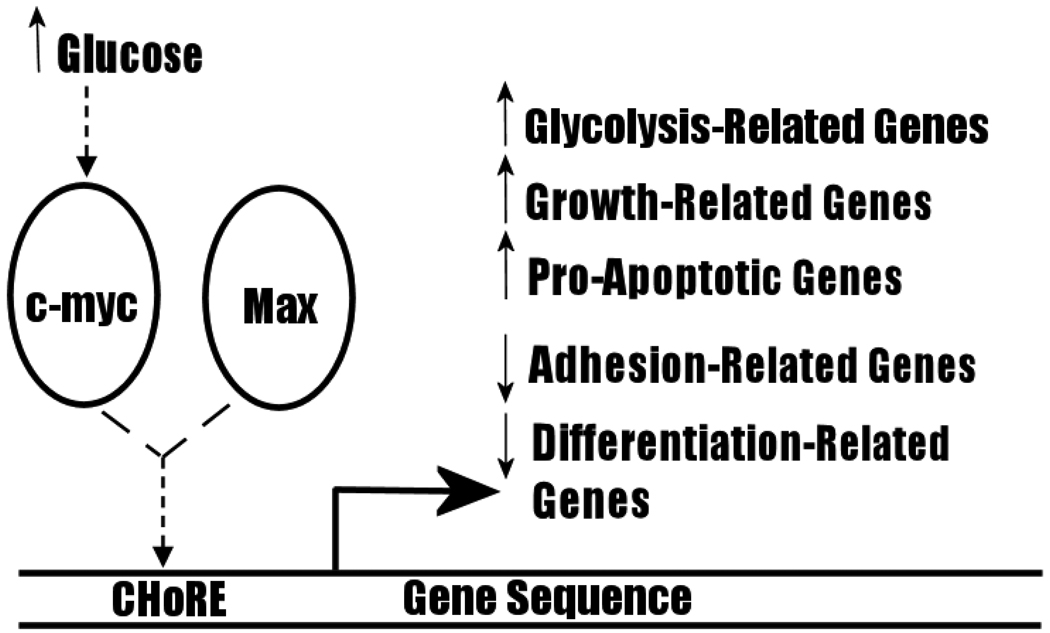
C-myc is a transcription factor that activates expression of several genes linked to increased cellular proliferation and differentiation [18]. It is characteristically dysregulated in several cancers, notably in Burkitt lymphoma, which arises following a chromosomal translocation of the c-myc gene resulting in constitutive expression [18,19]. Retroviral infection of the v-myc gene rapidly induces tumour growth in chickens and co-transfection of rodent fibroblasts with c-myc and the oncogene, Ras, is particularly tumorigenic [20]. Several recent findings have supported a role for c-myc in the shift to glycolysis. Sequence analysis reveals that the core binding site of c-myc proteins (the E-box) corresponds to the carbohydrate response element (ChoRE), which is present in the promoter regions of gene products whose expression is sensitive to carbohydrate metabolism levels. Heterodimerization of c-myc with its binding partner Max alters expression of a variety of genes: transfection of rat fibroblasts and mouse liver cells with the c-myc gene induces upregulation of genes associated with growth, apoptosis and metabolism, and decreases expression of genes associated with cell adhesion and differentiation (Figure 5, also Table 1 of Dang et al. [19]. Notably, c-myc transactivates Lactate Dehydrogenase A (LDH-A), and causes an overproduction of lactic acid when transfected into rodent fibroblasts [21]. LDH-A may also be necessary for c-myc-mediated anchorage-independent growth and clonogenicity [19,21]. GLUT proteins, enolase and other proteins associated with glycolysis have also been found to be overexpressed in cells transfected with c-myc [22]. Thus, c-myc is a strong candidate effector of the Warburg Effect.
Figure 5.
Transactivation By C-myc. C-myc heterodimerizes with Max to activate or decrease expression of genes involved in several cellular processes.
HIF-1 is a master transcription factor consisting of α and β subunits (members of the basic helix-loop-helix-Per-ARNT-SIM (bHLH-PAS) family of proteins), and was first identified for its DNA-binding activity in the promoter of erythropoietin, which experiences altered gene expression under hypoxic conditions. The most well-studied of these subunits are HIF-1α and HIF-1β (previously identified and named Aryl Hydrocarbon Nuclear Translocator (ARNT)), although two other homologs of each subunit have also been identified [23]. While HIF-1β expression is constitutive and unaffected by hypoxia induced by CoCl2 [24], HIF-1α represents the oxygen-sensitive component of the HIF-1 pathway: HIF-1α mRNA and protein levels – as well as DNA-binding activity – are sensitive to extracellular oxygen concentration.
In most normal and some cancer cells, expression of HIF-1α is undetectable under normoxic conditions. When exposed to 1% O2, expression became detectable at 30 minutes and peaks at 4 h, but is rapidly lost within five minutes of return to normoxic conditions [25]. DNA-binding of HIF-1 was also absent in 20% O2, but was induced by 1% O2 [26] HIF-1α mRNA levels are also increased under ischemic conditions [27] suggesting that hypoxia stabilizes the HIF-1α mRNA message by an as-of-yet unresolved mechanism. Tracking HIF-1 DNA-binding activity and protein expression with increasing O2 levels shows a sharp decrease in both measures between 0.5% and 6% O2, with basal levels persisting from 6% to 20% O2. [28]. Thus, HIF-1 presents a means for responding in a graded fashion to physiological levels of O2.
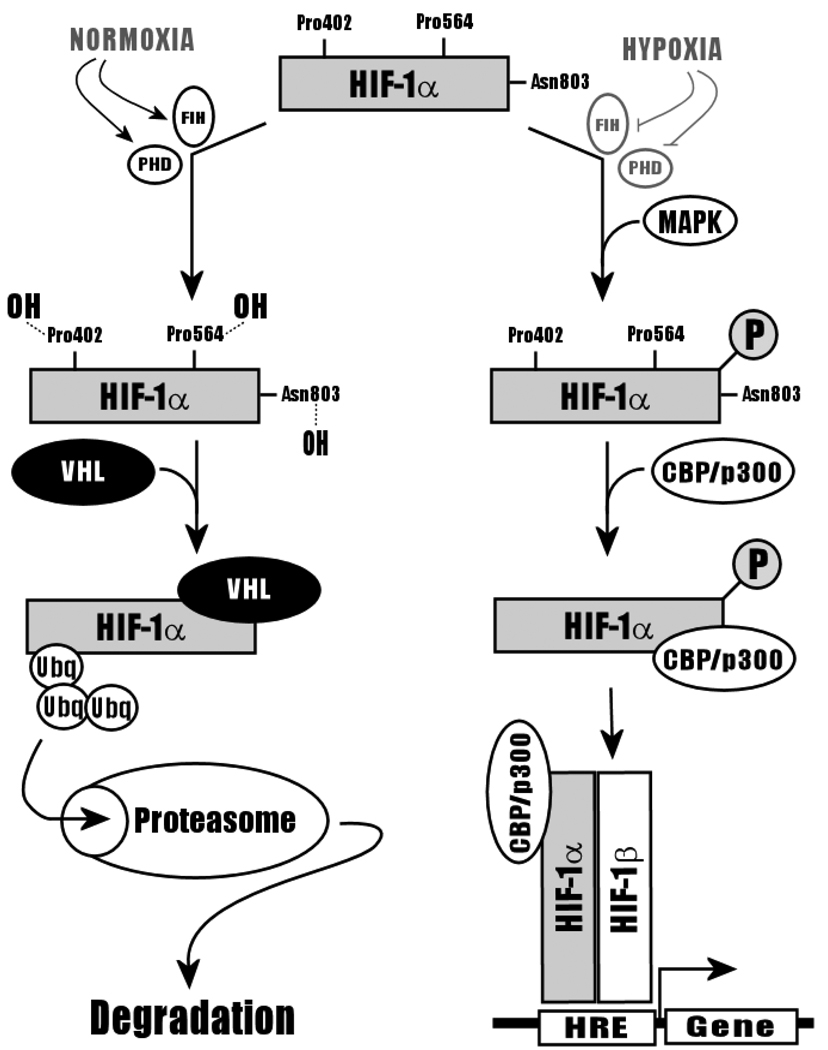
Heterodimerization of HIF-1α and HIF-1β subunits is necessary for DNA-binding. Truncation experiments conducted on HIF-1α have revealed that the bHLH-PAS domain of this protein is both necessary and sufficient for heterodimerization with HIF-1β [29] HIF-1α contains an Oxygen-Dependent Degradation (ODD) domain responsible for HIF-1α’s short half-life in the presence of oxygen. Under normoxic conditions, HIF-1α is constitutively expressed but is rapidly degraded by the ubiquitin-28S proteasome pathway [30]. Specifically, in normoxia, proline402 and proline564 are hydroxylated by oxygen-dependent Proline Hydroxylases (PHD), predisposing HIF-1α to binding by the von Hippel-Lindau, VH-L, ubiquitin ligase and shunting of HIF-1α towards the protein degradation pathway1,32]. Hydroxylation of aspargine803 by Factor Inhibiting HIF (FIH) under normoxic conditions further inactivates HIF-1α by inhibiting its interaction with transcriptional co-activator, CBP/p300 [32]. Under hypoxic conditions, lack of O2 prevents the hydroxylation (and thus degradation) of HIF-1α by PHD and FIH. Instead, HIF-1α binds to CBP/p300 and is translocated to the nucleus for heterodimerization with HIF-1β (Figure 6). Addition of proteasome inhibitors to normoxic cells allows the accumulation of HIF-1α and transactivation of genes by HIF-1 [30]. Binding of HIF-1β to HIF-1α -- an interaction that is enhanced by MAPK phosphorylation of HIF-1α -- induces a HSP90-depdendent conformational change in HIF-1α to produce the master transcription factor, HIF-1 [23,24]. HIF-1α expression has also been found to be sensitive to a variety of environmental factors and signaling molecules, including extracellular nickel (Ni2+), Nitric Oxide (NO), angiotensin II, and TGF-α [31].
Figure 6.
HIF-1α Degradation in Normoxia by the Ubiquitin-Proteasomal Pathway, adapted from Ke and Costa (2006). During normoxia, HIF-1α is hydroxylated by PHD and FIH, which promotes the binding of VHL ubiquitin ligase. HIF-1α is thus is rapidly degraded via the ubiquitin-proteasome pathway. Under hypoxic conditions, FIH and PHD are inactive. Instead, HIF-1α is phosphorylated by MAPK and bound by CBP/p300, inducing heterodimerization with HIF-1β and transactivation of a variety of genes.
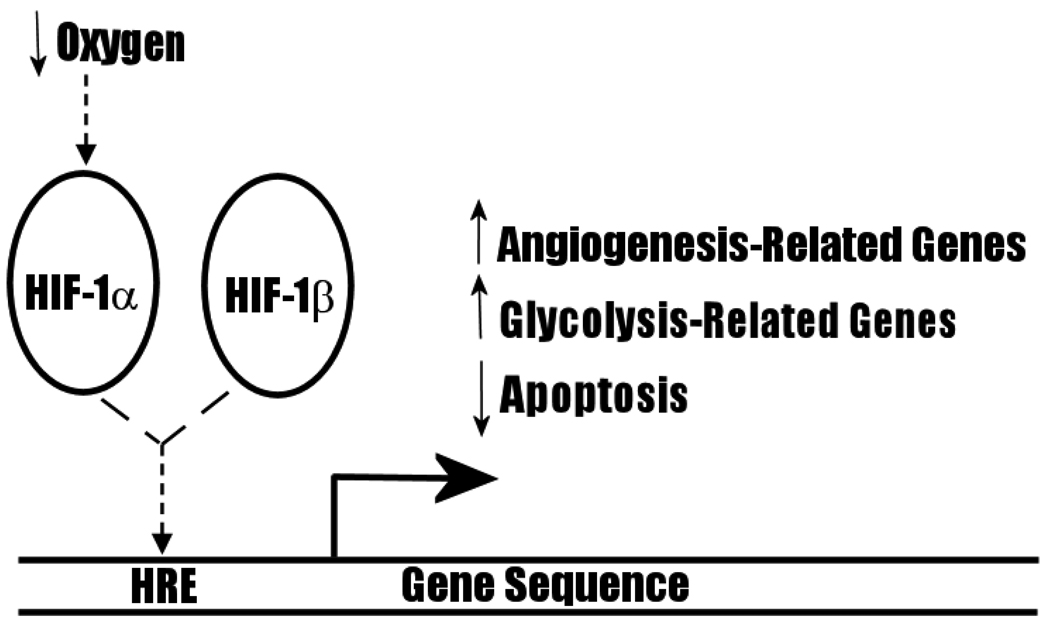
HIF-1 binds to promoter region hypoxia response elements (HRE) to transactivate a diversity of genes, including genes broadly related to iron metabolism (e.g. erythropoietin [33],) vascular tone, matrix metabolism, cell proliferation, angiogenesis (e.g. VEGF), glucose metabolism, and apoptosis (for a detailed list of target genes, see Table 2 of Ke and Costa (2006) [31]). Of particular significance to carcinogenesis and the Warburg Effect is the fact that HIF-1 transactivates glycolytic enzymes, anti-apoptotic proteins, and angiogenic mitogens (Figure 7). Increased expression of VEGF may be involved in the turning on of the angiogenic switch, while transactivation of the anti-apoptotic bcl-2 oncogene may be related to evasion of acid-mediated apoptosis in the late CIS. Finally, HIF-1 increases expression of many glycolytic pathway enzymes [31] as well as glucose transporters, GLUT1 and GLUT3 [34]. HIF-1α is stabilized by glycolytic end-products, lactate and pyruvate [35], thus establishing the basis for a positive feedback loop for glycolysis and the Warburg Effect under hypoxic conditions. Collectively, these findings strongly support the proposal that HIF-1 plays a critical role in upregulating glycolytic flux in CIS.
Figure 7.
Transactivation By HIF. HIF-1α heterodimerizes with HIF-1β to activate families of genes that may have implications for CIS maturation and the Warburg Effect.
Hypoxia and acidosis in somatic evolution of cancer
Models of carcinogenesis
A number of theoretical models of all or some stages of carcinogenesis exist. These include the initiation-promotion-progression approach (described above) derived largely from empirical observations in skin carcinogenesis. The Folkman model focuses on the transition from non-angiogenic to angiogenic phenotype in the corresponding transition from limited to unrestricted tumor growth [36]. Work by Bissell and others [37], while never formalized in an explicit theoretic model, emphasizes the critical role of components of the microenvironment in promoting or constraining malignant tumor morphology and growth. Fearon and Volgelstein [38] first proposed a model that defines the genetic events corresponding to the transition from healthy tissue to carcinoma in colorectal cancer. This progression begins with the transformation of normal to hyperplastic tissue, involving a series of genetic changes that cause an increase in cell proliferation. The speed with which these change accumulate are, at least in part, determined by the mutation rate. Thus, a number of investigators have proposed that an early (perhaps first) step in carcinogenesis is a mutation in DNA or chromosomal repair pathways [39]. The subsequent mutator population presumably has a growth advantage because it can generate adaptive phenotypes to proliferation barriers more quickly than populations with normal mutation rates.
We have explicitly examined the influence of environmental factors and the mutation rate on the rapidity of carcinogenesis has been examined using evolutionary game theory. The relationship can be expressed mathematically [40] as
| (2) |
where u is the mean phenotype of a population, F is the fitness of a population, and σ is the phenotypic variance around the mean. Equation 2 indicates that the rate of phenotypic evolution (du/dt) is dependent on the phenotypic variance (which is generally governed by the mutation rate) and the slope of the fitness curve (∂F/∂u). While this is in agreement with the “mutator hypothesis” it also demonstrates that highly selective microenvironments in with the slope of the fitness curve is high will also accelerate somatic evolution.
Adaptations to normal tissue proliferation constraints
Specific phenotypic changes during carcinogenesis include increases in the activation of pro-growth signal pathways (such as platelet-derived growth factor, PDGF, or tumor growth factor α, TGF-α) through mutations that increase the activity of growth factors, growth factor receptors or transduction pathways. This occurs along with heritable changes that reduce growth-inhibitory signals, such as APC mutations in colon cancer [41]. In addition, while cell-cell signaling through gap junctions is not included in the Fearon-Vogelstein model, it also mediates growth-inhibitory signals that will likely undergo mutations during carcinogenesis. Indeed, transfection of genes for gap junction proteins (connexins) into immortalized cells with low levels of intercellular communication strongly inhibits cell growth [42,43]. Thus, genomic changes that downregulate connexin expression or activity will further facilitate the transition to hyperplasia. Hence, with downregulation of growth inhibitory signals (tumor suppressors), cell numbers can increase under conditions wherein there would normally be significant attrition. In many common breast cancers, for example, the anti-apoptotic oncogene, bcl-2 is upregulated, allowing carcinoma cells to evade natural or chemotherapy-mediated apoptosis [44]. Finally, for cells to continue to accumulate progressive genetic abnormalities, they must continue to divide past their predetermined lifespan, which is classically determined by telomere length. With each cellular division, healthy cells experience a progressive loss of 50–100 base pairs of the chromosomal telomeres. Eventually, the loss of telomere protection of chromosomal ends leads to end-to-end chromosomal fusions that trigger apoptosis (senescence) – termed the Hayflick limit [45]. Usually, cells can only undergo 60–70 divisions before they become senescent. However, hyperplastic cells may divide beyond their normal lifespan as part of the progression into CIS. Evasion of senescence producing an immortalization of the abnormal cell can be accomplished by an upregulation of telomerase expression or activity [4].
Prolonged loss of proliferative control and rapid cellular division along with accumulating random genomic errors produce phenotypically diverse populations in premalignant lesions such as CIS. Cells of CIS and subsequent carcinomas typically display abnormal morphologies including disorganization, increased abundance of mitotic figures, nuclear pleiomorphisms, prominent nucleoli and increased nucleus-to-cytoplasm (N:C) ratios.
Hypoxia and acidosis in carcinogenesis
The microenvironment of preinvasive tumors is spatially and temporally diverse. Because cancers evolve on epithelial surfaces, the mutant cells remain separated from the underlying blood vessels by the intact basement membrane. Thus, premalignant tumors are characteristically avascular and local substrate concentrations are dependent on diffusion across the basement membrane from the underlying blood vessels. Furthermore, because the basement membrane remains intact, tumor cells are constrained to proliferate away from the surface. This increases the diffusion distance from the blood vessels and result in reaction-diffusion dynamics that produce significant microenvironmental heterogeneity. It has been proposed that this CIS milieu produces environmental selection pressures that are crucial in transition to the invasive phenotype of malignant cancers.
This hypothesis proposes the following sequence of events: as the tumor increases in size, the proliferating cells become increasingly distant from the basement membrane and the underlying vessels. The consequent diffusion-reaction dynamics results in large spatial and temporal fluctuations in concentrations of H+, glucose, pO2., and other nutrients Mathematical models (see above) demonstrate oxygenation of the tissue rapidly deteriorates with distance from the basement membrane, while glucose levels deteriorate less sharply. In fact, it is estimated that severe hypoxia will be present within about 5 cell diameters from the basement membrane. Simultaneously, H+ increases with distance from the basement membrane due to the diffusion distance and increased production of acid from hypoxic-glycolytic cells, rendering the interior of the CIS highly acidic (Figure 1). Gillies and Gatenby [2,3] proposed that adaptations to this toxic microenvironment represent critical steps in transition from a benign, pre-invasive tumor to a malignant carcinoma, and distinguish early, middle and late CIS tissues based on their adaptations to these toxic challenges.
CIS tissues become malignant carcinomas following rupture of the basement membrane and invasion into the surrounding tissue, a process that may be facilitated by increased acid production following upregulated glycolysis [46]. Low pHe also correlates with resistance to chemotherapy [47] and increased chromosomal instability in vitro [48,49]. Concurrent with the rupture of the basement membrane is the release of pro-angiogenic signals to induce vascularization of the tumor mass by the rapid, dysregulated growth and incursion of characteristically abnormal blood vessels. Blood vessels of a carcinoma are highly permeable, suffer from low pO2, and are extremely disorganized, frequently forming arterio-venous shunts, blind ends, and high angle branches, all contributing to perfusion-limited regional hypoxia [50]. Nonetheless, vascularization of tumor masses produces a rapid, exponential growth phase [51]. Without the vascularization resulting from the induction of angiogenesis, avascularized tumors are limited to a diameter of only a few millimeters [50]. Peri-luminal cells within CIS and in small lesions experience diffusion-limited hypoxia and undergo necrosis [52,53], and acid-mediated apoptosis [53]. In locally invasive cancers, this can be abrogated if the “angiogenic switch” is turned on by the increased expression of angiogenic signals. Notably, the hypoxic-acidic conditions of CIS lesions are not affected by periductal angiogenesis, as reaction-diffusion kinetics are unaltered. However, Vascular Endothelial Growth Factor (VEGF), a potent angiogenic factor, is upregulated in many carcinomas in response to hypoxia or inflammatory cytokines [54]. Subsequently, highly invasive carcinoma cells that have entered the bloodstream following vascularization of the primary lesion may seed a region of healthy tissue distant from the original carcinoma, thereby metastasizing to form a secondary tumor.
Evolutionary Consequences of hypoxia and acidosis
Fluctuating hypoxia may promote CIS maturation by selecting for cells with glycolysis upregulation via repeated, transient hypoxia-reoxygenation injury [55]. Indeed, a systemic switch to anaerobic glycolysis during hypoxia is observed in many organisms, suggesting that hypoxia-sensitive transitions between glycolysis and aerobic metabolism represents a fundamental metabolic signaling pathway common to most air-breathing vertebrates and is subverted during the progression of carcinomas. The development of tumor hypoxia has been shown to be a critical step in tumorigenesis: low tumour pO2 is correlated with poor patient survival and metastasis in soft tissue sarcoma [56], and cyclical hypoxia induces a significant increase in metastasis of KHT-C fibrosarcoma mouse tumours in vivo [50,57] and of BH16 cells in vitro [58].
A general mechanism for the Warburg Effect may be derived from the modeling of cancer populations in terms of Darwinian selection. This is based on the concept of “somatic evolution” which posits that growth challenges provide selective advantages for the evolution of progressively aggressive and invasive phenotypes. Evolutionary potential is greatly enhanced in highly proliferative cell [59], and the hypoxic microenvironment of a CIS may produce sufficient selective pressure for cells to acquire – by Darwinian selection – an upregulation in anaerobic glycolysis. However, it is clear that the persistence of glycolysis even in the face of normoxic conditions (aerobic glycolysis) indicates that glycolytic flux is not simply a response to hypoxia, but must confer a further selective advantage. One possibility is that the acidosis produced by the glycolytic flux, in turn, produces a selective pressure benefitting cells with resistance to acidosis, such as cells with increased H+ transporter activity (e.g. N+/H+ exchanger) [60]. Therefore, cells that are both glycolytically upregulated and resistant to extracellular acidosis possess a selective advantage not only because they are more resistant to the hypoxia of the tumor microenvironment, but actually produce toxic conditions for surrounding cells that have not developed these phenotypes. Furthermore, extracellular acidosis may confer a further advantage by aiding in invasiveness and thus metastasis [61].
Moreover, intermediates of the glycolytic pathway are involved in the pentose phosphate pathway, which plays an essential role in recycling NADPH, a reducing agent critical in anabolic processes such as nucleic acid synthesis. NADPH is also involved in counteracting reactive oxygen species, ROS, which are produced during reperfusion or increased iron metabolism [62]. Therefore, the transition to a glycolytic metabolism strategy may be due to a selective advantage conferred to cells by increased NADPH recycling, thus allowing for enhanced anabolism and/or resistance to ischemic-reperfusion induction of ROS.
Conclusion
The transition from pre-invasive to invasive carcinoma may be closely linked to the CIS microenvironment. Though each carcinoma arises out of a unique series of genomic changes that induce a number of early hallmarks of cancer, the process of carcinogenesis converges on the development of hypoxia and acidosis in a bounded, avascular tumour that occurs as a result of increased cell number and density in a limited, avascular space. This unique microenvironment creates a harsh adaptive landscape that promotes evolution of aggressive and invasive phenotypes through the sequential acquisition of the Warburg Effect and resistance to acid-induced toxicity. These phenotypes develop via upregulation of signaling molecules that may include c-myc and HIF-1 and result in significant phenotypic changes such as increased membrane expression of GLUT1 and NHE1. However, many details in the evolutionary sequence remain to be elucidated by in vivo and in vitro studies. Nevertheless, this model introduces tantalizing new ideas for cancer therapy: new treatments might not only target cells undergoing aggressive aerobic glycolysis (e.g. selectively limiting glucose transport or inhibiting protection from acid-mediated apoptosis), but may actually encourage the adoption of a Warburg Effect phenotype in pre-invasive carcinoma cells in order to improve the efficacy of chemotherapies targeting glycolysis-dependent mechanisms.
Footnotes
Publisher's Disclaimer: This is a PDF file of an unedited manuscript that has been accepted for publication. As a service to our customers we are providing this early version of the manuscript. The manuscript will undergo copyediting, typesetting, and review of the resulting proof before it is published in its final citable form. Please note that during the production process errors may be discovered which could affect the content, and all legal disclaimers that apply to the journal pertain.
References
- 1.Foulds L. The experimental study of tumor progression: a review. Cancer Res. 1954;14:327–339. [PubMed] [Google Scholar]
- 2.Gillies RJ, Gatenby RA. Adaptive landscapes and emergent phenotypes: why do cancers have high glycolysis? J.Bioenerg.Biomembr. 2007;39:251–257. doi: 10.1007/s10863-007-9085-y. [DOI] [PubMed] [Google Scholar]
- 3.Gatenby RA, Gillies RJ. A microenvironmental model of carcingenesis. Nature Rev. Cancer. 2008;8:56–61. doi: 10.1038/nrc2255. [DOI] [PubMed] [Google Scholar]
- 4.Hanahan D, Weinberg RA. The hallmarks of cancer. Cell. 2000;100:57–70. doi: 10.1016/s0092-8674(00)81683-9. [DOI] [PubMed] [Google Scholar]
- 5.Krogh A. The number and distribution of capillaries in muscles with calculations of the oxygen pressure head necessary for supplying the tissue. J.Physiol. 1919;20:409–415. doi: 10.1113/jphysiol.1919.sp001839. [DOI] [PMC free article] [PubMed] [Google Scholar]
- 6.Thomlinson RH, Gray LH. The histological structure of some human lung cancers and the possible implications for radiotherapy. Br.J.Cancer. 1955;9:539–549. doi: 10.1038/bjc.1955.55. [DOI] [PMC free article] [PubMed] [Google Scholar]
- 7.Helmlinger G, Yuan F, Dellian M, Jain RK. Interstitial pH and pO2 gradients in solid tumors in vivo: high-resolution measurements reveal a lack of correlation. Nat.Med. 1997;3:177–182. doi: 10.1038/nm0297-177. [DOI] [PubMed] [Google Scholar]
- 8.Wykoff CC, Beasley N, Watson PH, Campo L, Chia SK, English R, Pastorek J, Sly WS, Ratcliffe P, Harris AL. Expression of the hypoxia-inducible and tumor-associated carbonic anhydrases in ductal carcinoma in situ of the breast. Am J Pathol. 2001;158:1011–1019. doi: 10.1016/S0002-9440(10)64048-5. [DOI] [PMC free article] [PubMed] [Google Scholar]
- 9.Gatenby RA, Gillies RJ. Why do cancers have high aerobic glycolysis? Nat Rev Cancer. 2004;4:891–899. doi: 10.1038/nrc1478. [DOI] [PubMed] [Google Scholar]
- 10.Ramaiah A, Hathaway JA, Atkinson DD. Adenylate as a metabolic regulator. Effect on yeast phosphofructokinase kinetics. J.Biol.Chem. 1964;239:3619–3622. [PubMed] [Google Scholar]
- 11.Passonneau JV, Lowry OH. Phosphofructokinase and the Pasteur effect. Biochem.Biophys.Res.Commun. 1962;20(7):10–15. doi: 10.1016/0006-291x(62)90134-1. [DOI] [PubMed] [Google Scholar]
- 12.Hardie DG. Minireview: the AMP-activated protein kinase cascade: the key sensor of cellular energy status. Endocrinology. 2003;144:5179–5183. doi: 10.1210/en.2003-0982. [DOI] [PubMed] [Google Scholar]
- 13.Hardie DG. Metabolic control: a new solution to an old problem. Curr.Biol. 2000;9(10):R757–R759. doi: 10.1016/s0960-9822(00)00744-2. [DOI] [PubMed] [Google Scholar]
- 14.Russell RR, III, Bergeron R, Shulman GI, Young LH. Translocation of myocardial GLUT-4 and increased glucose uptake through activation of AMPK by AICAR. Am.J.Physiol. 1999;277:643–649. doi: 10.1152/ajpheart.1999.277.2.H643. [DOI] [PubMed] [Google Scholar]
- 15.Cerdan S, Rodrigues TB, Sierra A, Benito M, Fonseca LL, Fonseca CP, Garcia-Martin ML. The redox switch/redox coupling hypothesis. Neurochem.Int. 2006;48:523–530. doi: 10.1016/j.neuint.2005.12.036. [DOI] [PubMed] [Google Scholar]
- 16.Warburg O. On the origin of cancer cells. Science. 1956;123:309–314. doi: 10.1126/science.123.3191.309. [DOI] [PubMed] [Google Scholar]
- 17.Chesney J, Mitchell R, Benigni F, Bacher M, Spiegel L, Al Abed Y, Han JH, Metz C, Bucala R. An inducible gene product for 6-phosphofructo-2-kinase with an AU-rich instability element: role in tumor cell glycolysis and the Warburg effect. Proc.Natl.Acad.Sci.U.S.A. 1999;96:3047–3052. doi: 10.1073/pnas.96.6.3047. [DOI] [PMC free article] [PubMed] [Google Scholar]
- 18.Liao DJ, Dickson RB. c-Myc in breast cancer. Endocr.Relat Cancer. 2000;7:143–164. doi: 10.1677/erc.0.0070143. [DOI] [PubMed] [Google Scholar]
- 19.Dang CV, Resar LM, Emison E, Kim S, Li Q, Prescott JE, Wonsey D, Zeller K. Function of the c-Myc oncogenic transcription factor. Exp.Cell Res. 1999;253:63–77. doi: 10.1006/excr.1999.4686. [DOI] [PubMed] [Google Scholar]
- 20.Land H, Chen AC, Morgenstern JP, Parada LF, Weinberg RA. Behavior of myc and ras oncogenes in transformation of rat embryo fibroblasts. Mol.Cell Biol. 1986;6:1917–1925. doi: 10.1128/mcb.6.6.1917. [DOI] [PMC free article] [PubMed] [Google Scholar]
- 21.Shim H, Dolde C, Lewis BC, Wu CS, Dang G, Jungmann RA, Dalla-Favera R, Dang CV. c-Myc transactivation of LDH-A: implications for tumor metabolism and growth. Proc.Natl.Acad.Sci.U.S.A. 1997;94:6658–6663. doi: 10.1073/pnas.94.13.6658. [DOI] [PMC free article] [PubMed] [Google Scholar]
- 22.Osthus RC, Shim H, Kim S, Li Q, Reddy R, Mukherjee M, Xu Y, Wonsey D, Lee LA, Dang CV. Deregulation of glucose transporter 1 and glycolytic gene expression by c-Myc. J.Biol.Chem. 2000;275:21797–21800. doi: 10.1074/jbc.C000023200. [DOI] [PubMed] [Google Scholar]
- 23.Semenza GL. Regulation of mammalian O2 homeostasis by hypoxia-inducible factor 1. Annu.Rev.Cell Dev.Biol. 1999;15:551–578. doi: 10.1146/annurev.cellbio.15.1.551. [DOI] [PubMed] [Google Scholar]
- 24.Kallio PJ, Pongratz I, Gradin K, McGuire J, Poellinger L. Activation of hypoxia-inducible factor 1alpha: posttranscriptional regulation and conformational change by recruitment of the Arnt transcription factor. Proc.Natl.Acad.Sci.U.S.A. 1997;94:5667–5672. doi: 10.1073/pnas.94.11.5667. [DOI] [PMC free article] [PubMed] [Google Scholar]
- 25.Wang GL, Jiang BH, Rue EA, Semenza GL. Hypoxia-inducible factor 1 is a basic-helix-loop-helix-PAS heterodimer regulated by cellular O2 tension. Proc.Natl.Acad.Sci.U.S.A. 1995;92:5510–5514. doi: 10.1073/pnas.92.12.5510. [DOI] [PMC free article] [PubMed] [Google Scholar]
- 26.Wang GL, Semenza GL. General involvement of hypoxia-inducible factor 1 in transcriptional response to hypoxia. Proc.Natl.Acad.Sci.U.S.A. 1993;90:4304–4308. doi: 10.1073/pnas.90.9.4304. [DOI] [PMC free article] [PubMed] [Google Scholar]
- 27.Bergeron M, Yu AY, Solway KE, Semenza GL, Sharp FR. Induction of hypoxia-inducible factor-1 (HIF-1) and its target genes following focal ischaemia in rat brain. Eur.J.Neurosci. 1999;11:4159–4170. doi: 10.1046/j.1460-9568.1999.00845.x. [DOI] [PubMed] [Google Scholar]
- 28.Jiang BH, Semenza GL, Bauer C, Marti HH. Hypoxia-inducible factor 1 levels vary exponentially over a physiologically relevant range of O2 tension. Am.J.Physiol. 1996;271:C1172–C1180. doi: 10.1152/ajpcell.1996.271.4.C1172. [DOI] [PubMed] [Google Scholar]
- 29.Jiang BH, Rue E, Wang GL, Roe R, Semenza GL. Dimerization, DNA binding, and transactivation properties of hypoxia-inducible factor 1. J.Biol.Chem. 1996;271:17771–17778. doi: 10.1074/jbc.271.30.17771. [DOI] [PubMed] [Google Scholar]
- 30.Salceda S, Caro J. Hypoxia-inducible factor 1alpha (HIF-1alpha) protein is rapidly degraded by the ubiquitin-proteasome system under normoxic conditions. Its stabilization by hypoxia depends on redox-induced changes. J.Biol.Chem. 1997;272:22642–22647. doi: 10.1074/jbc.272.36.22642. [DOI] [PubMed] [Google Scholar]
- 31.Ke Q, Costa M. Hypoxia-inducible factor-1 (HIF-1) Mol.Pharmacol. 2006;70:1469–1480. doi: 10.1124/mol.106.027029. [DOI] [PubMed] [Google Scholar]
- 32.Metzen E, Berchner-Pfannschmidt U, Stengel P, Marxsen JH, Stolze I, Klinger M, Huang WQ, Wotzlaw C, Hellwig-Bürgel T, Jelkmann W, Acker H, Fandrey J. Intracellular localisation of human HIF-1 alpha hydroxylases: implications for oxygen sensing. J Cell Sci. 2003;116:1319–1326. doi: 10.1242/jcs.00318. [DOI] [PubMed] [Google Scholar]
- 33.Semenza GL, Nejfelt MK, Chi SM, Antonarakis SE. Hypoxia-inducible nuclear factors bind to an enhancer element located 3' to the human erythropoietin gene. Proc.Natl.Acad.Sci.U.S.A. 1991;88:5680–5684. doi: 10.1073/pnas.88.13.5680. [DOI] [PMC free article] [PubMed] [Google Scholar]
- 34.Chen C, Pore N, Behrooz A, Ismail-Beigi F, Maity A. Regulation of glut1 mRNA by hypoxia-inducible factor-1. Interaction between H-ras and hypoxia. J.Biol.Chem. 2001;276:9519–9525. doi: 10.1074/jbc.M010144200. [DOI] [PubMed] [Google Scholar]
- 35.Lu H, Forbes RA, Verma A. Hypoxia-inducible factor 1 activation by aerobic glycolysis implicates the Warburg effect in carcinogenesis. J.Biol.Chem. 2002;277:23111–23115. doi: 10.1074/jbc.M202487200. [DOI] [PubMed] [Google Scholar]
- 36.Folkman J. Angiogenesis. Annu Rev Med. 2006;57:1–18. doi: 10.1146/annurev.med.57.121304.131306. [DOI] [PubMed] [Google Scholar]
- 37.Nelson CM, Bissell MJ. Of extracellular matrix, scaffolds, and signaling: tissue architecture regulates development, homeostasis, and cancer. Annu Rev Cell Dev Biol. 2006;22:287–309. doi: 10.1146/annurev.cellbio.22.010305.104315. [DOI] [PMC free article] [PubMed] [Google Scholar]
- 38.Fearon ER, Vogelstein B. A genetic model for colorectal tumorigenesis. Cell. 1990;61:759–767. doi: 10.1016/0092-8674(90)90186-i. [DOI] [PubMed] [Google Scholar]
- 39.Beckman RA, Loeb LA. Genetic instability in cancer: theory and experiment. Semin Cancer Biol. 2005;15:423–435. doi: 10.1016/j.semcancer.2005.06.007. [DOI] [PubMed] [Google Scholar]
- 40.Gatenby RA, Vincent T, Gillies R. Evolutionary Dynamics in Carcinogenesis. Mathematical Models and Methods in Applied Sciences. 2005;15:1–20. [Google Scholar]
- 41.Lamlum H, Papadopoulou A, Ilyas M, Rowan A, Gillet C, Hanby A, Talbot I, Bodmer W, Tomlinson I. APC mutations are sufficient for the growth of early colorectal adenomas. Proc Natl Acad Sci U S A. 2000;97(5):2225–2228. doi: 10.1073/pnas.040564697. [DOI] [PMC free article] [PubMed] [Google Scholar]
- 42.Dubina MV, Iatckii NA, Popov DE, Vasil'ev SV, Krutovskikh VA. Connexin 43, but not connexin 32, is mutated at advanced stages of human sporadic colon cancer. Oncogene. 2002;21:4992–4996. doi: 10.1038/sj.onc.1205630. [DOI] [PubMed] [Google Scholar]
- 43.Hirschi KK, Xu CE, Tsukamoto T, Sager R. Gap junction genes Cx26 and Cx43 individually suppress the cancer phenotype of human mammary carcinoma cells and restore differentiation potential. Cell Growth Differ. 1996;7:861–870. [PubMed] [Google Scholar]
- 44.Nahta R, Esteva FJ. Bcl-2 antisense oligonucleotides: a potential novel strategy for the treatment of breast cancer. Semin.Oncol. 2003;30:143–149. doi: 10.1053/j.seminoncol.2003.08.016. [DOI] [PubMed] [Google Scholar]
- 45.Hayflick L. Mortality and immortality at the cellular level. A review. Biochemistry (Mosc.) 1997;62:1180–1190. [PubMed] [Google Scholar]
- 46.Gatenby RA, Gawlinski ET, Gmitro AF, Kaylor B, Gillies RJ. Acid-mediated tumor invasion: a multidisciplinary study. Cancer Res. 2006;66:5216–5223. doi: 10.1158/0008-5472.CAN-05-4193. [DOI] [PubMed] [Google Scholar]
- 47.Raghunand N, Gillies RJ. pH and drug resistance in tumors. Drug Resist.Updat. 2000;3:39–47. doi: 10.1054/drup.2000.0119. [DOI] [PubMed] [Google Scholar]
- 48.Morita T. Low pH leads to sister-chromatid exchanges and chromosomal aberrations, and its clastogenicity is S-dependent. Mutat.Res. 1995;334:301–308. doi: 10.1016/0165-1161(95)90067-5. [DOI] [PubMed] [Google Scholar]
- 49.Morita T, Nagaki T, Fukuda I, Okumura K. Clastogenicity of low pH to various cultured mammalian cells. Mutat.Res. 1992;268:297–305. doi: 10.1016/0027-5107(92)90235-t. [DOI] [PubMed] [Google Scholar]
- 50.Cairns RA, Kalliomaki T, Hill RP. Acute (cyclic) hypoxia enhances spontaneous metastasis of KHT murine tumors. Cancer Res. 2001;61:8903–8908. [PubMed] [Google Scholar]
- 51.Gimbrone MA, Jr, Leapman SB, Cotran RS, Folkman J. Tumor dormancy in vivo by prevention of neovascularization. J.Exp.Med. 1972;136:261–276. doi: 10.1084/jem.136.2.261. [DOI] [PMC free article] [PubMed] [Google Scholar]
- 52.Brem S, Brem H, Folkman J, Finkelstein D, Patz A. Prolonged tumor dormancy by prevention of neovascularization in the vitreous. Cancer Res. 1976;36:2807–2812. [PubMed] [Google Scholar]
- 53.Schmaltz C, Hardenbergh PH, Wells A, Fisher DE. Regulation of proliferation-survival decisions during tumor cell hypoxia. Mol.Cell Biol. 1998;18:2845–2854. doi: 10.1128/mcb.18.5.2845. [DOI] [PMC free article] [PubMed] [Google Scholar]
- 54.Ribatti D, Conconi MT, Nussdorfer GG. Nonclassic endogenous regulators of angiogenesis. Pharmacol.Rev. 2007;59:185–205. doi: 10.1124/pr.59.2.3. [DOI] [PubMed] [Google Scholar]
- 55.Kimura H, Braun RD, Ong ET, Hsu R, Secomb TW, Papahadjopoulos D, Hong K, Dewhirst MW. Fluctuations in red cell flux in tumor microvessels can lead to transient hypoxia and reoxygenation in tumor parenchyma. Cancer Res. 1996;56:5522–5528. [PubMed] [Google Scholar]
- 56.Brizel DM, Scully SP, Harrelson JM, Layfield LJ, Bean JM, Prosnitz LR, Dewhirst MW. Tumor oxygenation predicts for the likelihood of distant metastases in human soft tissue sarcoma. Cancer Res. 1996;56:941–943. [PubMed] [Google Scholar]
- 57.Young SD, Marshall RS, Hill RP. Hypoxia induces DNA overreplication and enhances metastatic potential of murine tumor cells. Proc.Natl.Acad.Sci.U.S.A. 1988;85:9533–9537. doi: 10.1073/pnas.85.24.9533. [DOI] [PMC free article] [PubMed] [Google Scholar]
- 58.Stackpole CW, Groszek L, Kalbag SS. Benign-to-malignant B16 melanoma progression induced in two stages in vitro by exposure to hypoxia. J.Natl.Cancer Inst. 1994;86:361–367. doi: 10.1093/jnci/86.5.361. [DOI] [PubMed] [Google Scholar]
- 59.Gatenby RA, Gillies RJ. Glycolysis in cancer: A potential target for therapy. Int.J.Biochem.Cell Biol. 2007;39:1358–1366. doi: 10.1016/j.biocel.2007.03.021. [DOI] [PubMed] [Google Scholar]
- 60.Gatenby RA, Smallbone K, Maini PK, Rose F, Averill J, Nagle RB, Worrall L, Gillies RJ. Cellular adaptations to hypoxia and acidosis during somatic evolution of breast cancer. Br J Cancer. 2007;97(5):646–653. doi: 10.1038/sj.bjc.6603922. [DOI] [PMC free article] [PubMed] [Google Scholar]
- 61.Gatenby RA, Vincent TL. An evolutionary model of carcinogenesis. Cancer Res. 2003;63:6212–6220. [PubMed] [Google Scholar]
- 62.Kondoh H, Lleonart Me, Bernard D, Gil J. Protection from oxidative stress by enhanced glycolysis; a possible mechanism of cellular immortalization. Histol.Histopathol. 2007;22(1):85–90. doi: 10.14670/HH-22.85. [DOI] [PubMed] [Google Scholar]


