

Abstract
Objective
The goal of this study was to measure the solid and liquid volume and mass of canine vocal fold lamina propria tissue at varying dehydration levels and to calculate parameters to test the biphasic theory of vocal fold physiology and biomechanics.
Study Design
Open controlled experimental trial
Methods
The vocal fold lamina propria was dissected from 15 canine larynges, yielding 30 tissue samples. The initial volumes and masses of the tissue samples were measured. The masses of the tissue samples were then measured every 2 minutes during 30%, 50%, and 70% dehydration, with 10 samples subjected to each of the 3 treatments, followed by complete dehydration to yield the solid component of the tissue. The liquid mass and volume fractions and liquid:solid mass and volume ratios of the vocal fold lamina propria samples were calculated.
Results
The liquid mass and volume fractions and liquid:solid mass and volume ratios were significantly different at each dehydration level, except for the liquid:solid volume ratios at 30% vs. 50% dehydration. Linear regression analysis suggested that all of the solid and liquid parameters measured could be predicted by dehydration level based on inverse, linear relationships.
Conclusions
These results provide further experimental evidence supporting the biphasic theory and suggest that the extent of vocal fold lamina propria tissue dehydration may be quantified based on the biphasic model parameters.
Keywords: Vocal fold lamina propria, dehydration, biphasic tissue parameters
Introduction
The hydration level of laryngeal tissue has a significant impact on vocal function. The impact of laryngeal tissue hydration on voice production has been proposed to be caused by the altered mobility and deformability of the vocal fold (VF) mucosa.1 At decreased hydration levels, the force on the VFs during phonation may increase, at times resulting in laryngeal polyps, nodules, and Reinke’s edema.2 When the hydration level decreases in the laryngeal mucosa, the VFs become stickier and vibrate less freely than at normal hydration levels.3 Factors that can potentially cause vocal tissue dehydration include inhalation of dry air or tobacco, alcohol or caffeine use, oral breathing, unbalanced liquid transport from the circulatory system to the vocal tissue, and medications such as anti-histamines, corticosteroids, and diuretics.2,4,5,6 Thus, hydration must be considered at the systemic, VF tissue, and VF surface levels in order to accurately assess the impact of change in hydration levels on rheological characteristics.
Verdolini-Marston et al. found that dehydration induced by oral medication, dehumidified air, and reduced water consumption increased the phonation threshold pressures (PTP) in human subjects.7 Verdolini et al. investigated the effects of systemic and secretory dehydration on PTP. She and her colleagues found that systemic dehydration can mediate an increase in PTP, while the effect of secretory dehydration on PTP was unclear.8 Finkelhor et al. examined the effect of VF hydration on PTP by inducing liquid movement into and out of excised canine VFs. The evidence suggested that decreased hydration raised PTP.9 Sivasankar et al. confirmed the same effect on PTP by oral breathing, which superficially dehydrates the airway lumen.10 With canine models, Jiang et al. used excised larynges to examine the effect of dehydration on vocal efficiency.1 They found that dehydration leads to increased PTP, increased mean glottal flow at constant suprathreshold subglottal pressure, and decreased vocal efficiency.1 Hemler et al. found that when dry air was inhaled by human subjects, acoustic perturbation measures increased compared to normal and humidified air.5 Witt et al. found that surface dehydration of excised canine VFs led to an increase in phonation threshold flow (PTF), which is a parameter dependent on the biomechanical properties of the larynx and related to PTP.11 One common hypothesis, posed by Chan and Tayama, is that hydration affects VF tissue parameters through a biomechanical process, changing the elasticity and viscosity of the VF tissues.2 Dehydration significantly increased the elastic shear modulus (G′) and the dynamic viscosity (ή) of the VF tissue.2,12 Increased viscosity due to dehydration led to an increase in energy loss during VF vibration, thus requiring increased energy and vocal effort, to produce phonation. Therefore, changes in rheologically-dependent parameters such as PTP, PTF, mean flow rate, acoustic intensity, and vocal efficiency can be linked to changes in the physical properties of the tissue.
Previous studies involving the hydration state of the larynx have focused on the viscoelastic properties such as the stress-strain relationship and shear; however, our literature search has failed to find studies that have considered the liquid-solid volume and mass ratios of the laryngeal tissue. There has also been limited research towards the physiological and biomechanical mechanisms associated with the effects of laryngeal hydration. Single-phase solid VF models proposed in the past have been used to model laryngeal tissue.2,13,14,15,16,17 However, these single-phase models may not be sufficient to describe laryngeal function as many laryngeal tissues are composed of a biphasic liquid and solid phase.18 The lamina propria (LP), which constitutes the intermediate layer of the VF, is highly hydrated and composed of collagen fibers, elastin, and proteoglycans.19 Given the liquid and solid phase components of the LP, a biphasic theory has been proposed to describe its viscoelastic properties.18 This theory suggests that the solid and interstitial liquid phases of the laryngeal tissue interact, with the liquid supporting the majority of stress at early stress-relaxation, and the solid phase bearing more stress over time.18 This biphasic theory has implications for the effects of dehydration on laryngeal tissue damage and decreased vocal efficiency.18 In order to better apply this biphasic theory to VF modeling, parameters such as the liquid:solid volume and mass ratios, effects of hydration, and stress-strain must be quantified. When dehydrating laryngeal tissue, previous studies have used methods such as using hot air dryers and hypertonic solutions.20,21,22 Air with 20–30% humidity dehydrates the epithelium to an extent where phonation no longer occurs.1 Isotonic solution, typically 0.9% saline solution, is used to store laryngeal tissue and prevents a net diffusion of ions and water into and out of the tissue. While these studies have identified hydration as a variable affecting phonation, they have not quantified the degree of dehydration obtained through incremental drying of the tissue. This makes the study and quantification of dehydration essential to rheological investigations.
This study investigated some of the parameters of the biphasic theory applied to dehydration of canine VF LP: the liquid:solid volume and mass ratios and liquid volume and mass fractions. The results of this study support the biphasic theory and describe the relationship between the liquid and solid components of LP tissue at varying degrees of dehydration. Tissue samples from excised canine larynges from healthy canines sacrificed for other purposes were used in this study. The volume and mass of the LP sample before and during dehydration was measured at 30%, 50%, and 70% dehydration levels. By quantifying how dehydration affects rheological parameters such as liquid mass and volume fractions and liquid:solid mass and volume ratios, the physical changes in the tissue contributing to the changes in phonation with dehydration were explored.
Materials and Methods
Tissue sample preparation
Fifteen larynges were harvested from healthy laboratory dogs not sacrificed for this study. A tissue sample was extracted from each of the bilateral VFs. Larynges were excised and prepared according to the method described by Jiang and Titze.23 Larynges were placed in a 0.9% saline solution with density ρsa of 1.004 g/mL, frozen, and stored at −12 °C. The larynges were thawed the day of each experiment and kept in 0.9% saline according to the procedure described by Chan and Titze found to minimize post mortem changes in VF tissue.24 Each VF LP tissue sample was dissected out en block using a scalpel, with the anterior border 1 mm posterior to the anterior commissure, the posterior border 1 mm anterior to the arytenoid cartilage, the inferior border 5 mm inferior to the superior glottic edge, and the lateral border 5 mm lateral to the glottic edge (Figure 1). The thyroarytenoid muscle was then dissected away from the LP using a scalpel under a dissecting microscope. The epithelium was included in each sample in order to preserve the entire superficial LP. The samples were placed in 0.9% saline and allowed to equilibrate for 10 minutes before further handling.
Figure 1.
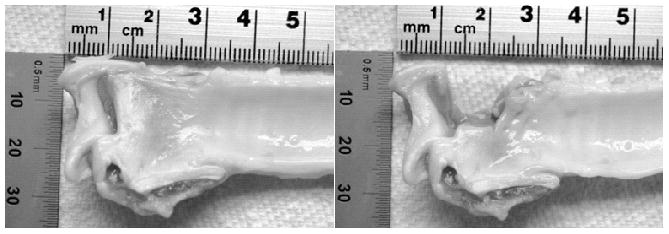
Picture of a left canine hemilarynx with the vocal fold before (left) and after (right) vocal fold dissection en block using a scalpel.
Volume measurement
A tube apparatus was designed in combination with a sample vial in order to accurately measure small volumes using liquid displacement as in a previous study.21 Briefly, a 0.3–0.4mL bolus of 0.9% saline solution was inserted into the tubing of known diameter, and the volume of this bolus was calculated. The canine VF LP tissue sample was then placed in the sample vial and sealed. Using a syringe, the 0.9% saline bolus was pushed into the sample vial, and the LP tissue sample displaced a certain amount of liquid. The displaced liquid volume was measured as the volume of saline solution greater than the known empty sample vial volume of 0.618 mL. The volume of liquid displaced by the tissue sample is equal to the tissue sample volume, VLP. This liquid displacement method used to measure the tissue sample volumes was described and validated using copper samples of known density and volume in our previous study.21 During the experiment the volume measurement was repeated on each tissue sample twice to ensure consistency.
Change in mass with dehydration
Following the excision, the tissue samples were transferred to aluminum weighing dishes (Thermo Fisher Scientific, Waltham, MA). The VF LP samples were weighed using an electronic balance (Ohaus Corporation, Pine Brook, NJ) accurate to the milligram and placed into a vacuum oven (Isotemp Model 280A, Thermo Fisher Scientific, Waltham, MA) heated to 40° C. Unlike the dehydration methods employed by other studies, this was believed to dehydrate the tissue beyond the epithelium and therefore more closely model physiological systemic tissue dehydration. Tissue samples were dehydrated to 30%, 50%, and 70% of the control condition mass. These percentages were chosen for this methodological study to provide a wide range of dehydration values for establishing relationships between the biphasic parameters and dehydration level. While the dehydration levels are nonphysiological even in highly pathological states, these levels were attained repeatedly. Due to the rapid decrease in mass of the vocal fold lamina propria during the initial stages of dehydration, lesser dehydration levels could not be attained repeatedly.
During the dehydration treatments, the samples were removed from the vacuum oven every two minutes and weighed. The mass was recorded and used to determine the percent dehydration by mass, which was computed by dividing the new mass by the original mass of the sample. This process continued until the sample was dehydrated to the desired mass percent.
Calculations
The definitions and computations of the following parameters were presented in our previous study.21 The tissue was kept in the vacuum oven until it maintained a constant mass, which was denoted ms, as the dried solid component of the LP. Figure 2 shows a typical VF LP tissue sample before and after complete dehydration. The difference between the original mass of the VF LP tissue (mLP) and the dry solid component mass represents the loss of liquid from the tissue. The mass of the liquid component (ml) is computed by ml = mLP − ms. We defined the solid mass fraction ( ) as the fraction of the total mass represented by the solid component, and the liquid mass fraction ( ) as the fraction of the total mass represented by the liquid component. From the measured ms and mLP, we then can determine and :
| (1) |
Figure 2.
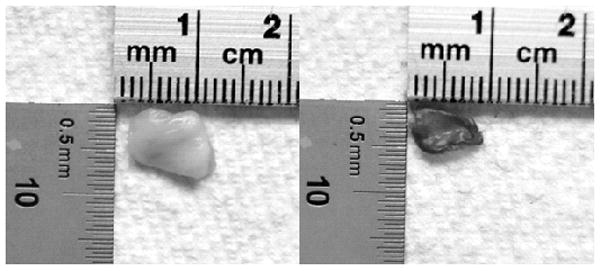
Pictures of canine vocal fold lamina propria (VF LP) tissue sample before (left) and after (right) complete dehydration.
These parameters satisfy . We can also determine the liquid:solid mass ratio ( ) as
| (2) |
The porous VF LP tissue was immersed in 0.9% saline, which mimicked the density and osmolarity of liquid in the tissue. The saline is considered to be isotonic to the tissue, preventing a net osmotic diffusion of water into or out of the tissue. Since liquid in the tissue can be assumed to be in equilibrium with the saline, we assumed that the liquid density ρl approached the density 1.004 g/mL of the saline solution and was uniform throughout the VF LP. The liquid volume is then calculated as Vl = (mLP − ms)/ρl. The difference between the original volume of the VF LP tissue sample and the liquid volume gives the solid volume as Vs = VLP − Vl. We defined the solid volume fraction ( ) as the fraction of the total volume represented by the solid component, and the liquid volume fraction ( ) as the fraction of the total volume occupied by the liquid phase. Thus, from the measured ms, mLP, and original volume VLP of the lamina propria, we can determine and :
| (3) |
These parameters satisfy and . We can also determine the liquid:solid volume ratio ( ) as,
| (4) |
This equation assumes that the liquid component of the tissue sample is completely saline solution.
Data Analysis
Data were analyzed and graphed using SigmaPlot v11.0 (Systat Software, Chicago, IL). For data that passed normality and equal variance tests, one way ANOVAs were used to determine if there was a statistically significant difference in the means of the parameters among the three dehydration treatments. The one way ANOVA was followed by a multiple comparison procedure using the Holm-Sidak method for pair-wise comparisons. For data that failed the normality or equal variance tests, Kruskal-Wallis one way ANOVA on ranks tests were used to determine if there was a statistically significant difference in the median values among the three dehydration treatments. The Kruskal-Wallis One Way ANOVA on Ranks was followed by the multiple comparisons Tukey Test to isolate the specific group or groups that differ from the others. Linear regression was also performed to determine if dehydration level could predict the parameter values and to determine the best fit line for the data. For all statistical tests performed, a significance level of α = 0.05 was used.
Results
The average variation of the volume measurements was 5.52% of the total tissue volume. The typical liquid:solid volume and mass ratios of a tissue sample undergoing 70% dehydration are shown in Figure 3 and Figure 4, respectively, with a nonlinear regression performed and graphed. Box plots for the liquid mass fractions at the respective dehydration level for each treatment are shown in Figure 5. The Holm-Sidak method suggested that all treatments had statistically significant differences in mean liquid mass fractions (p<0.001). Linear regression analysis suggested that the liquid mass fractions could be predicted by the dehydration level (R2=0.933, p<0.001). Box plots for the liquid:solid mass ratios at each dehydration level are shown in Figure 6. The Tukey Test suggested that all treatments had significantly different median liquid:solid mass ratios (p<0.05). Linear regression analysis suggested that the liquid:solid mass ratios could be predicted from the dehydration level (R2=0.8999, p<0.001). Figure 7 displays box plots for the liquid volume fractions at the three dehydration levels. The Holm-Sidak method suggested that all treatments had statistically significant mean liquid volume fractions (p<0.05). Linear Regression analysis suggested that the liquid volume fractions could be predicted from the dehydration level (R2=0.85, p<0.001). Box plots for the liquid:solid volume ratios for each treatment are shown in Figure 8. The Tukey test suggested that the differences in median liquid:solid volume ratios for 30% vs. 70% dehydration and 50% vs. 70% dehydration were significant (p<0.05), and for 30% vs. 50% dehydration were not significant (p>0.05). Linear regression analysis suggested that the liquid:solid volume ratio could be predicted from the dehydration level (R2=0.704, p<0.001). Table I displays the equations, R2 values, and p-values for the linear regression lines depicted in Figure 9.
Figure 3.
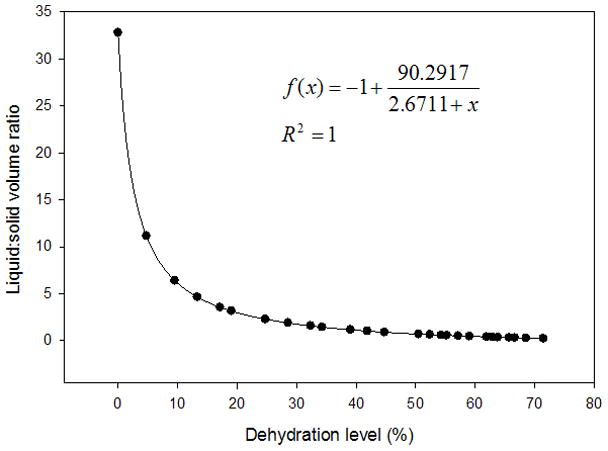
Scatter plot displaying the liquid:solid volume ratios of a typical vocal fold lamina propria (VF LP) tissue sample dehydrated to 70% of its original mass. Nonlinear hyperbolic decay regression was performed and plotted with the given equation. Mass measurements were taken every two minutes during dehydration of the tissue sample in a vacuum oven set to 40°C.
Figure 4.
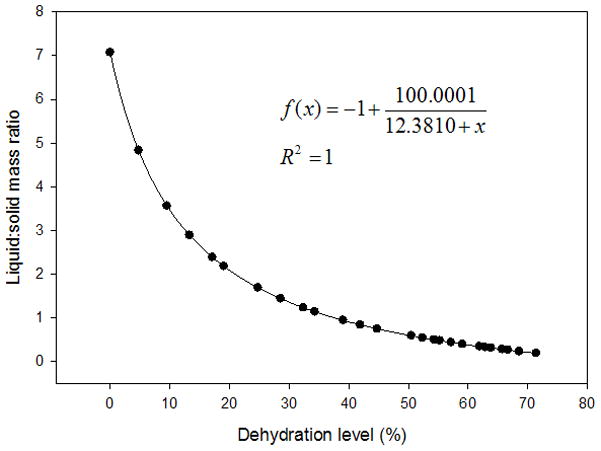
Scatter plot displaying the liquid:solid mass ratios of a typical vocal fold lamina propria (VF LP) tissue sample dehydrated to 70% of its original mass. Nonlinear hyperbolic decay regression was performed and plotted with the given equation. Mass measurements were taken every two minutes during dehydration of the tissue sample in a vacuum oven set to 40°C.
Figure 5.
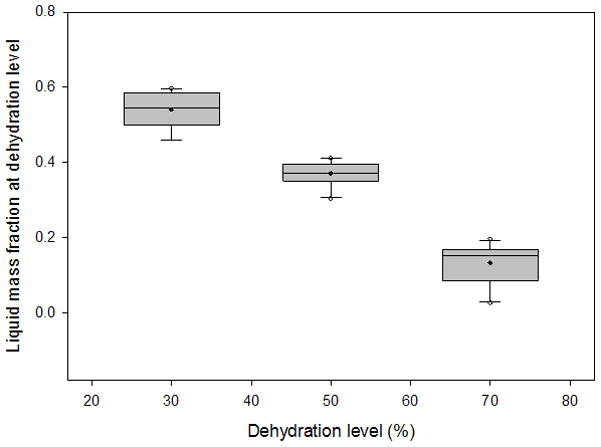
Box plots depicting the distribution of liquid mass fractions from 3 sets of 10 vocal fold lamina propria (VF LP) tissue samples at 30%, 50%, and 70% dehydration. Filled circles represent the mean, horizontal lines inside the boxes mark the median, error bars show the 5th and 95th percentiles, and unfilled circles show outliers.
Figure 6.
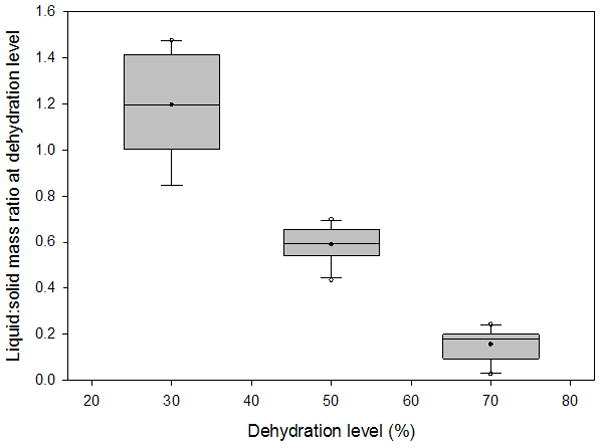
Box plots depicting the distribution of liquid:solid mass ratios from 3 sets of 10 vocal fold lamina propria (VF LP) tissue samples at 30%, 50%, and 70% dehydration. Filled circles represent the mean, horizontal lines inside the boxes mark the median, error bars show the 5th and 95th percentiles, and unfilled circles show outliers.
Figure 7.
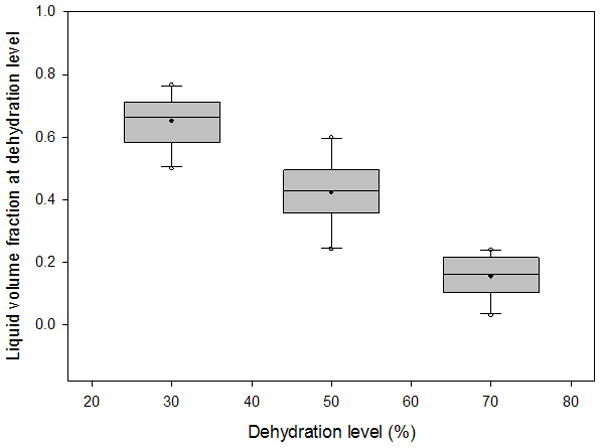
Box plots depicting the distribution of liquid volume fractions from 3 sets of 10 vocal fold lamina propria (VF LP) tissue samples at 30%, 50%, and 70% dehydration. Filled circles represent the mean, horizontal lines inside the boxes mark the median, error bars show the 5th and 95th percentiles, and unfilled circles show outliers.
Figure 8.
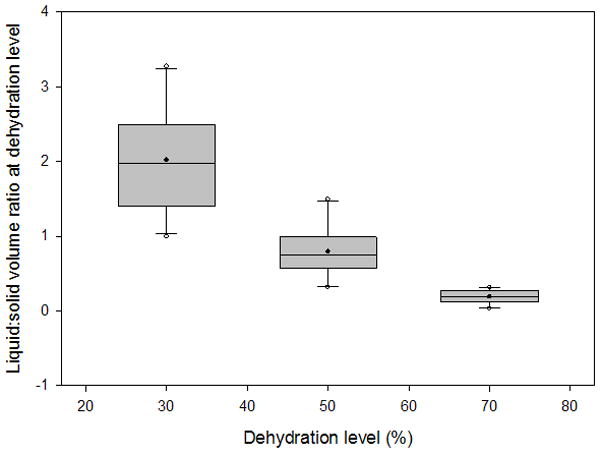
Box plots depicting the distribution of liquid:solid volume ratios from 3 sets of 10 vocal fold lamina propria (VF LP) tissue samples at 30%, 50%, and 70% dehydration. Filled circles represent the means, horizontal lines inside the boxes mark the medians, error bars show the 5th and 95th percentiles, and unfilled circles show outliers.
Table I.
Linear regression equations, correlations, and linear regression analysis p-values for dehydration level vs. biphasic parameters. P-values less than 0.05 suggest that the corresponding parameter is significantly correlated with the dehydration level.
| Parameter | Equation (x=dehydration level, f(x)=parameter) | Correlation | P-value |
|---|---|---|---|
| Liquid:solid volume ratio | f (x) = 3.2122 − 0.0442x | R2 = 0.704 | p < 0.001 |
| Liquid volume fraction | f (x) =1.0153 − 0.0121x | R2 = 0.850 | p < 0.001 |
| Liquid:solid mass ratio | f (x) =1.9198 − 0.0254x | R2 = 0.8999 | p < 0.001 |
| Liquid mass fraction | f (x) = 0.8462 − 0.01x | R2 = 0.9330 | p < 0.001 |
Figure 9.
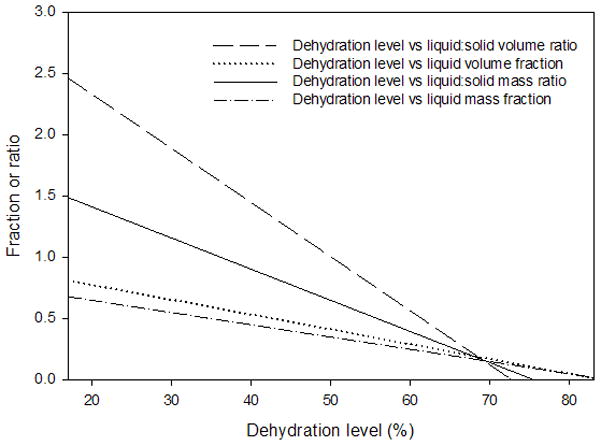
Linear regression lines for all variables examined from 3 sets of 10 vocal fold lamina propria (VF LP) tissue samples at 30%, 50%, and 70% dehydration. Equations, R2 values, and p-values for each regression line are given in Table I.
Discussion
The linear, inverse relationships detected between dehydration level and all of the dependent variables, liquid mass and volume fraction, liquid:solid mass and volume ratios, suggested that these innate VF LP tissue parameters may be used to quantify dehydration. In the lab setting, we have shown that all of these parameters were significantly correlated with dehydration level (p-values<0.001). Quantifying these parameters was a necessary step in the development of the biphasic theory; in order to establish robust mathematical models for the biphasic theory, parameters such as the liquid mass and volume fractions, and liquid:solid mass and volume ratios need to be quantified experimentally before they can be used in the mathematical models. The biphasic theory explains the solid-liquid interaction in the VF LP, and more accurately explains the stress relaxation behavior of the VF tissue than previous solid phase models. Zhang et al. presented biphasic equations that suggested that dehydration increases VF tissue stiffness, because dehydration decreases tissue permeability by collapsing the solid structure and reducing pore size.18 Thus, understanding the influence of dehydration on biphasic parameters is necessary to fully understand the viscoelastic and functional properties of VF LP tissue during dehydration.
The results we obtained were in close agreement to previous hypothesis, as increased dehydration levels corresponded with decreased liquid mass and volume fractions and liquid:solid mass and volume ratios. Our previous study found that the liquid mass and volume components of VF LP tissue were more prevalent than the solid components.21 As shown in Figures 5 and 7, at 50% and 70% dehydration we found that the solid component was more prevalent than the liquid component as the liquid volume and mass fractions were below 0.5 at both of these dehydration levels. These results are intuitive, as dehydration of the tissue was expected to result in a loss of liquid while the solid component remained constant. Nevertheless, it was necessary to confirm this assumption for accurate calculations of the liquid and solid components solely based on the measured mass and volume of the tissue samples. Another assumption used for our calculations was that the density of the liquid component ρl of the VF LP tissue sample approached the density of the saline solution ρsa. The average density of the entire VF LP tissue samples ρLP was 1.1736 g/ml and the density of the saline solution ρsa was 1.0004 g/ml, resulting in a relative density difference |ρsa − ρLP|/ρLP of 14%. ρLP accounts for the density of the combined liquid and solid components of the VF LP tissue. Thus, we would expect ρLP to be greater than ρsa, as observed, since the solid component of the LP tissue was expected to have a higher density than the liquid component, which was assumed to approach ρsa in equilibrium.
A major limitation of our study was the in vitro manipulation of the VF LP tissue to measure parameters for modeling the in vivo biomechanics and physiology of VF LP tissue. The conditions that we imposed on the tissue samples including dehydration and excision may not have mimicked systemic dehydration and the physiologic tissue response to these conditions. However, by using a vacuum oven for dehydration we attempted to dehydrate both the internal and surface components of the VF LP as would be expected with systemic dehydration. Following excision, the tissue samples were allowed to equilibrate in 0.9% saline solution which is isotonic and has been found to minimize post mortem changes in VF tissue.24 While it may have been ideal to induce dehydration directly after excision from the canine specimen, the larynges were obtained from an outside source sacrificing the canines for other purposes. Thus, the larynges needed to be stored in 0.9% saline solution, frozen, and transported. Additionally, the postmortem changes in the vocal fold tissue were minimized by following the procedure described by Chan and Titze for thawing and maintaining the tissue in 0.9% saline.24 The authors found that neither preservation of vocal fold tissue in 0.9% saline at room temperature nor quick freezing of the larynges followed by thawing affected vocal fold properties. The excision process may have slightly altered the solid and liquid fractions and properties of the tissue; however, great care was taken in excision of the tissue, removal of the vocalis muscle under a dissecting microscope, and preservation of the entire superficial VF LP.
Hydration is an important property necessary for proper vocal function and physiology. Understanding the dynamics of the VF LP tissue is also important clinically, because most vocal lesions originate in the LP.19 The relationships that we examined in VF LP tissue may contribute to the mathematical modeling and understanding of the biphasic theory and help develop a relationship between dehydration and the solid and liquid components of the VFs. Future studies should measure the liquid and solid parameters of VF LP and vocalis muscle at more physiological dehydration levels and upon rehydration. A fractioned test with multiple physiological dehydration levels between 0% and 15% should be performed to test the linear trends established in this study. Since the VF LP tissue loses mass abruptly in the physiological dehydration range, in order to obtain repeatable dehydration levels the temperature of dehydration would need to be decreased from the 40°C used in this study.
Conclusion
In this study, the liquid volume and mass fractions and liquid:solid volume and mass ratios were calculated from 3 sets of 10 canine vocal fold lamina propria (VF LP) tissue samples after 30%, 50%, and 70% dehydration treatments. The liquid and solid parameters were calculated by measuring the tissue samples’ initial volumes and the masses throughout the dehydration process. All of the calculated parameters are correlated to dehydration level based on linear, inverse relationships. At 30% dehydration, the liquid component of the VF LP tissue is more massedly and volumetrically prevalent, and at 50% and 70% dehydration, the solid component is more prevalent. These results provide further evidence supporting the biphasic composition theory of the LP tissue, and the tissue parameters we measured and calculated quantify dehydration of VF LP tissue and may be used to better model vocal fold vibratory behavior and physiology.
Acknowledgments
This study was supported by NIH Grant No. 1-R01DC05522 from the National Institute on Deafness and other Communication Disorders.
Footnotes
Conflict of Interest: None
References
- 1.Jiang J, Verdolini K, Aquino B, Ng J, Hanson D. Effects of dehydration on phonation in excised canine larynges. Ann Otol Rhinol Laryngol. 2000;109(6):568–75. doi: 10.1177/000348940010900607. [DOI] [PubMed] [Google Scholar]
- 2.Chan RW, Tayama N. Biomechanical effects of hydration in vocal fold tissues. Otolaryngol Head Neck Surg. 2002;126(5):528–37. doi: 10.1067/mhn.2002.124936. [DOI] [PubMed] [Google Scholar]
- 3.Ayache S, Ouaknine M, Dejonkere P, Prindere P, Giovanni A. Experimental study of the effects of surface mucus viscosity on the glottic cycle. J Voice. 2004;18(1):107–15. doi: 10.1016/j.jvoice.2003.07.004. [DOI] [PubMed] [Google Scholar]
- 4.Akhtar S, Wood G, Rubin JS, O’Flynn PE, Ratcliffe P. Effect of caffeine on the vocal folds: A pilot study. J Laryngol Otol. 1999;113(4):341–5. doi: 10.1017/s0022215100143920. [DOI] [PubMed] [Google Scholar]
- 5.Hemler RJ, Wieneke GH, Dejonckere PH. The effect of relative humidity of inhaled air on acoustic parameters of voice in normal subjects. J Voice. 1997;11(3):295–300. doi: 10.1016/s0892-1997(97)80007-0. [DOI] [PubMed] [Google Scholar]
- 6.Roy N, Tanner K, Gray SD, Blomgren M, Fisher KV. An evaluation of the effects of three laryngeal lubricants on phonation threshold pressure (PTP) J Voice. 2003;17(3):331–42. doi: 10.1067/s0892-1997(03)00078-x. [DOI] [PubMed] [Google Scholar]
- 7.Verdolini-Marston K, Sandage M, Titze IR. Effect of hydration treatments on laryngeal nodules and polyps and related voice measures. J Voice. 1994;8(1):30–47. doi: 10.1016/s0892-1997(05)80317-0. [DOI] [PubMed] [Google Scholar]
- 8.Verdolini K, Min Y, Titze IR, et al. Biological mechanisms underlying voice changes due to dehydration. J Speech Lang Hear Res. 2002;45(2):268–81. doi: 10.1044/1092-4388(2002/021). [DOI] [PubMed] [Google Scholar]
- 9.Finkelhor BK, Titze IR, Durham PL. The effect of viscosity changes in the vocal folds on the range of oscillation. J Voice. 1988;1(4):320–5. [Google Scholar]
- 10.Sivasankar M, Fisher KV. Oral breathing increases pth and vocal effort by superficial drying of vocal fold mucosa. J Voice. 2002;16(2):172–81. doi: 10.1016/s0892-1997(02)00087-5. [DOI] [PubMed] [Google Scholar]
- 11.Witt RE, Regner MF, Tao C, Rieves AL, Zhuang P, Jiang JJ. Effect of dehydration on phonation threshold flow in excised canine larynges. Ann Otol Rhinol Laryngol. 2009;118(2):154–9. doi: 10.1177/000348940911800212. [DOI] [PMC free article] [PubMed] [Google Scholar]
- 12.Hemler RJ, Wieneke GH, Lebacq J, Dejonckere PH. Laryngeal mucosa elasticity and viscosity in high and low relative air humidity. Eur Arch Otorhinolaryngol. 2001;258(3):125–9. doi: 10.1007/s004050100321. [DOI] [PubMed] [Google Scholar]
- 13.Alipour F, Berry DA, Titze IR. A finite-element model of vocal-fold vibration. J Acoust Soc Am. 2000;108(6):3003–12. doi: 10.1121/1.1324678. [DOI] [PubMed] [Google Scholar]
- 14.Chan RW, Titze IR. Viscoelastic shear properties of human vocal fold mucosa: Theoretical characterization based on constitutive modeling. J Acoust Soc Am. 2000;107(1):565–80. doi: 10.1121/1.428354. [DOI] [PubMed] [Google Scholar]
- 15.Jiang JJ, Zhang Y, Stern J. Modeling of chaotic vibrations in symmetric vocal folds. J Acoust Soc Am. 2001;110(4):2120–8. doi: 10.1121/1.1395596. [DOI] [PubMed] [Google Scholar]
- 16.Titze IR. On the mechanics of vocal-fold vibration. J Acoust Soc Am. 1976;60(6):1366–80. doi: 10.1121/1.381230. [DOI] [PubMed] [Google Scholar]
- 17.Titze IR, Hunter EJ. Normal vibration frequencies of the vocal ligament. J Acoust Soc Am. 2004;115(5 Pt 1):2264–9. doi: 10.1121/1.1698832. [DOI] [PMC free article] [PubMed] [Google Scholar]
- 18.Zhang Y, Czerwonka L, Tao C, Jiang JJ. A biphasic theory for the viscoelastic behaviors of vocal fold lamina propria in stress relaxation. J Acoust Soc Am. 2008;123(3):1627–36. doi: 10.1121/1.2831739. [DOI] [PubMed] [Google Scholar]
- 19.Gray SD. Cellular physiology of the vocal folds. Otolaryngol Clin North Am. 2000;33(4):679–98. doi: 10.1016/s0030-6665(05)70237-1. [DOI] [PubMed] [Google Scholar]
- 20.Fisher KV, Ligon J, Sobecks JL, Roxe DM. Phonatory effects of body fluid removal. J Speech Lang Hear Res. 2001;44(2):354–67. doi: 10.1044/1092-4388(2001/029). [DOI] [PubMed] [Google Scholar]
- 21.Phillips R, Zhang Y, Keuler M, Tao C, Jiang J. Measurement of liquid and solid component parameters in canine vocal fold lamina propria. J Acoust Soc Am. 2009;125(4):2282–87. doi: 10.1121/1.3086276. [DOI] [PMC free article] [PubMed] [Google Scholar]
- 22.Tanner K, Roy N, Merrill RM, Elstad M. The effects of three nebulized osmotic agents in the dry larynx. J Speech Lang Hear Res. 2007;50(3):635–46. doi: 10.1044/1092-4388(2007/045). [DOI] [PubMed] [Google Scholar]
- 23.Jiang JJ, Titze IR. A methodological study of hemilaryngeal phonation. Laryngoscope. 1993;103(8):872–82. doi: 10.1288/00005537-199308000-00008. [DOI] [PubMed] [Google Scholar]
- 24.Chan RW, Titze IR. Effect of postmortem changes and freezing on the viscoelastic properties of vocal fold tissues. Ann Biomed Eng. 2003;31(4):482–91. doi: 10.1114/1.1561287. [DOI] [PubMed] [Google Scholar]